


|
시장보고서
상품코드
1693849
유럽의 폴리아미드 시장(2024-2029년) : 시장 점유율 분석, 산업 동향, 성장 예측Europe Polyamide - Market Share Analysis, Industry Trends & Statistics, Growth Forecasts (2024 - 2029) |
||||||
■ 보고서에 따라 최신 정보로 업데이트하여 보내드립니다. 배송일정은 문의해 주시기 바랍니다.
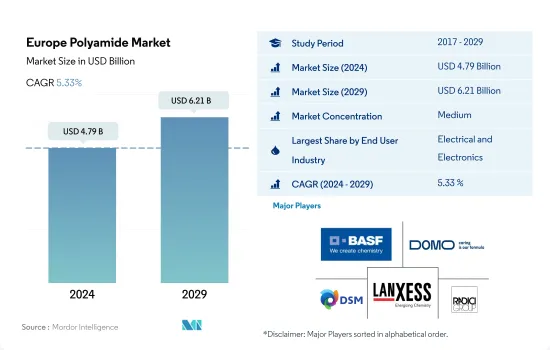
유럽의 폴리아미드 시장 규모는 2024년에 47억 9,000만 달러를 달성하였고 2029년에는 62억 1,000만 달러에 이를 전망이며 예측 기간(2024-2029년) 동안 CAGR 5.33%로 성장할 것으로 예측됩니다.

자동차산업과 전기 및 전자산업에서의 수요 증가가 시장 성장의 원동력이 될 전망
- 폴리아미드는 내마모성, 내부식성, 내약품성, 난연성, 유연성, 강도 등 제조 및 공업 용도로 최적인 여러가지 물리적 특성을 갖추고 있습니다.
- 유럽의 전기 및 전자산업은 기업이 재택 근무 모델을 도입하고 개인이 홈 오피스를 구축하면서 전자기기 수요가 급증했기 때문에 소비량이 가장 많습니다.
- 자동차산업은 자동차 생산이 급증하면서 두번째로 높은 소비율을 보이고 있습니다. 해당 산업은 2022년 폴리아미드 소비량의 약 26.6%를 차지하였습니다. 내연기관의 제조 및 생산에 대한 정부 규제로 인해 소비자는 전기자동차를 선택하고 있습니다. 조사 지역 내 폴리아미드 시장은 EV 및 최신 경량화 및 고연비 기술을 탑재한 자동차 생산의 증가로 인해 성장할 전망입니다.
- 항공우주산업은 예측 기간(2023-2029년) 동안 CAGR 7.97%로 소비액 2위의 급성장이 예상됩니다.
예측 기간 동안 독일이 우위를 유지할 전망
- 2022년 유럽은 세계의 폴리아미드(PA) 소비량의 25%를 차지했습니다.
- 독일은 최대 시장이며 2022년에는 금액 기준으로 전년대비 3.67%의 성장을 기록했습니다. 이는 기업이 재택 근무 모델을 채용하고 사람들이 홈 오피스를 구축한 결과입니다. EU는 수개월에 걸친 교섭 결과 2035년부터 전기차 이외의 신차를 사실상 금지하는 합의에 이르렀습니다. 이 합의는 전기자동차의 판매를 증가시켜, 이 지역의 폴리아미드 소비를 밀어 올릴 가능성이 있습니다.
- 프랑스는 가장 급성장하고 있는 시장으로, 2022년에는 금액 기준으로 2021년 대비 6.39%의 성장을 기록했습니다.
- 예측 기간(2023-2029) 중 CAGR은 5.52%를 보일 것으로 예측되며, 금액 기준으로는 포장산업이 8.08%로 가장 높은 CAGR을 나타낼 전망입니다.
유럽의 폴리아미드 시장 동향
기술 혁신이 소비자용 전자기기 시장을 밀어올릴 전망입니다.
- 유럽의 전기 및 전자기기 생산은 2017-2021년에 걸쳐 3.8% 이상의 CAGR을 기록했습니다.
- 원격 근무와 원격 학습에 의해 컴퓨터나 노트북 수요가 증가하고 있음에도 불구하고, 유럽의 소비자용 전자기기 부문의 사용자 1명당의 평균 매출액은 6.3% 감소했습니다.
- 2021년에는 유럽의 전기 및 전자기기 수출은 약 2,283억 7,000만 달러로 2020년에 비해 12.4% 증가했습니다.
- 로봇공학, 가상현실 및 증강현실, IoT(사물인터넷), 5G 연결은 예측 기간 동안 성장할 것으로 예측됩니다. 소비자 전자기기 부문은 2027년에는 약 1,572억 달러에 달할 것으로 예측됩니다.
유럽의 폴리아미드 산업 개요
유럽의 폴리아미드 시장은 적당히 통합되어 있으며 상위 5개 기업에서 58.73%를 차지하고 있습니다.
기타 혜택
- 엑셀 형식 시장 예측(ME) 시트
- 3개월간 애널리스트 서포트
목차
제1장 주요 요약과 주요 조사 결과
제2장 보고서 제안
제3장 소개
- 조사의 전제조건과 시장 정의
- 조사 범위
- 조사 방법
제4장 주요 산업 동향
- 최종 사용자 동향
- 항공우주
- 자동차
- 건축 및 건설
- 전기 및 전자
- 포장
- 수출입 동향
- 폴리아미드(PA) 무역
- 가격 동향
- 재활용 개요
- 폴리아미드(PA)의 리사이클 동향
- 규제 프레임워크
- EU
- 프랑스
- 독일
- 이탈리아
- 러시아
- 영국
- 밸류체인과 유통채널 분석
제5장 시장 세분화
- 최종 사용자 산업
- 항공우주
- 자동차
- 건축 및 건설
- 전기 및 전자
- 공업 및 기계
- 포장
- 기타
- 세부 수지 유형
- 아라미드
- 폴리아미드(PA) 6
- 폴리아미드(PA) 66
- 폴리프탈아미드
- 생산국
- 프랑스
- 독일
- 이탈리아
- 러시아
- 영국
- 기타 유럽
제6장 경쟁 구도
- 주요 전략 동향
- 시장 점유율 분석
- 기업 상황
- 기업 프로파일
- BASF SE
- Celanese Corporation
- Domo Chemicals
- DSM
- Grodno Azot
- Grupa Azoty SA
- Koch Industries, Inc.
- KuibyshevAzot
- LANXESS
- Radici Partecipazioni SpA
제7장 CEO에 대한 주요 전략적 질문
제8장 부록
- 세계 개요
- 개요
- Porter's Five Forces 분석 프레임워크(산업 매력도 분석)
- 세계의 밸류체인 분석
- 시장 역학(DROs)
- 정보원과 참고문헌
- 도표 일람
- 주요 인사이트
- 데이터 팩
- 용어집
The Europe Polyamide Market size is estimated at 4.79 billion USD in 2024, and is expected to reach 6.21 billion USD by 2029, growing at a CAGR of 5.33% during the forecast period (2024-2029).
Growing demand from automotive and electrical & electronics industries will drive market growth
- Polyamide has several physical properties that make it ideal for manufacturing and industrial use, including abrasion, corrosion, chemical resistance, flame resistance, flexibility, and strength. The volume of European polyamide consumption increased by 3.3% in 2019 compared to 2017 due to increased demand, primarily from the automotive and electrical and electronics industries.
- The European electrical and electronics industry has the highest consumption volume due to the surge in demand for electronic devices as a result of companies implementing work-from-home models and individuals establishing home offices. Technological advancements generate consistent demand for electronic devices year after year. The industry accounted for 26.9% of the total polyamide volume consumed in 2022, and the consumption volume increased by 1.5% in 2022 compared to 2017.
- The automotive industry has the second-largest consumption rate due to the surge in vehicle production. The industry accounted for around 26.6% of the total polyamide volume consumed in 2022. Consumers are opting for electric vehicles due to government regulations on the manufacturing and production of internal combustion engines. Polyamide sales in the region are expected to increase due to the growing production of EVs and vehicles with the latest lightweight and higher fuel efficiency requirements.
- The aerospace industry is expected to be the second fastest growing in terms of consumption value during the forecast period (2023-2029), with a CAGR of 7.97%, owing to the production of aircraft components in response to the growing demand for lighter and more fuel-efficient aircraft.
Germany to remain dominant during the forecast period
- In 2022, Europe accounted for 25% of the global polyamide (PA) consumption by volume. Polyamide's versatile properties make it applicable in various industries such as automotive, packaging, and electrical and electronics.
- Germany was the largest market, recording a growth of 3.67% by value in 2022 compared to the previous year, attributed to the electrical and electronics and automotive industries, which held 26% and 28% of the market share, respectively, by volume. The surge in demand for electronic devices is a consequence of companies adopting work-from-home models and people setting up home offices. After months of negotiations, the EU reached an agreement to effectively ban new non-electric cars from 2035. This agreement has increased the sales of electric vehicles, which may boost the consumption of polyamides in the region.
- France was the fastest-growing market, witnessing a growth of 6.39% in terms of value in 2022 compared to 2021. The electrical and electronics and aerospace industries are at the forefront of polyamide utilization in the country. France's aerospace and defense industry is export-driven and ranks second globally.
- The market is projected to record a CAGR of 5.52% during the forecast period [2023-2029], with the packaging industry reporting the highest CAGR of 8.08% by value. The packaging production volume is expected to reach 39.8 million tons in 2029, up from 30 million tons in 2022, thereby increasing the consumption of polyamides in the future.
Europe Polyamide Market Trends
Technological innovations to boost the consumer electronics market
- Europe's electrical and electronics production registered a CAGR of over 3.8% between 2017 and 2021. The rapid pace of electronic technological innovation is driving consistent demand for newer and faster electrical and electronic products. As a result, it has also increased the demand for electrical and electronics production in the region.
- Despite the increased demand for computers and laptops due to remote working and distance learning, the average revenue per user in the European consumer electronics segment dropped by 6.3%. It generated a revenue of around USD 252.1 billion in 2020. As a result, in 2020, the electrical and electronic production in the region decreased by 2.8% by revenue compared to the previous year.
- In 2021, Europe's electrical and electronic equipment exports were around USD 228.37 billion, 12.4% higher compared to 2020. As a result, electrical and electronic production in the region increased and registered 11.6% in 2021 compared to the previous year.
- Robotics, virtual reality and augmented reality, IoT (Internet of Things), and 5G connectivity are expected to grow during the forecast period. As a result of technological advancements, demand for consumer electronics is expected to rise during the forecast period. The consumer electronics segment in the region is projected to reach a revenue of around USD 157.2 billion in 2027 from USD 121.1 billion in 2023. By 2027, Europe is projected to be the second-largest electrical and electronics production accounting for around 12.7% of the global market. As a result, the rise in consumer electronics is projected to increase the demand for electrical and electronics production in the coming years.
Europe Polyamide Industry Overview
The Europe Polyamide Market is moderately consolidated, with the top five companies occupying 58.73%. The major players in this market are BASF SE, Domo Chemicals, DSM, LANXESS and Radici Partecipazioni SpA (sorted alphabetically).
Additional Benefits:
- The market estimate (ME) sheet in Excel format
- 3 months of analyst support
TABLE OF CONTENTS
1 EXECUTIVE SUMMARY & KEY FINDINGS
2 REPORT OFFERS
3 INTRODUCTION
- 3.1 Study Assumptions & Market Definition
- 3.2 Scope of the Study
- 3.3 Research Methodology
4 KEY INDUSTRY TRENDS
- 4.1 End User Trends
- 4.1.1 Aerospace
- 4.1.2 Automotive
- 4.1.3 Building and Construction
- 4.1.4 Electrical and Electronics
- 4.1.5 Packaging
- 4.2 Import And Export Trends
- 4.2.1 Polyamide (PA) Trade
- 4.3 Price Trends
- 4.4 Recycling Overview
- 4.4.1 Polyamide (PA) Recycling Trends
- 4.5 Regulatory Framework
- 4.5.1 EU
- 4.5.2 France
- 4.5.3 Germany
- 4.5.4 Italy
- 4.5.5 Russia
- 4.5.6 United Kingdom
- 4.6 Value Chain & Distribution Channel Analysis
5 MARKET SEGMENTATION (includes market size in Value in USD and Volume, Forecasts up to 2029 and analysis of growth prospects)
- 5.1 End User Industry
- 5.1.1 Aerospace
- 5.1.2 Automotive
- 5.1.3 Building and Construction
- 5.1.4 Electrical and Electronics
- 5.1.5 Industrial and Machinery
- 5.1.6 Packaging
- 5.1.7 Other End-user Industries
- 5.2 Sub Resin Type
- 5.2.1 Aramid
- 5.2.2 Polyamide (PA) 6
- 5.2.3 Polyamide (PA) 66
- 5.2.4 Polyphthalamide
- 5.3 Country
- 5.3.1 France
- 5.3.2 Germany
- 5.3.3 Italy
- 5.3.4 Russia
- 5.3.5 United Kingdom
- 5.3.6 Rest of Europe
6 COMPETITIVE LANDSCAPE
- 6.1 Key Strategic Moves
- 6.2 Market Share Analysis
- 6.3 Company Landscape
- 6.4 Company Profiles (includes Global Level Overview, Market Level Overview, Core Business Segments, Financials, Headcount, Key Information, Market Rank, Market Share, Products and Services, and Analysis of Recent Developments).
- 6.4.1 BASF SE
- 6.4.2 Celanese Corporation
- 6.4.3 Domo Chemicals
- 6.4.4 DSM
- 6.4.5 Grodno Azot
- 6.4.6 Grupa Azoty S.A.
- 6.4.7 Koch Industries, Inc.
- 6.4.8 KuibyshevAzot
- 6.4.9 LANXESS
- 6.4.10 Radici Partecipazioni SpA
7 KEY STRATEGIC QUESTIONS FOR ENGINEERING PLASTICS CEOS
8 APPENDIX
- 8.1 Global Overview
- 8.1.1 Overview
- 8.1.2 Porter's Five Forces Framework (Industry Attractiveness Analysis)
- 8.1.3 Global Value Chain Analysis
- 8.1.4 Market Dynamics (DROs)
- 8.2 Sources & References
- 8.3 List of Tables & Figures
- 8.4 Primary Insights
- 8.5 Data Pack
- 8.6 Glossary of Terms


샘플 요청 목록