|
시장보고서
상품코드
1836642
친환경 및 바이오 기반 용매 시장 : 점유율 분석, 산업 동향, 통계, 성장 예측(2025-2030년)Green And Bio-based Solvents - Market Share Analysis, Industry Trends & Statistics, Growth Forecasts (2025 - 2030) |
||||||
친환경 및 바이오 기반 용매 시장 규모는 2025년에 62억 9,000만 달러, 2030년에는 93억 1,000만 달러에 이를 것으로 예측되며, 예측 기간(2025-2030년)의 CAGR은 8.15%를 나타낼 전망입니다.

VOC 배출 규제 강화, 원유 가격 변동, 기업 지속가능성에 대한 광범위한 목표는 석유계 용매로부터 전환을 촉구하고 있습니다. 또한 장기적인 공급 리스크를 줄이는 재생 가능 원료의 풀 확대와 여전히 높은 제조 비용의 일부를 상쇄하는 세액 공제의 확대도 수요를 증가시키고 있습니다. 아시아태평양은 급속한 산업 성장과 중국과 인도의 야심적인 친환경 케미컬 정책이 섞여 있기 때문에 신규 생산량에 가장 강한 영향력을 가지고 있습니다.
세계의 친환경 및 바이오 기반 용매 시장 동향 및 통찰
엄격한 VOC 배출 규제
규제 당국은 코팅제, 접착제 및 소비자 제품의 용매 규제를 강화하고 있습니다. 캐나다의 2024년 규제는 130개 제품 등급을 다루고 난분해성 물질 및 유해 물질을 제한하는 EU의 REACH 업데이트와 쌍을 이루므로, 제제는 제품 라인을 재설계해야 합니다. 대체 프로그램은 새로운 VOC 규정을 저촉하지 않고 동일한 성능 사양을 충족하는 바이오 알코올과 에스테르를 선호합니다. EU의 '지속가능성을 위한 화학물질 전략'은 유해물질 규제의 범위를 확대하고 있으며, 이 정책의 기울기는 더욱 강해지고 있습니다.
원유가격의 변동성이 바이오 대체품에 박차를 가한다.
원유가격은 2024년 몇 차례에 걸쳐 두 자리 상승률을 보였으며 바이오 용매와 석유계 용매의 비용차이를 줄였습니다. 많은 바이어들은 원유가 미리 설정된 임계값을 초과하면 자동으로 대체품으로 전환되는 듀얼 소싱 조항을 마련함으로써 대응했습니다. 미국으로의 폐유 수입은 두 배로 늘어났으며, 원유가 완화되더라도 저탄소 폐기물 원료가 가격 우위를 유지할 수 있음이 입증되었습니다. 가격 헤지 전략은 운전 자금의 변동을 억제하고 바이오 용매의 장기 계약을 구매 관리자에게 더 매력적으로 만듭니다. 공급자를 위한 교훈은 명확합니다. 비용 경쟁력은 이제 절대 생산 비용과 마찬가지로 원료 스프레드 리스크 관리에 달려 있습니다.
생산비용 상승
발효 반응기, 비용이 많이 드는 정화 단계 및 플랜트 가동률이 낮기 때문에 바이오 용매의 비용 곡선은 기존의 석유 기반 용매에 비해 불리합니다. 최근 프로세스의 현대화로 인해 바이오프로파일렌 글리콜의 전환 비용은 25% 감소했지만, 인센티브가 풍부한 관할 구역을 제외하고는 그 차이는 여전히 큽니다. 많은 제조업체들은 바이오 용매를 보다 가치 있는 제품별로 결합하여 고정 비용을 여러 수익원에 분산시키고 경제성을 추구하고 있습니다. 또한 고객이 다운스트림 공정의 재설계를 피할 수 있는 드롭 인형 분자를 설계하여 총 변경 비용을 낮추는 제조업체도 있습니다. 브라운필드의 석유화학 자산의 전환이 진행될 때까지, 녹색 및 바이오계 용매 시장은 특히 상품화된 응용 분야에서 선택적인 가격 저항에 직면합니다.
보고서에서 분석된 기타 촉진요인 및 억제요인
- 기업의 ESG 서약과 친환경 조달 의무화
- 정부의 장려금과 세액 공제 증가
- 공급원료 변동 및 농산물 가격 변동
부문 분석
바이오알코올은 2024년 최대의 수익을 창출해 친환경 및 바이오 기반 용매 시장에서 37.2%의 점유율을 차지합니다. 성숙한 에탄올 발효조, 광범위한 농업 원료 공급 및 유연한 하류 혼합 라인이이 지위를 지원합니다. 락트산에틸의 CAGR 9.56%는 의약품 합성이나 전자기기 등급의 세정에 특유한 뛰어난 용해력과 생분해성을 가진 틈새 분자로의 전환을 강조합니다.
지역 분석
아시아태평양은 2024년 매출 점유율 45.2%로 친환경 및 바이오 용매 시장을 선도했으며 2030년까지 연평균 복합 성장률(CAGR) 8.77%로 가장 높습니다. 중국의 듀얼 카본 전략은 정유소와 다운스트림 수지 제조업체에 VOC 방출 억제를 강제하고, 재생 가능한 용매에 직접적인 흡인력을 낳고 있습니다.
북미는 연방과 국가의 엄격한 대기질 규제와 성숙한 바이오연료 인프라가 교차함으로써 이익을 얻고 있습니다. 유럽은 정책의 야망에서 두드러집니다. 그린 딜, 서큘러 이코노미 행동 계획, 국가 수준의 플라스틱 세금은 모두 재생 가능한 용매를 지원합니다.
남미와 아프리카는 수익이 아직 작지만 저렴한 원료 공급과 환경 의식이 높아지기 때문에 장기적으로 가치가 있습니다. 그러나 생산 능력 향상은 규제의 명확화와 인프라의 업그레이드에 달려 있으며, 모두 최고 러너 지역에 뒤처져 있습니다.
기타 혜택 :
- 엑셀 형식 시장 예측(ME) 시트
- 3개월의 애널리스트 서포트
목차
제1장 서론
- 조사의 전제조건과 시장 정의
- 조사 범위
제2장 조사 방법
제3장 주요 요약
제4장 시장 상황
- 시장 개요
- 시장 성장 촉진요인
- 엄격한 VOC 배출 규제
- 바이오 대안을 촉진하는 원유 가격 변동성
- 기업의 ESG 서약과 그린 조달의 의무화
- 바이오화학제품에 대한 정부의 우대조치와 세액공제 증가
- 재생 가능 원료의 세계적 확대
- 시장 성장 억제요인
- 생산비용 상승
- 원료 공급의 불안정성과 농산물 가격의 변동
- 기존 용매 회수 장치와의 호환성 제한
- 밸류체인 분석
- 기술적 전망
- 특허 분석
- Five Forces 분석
- 공급기업의 협상력
- 구매자의 협상력
- 신규 참가업체의 위협
- 대체품의 위협
- 경쟁도
제5장 시장 규모·성장 예측(금액)
- 유형별
- 바이오알코올
- 바이오에탄올
- 바이오메탄올
- 바이오프로판올
- 바이오부탄올
- 바이오글리콜
- 바이오프로파일렌글리콜
- 바이오에틸렌글리콜
- 바이오디올
- 락트산에틸
- D-리모넨
- 대두산 메틸
- 기타 유형
- 바이오알코올
- 용도별
- 페인트 및 코팅
- 산업용 및 가정용 청소
- 인쇄 잉크
- 접착제 및 실란트
- 의약품
- 화장품 및 퍼스널케어
- 농업
- 기타 용도
- 최종 사용자 산업별
- 자동차
- 건설
- 의약품 및 헬스케어
- 식음룢
- 소비재
- 농업
- 일렉트로닉스
- 기타
- 지역별
- 아시아태평양
- 중국
- 인도
- 일본
- 한국
- 아시아태평양의 기타 국가
- 북미
- 미국
- 캐나다
- 멕시코
- 유럽
- 독일
- 영국
- 프랑스
- 이탈리아
- 기타 유럽
- 남미
- 브라질
- 아르헨티나
- 기타 남미
- 중동 및 아프리카
- 사우디아라비아
- 남아프리카
- 기타 중동 및 아프리카
- 아시아태평양
제6장 경쟁 구도
- 시장 집중도
- 전략적 동향
- 시장 점유율 분석
- 기업 프로파일
- ADM
- BASF
- Bio Brands LLC
- Bioeutectics
- Braskem
- Cargill, Incorporated
- Corbion
- Covation Biomaterials
- Dow
- Elevance Renewable Sciences Inc.
- Florachem Corp.
- Florida Chemical Company
- Galactic
- Gevo
- GFBIOCHEMICALS
- LyondellBasell Industries Holdings BV
- Merck
- Peter Cremer Holding GmbH & Co. KG
- Sekab
- Solvay
- Vertec BioSolvents Inc.
제7장 시장 기회와 전망
SHW 25.10.28The Green And Bio-based Solvents Market size is estimated at USD 6.29 billion in 2025, and is expected to reach USD 9.31 billion by 2030, at a CAGR of 8.15% during the forecast period (2025-2030).
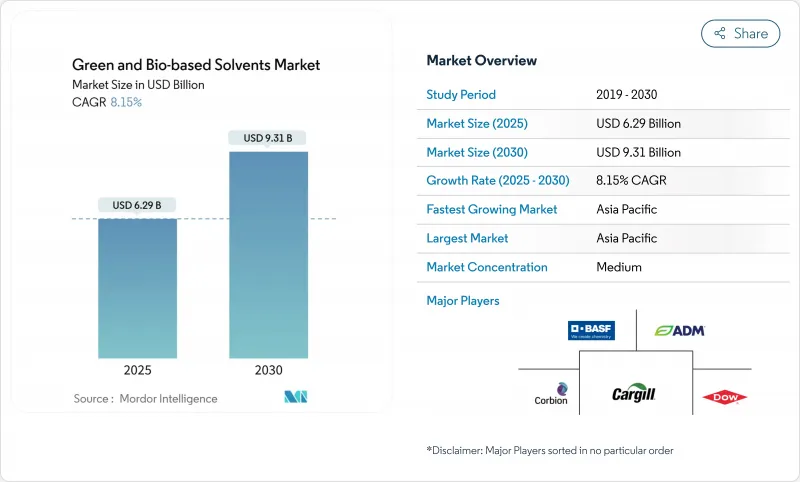
Tightening VOC-emission rules, crude-oil price swings, and broad corporate sustainability targets are pushing users to switch away from petroleum-based solvents. Demand also gains from a widening pool of renewable feedstocks that lowers long-term supply risk and from expanding tax credits that offset part of the still-higher production costs. Asia Pacific supplies the strongest pull on new volumes because rapid industrial growth intersects with ambitious green-chemistry policies in China and India.
Global Green And Bio-based Solvents Market Trends and Insights
Stringent VOC-emission Regulations
Regulatory agencies are tightening solvent rules across coatings, adhesives, and consumer products. Canada's 2024 limits cover 130 product classes and pair with EU REACH updates that restrict persistent and toxic substances, forcing formulators to redesign product lines. Replacement programs favor bio-alcohols and esters that meet the same performance specs without breaching new VOC caps. The policy tilt is reinforced by the EU Chemicals Strategy for Sustainability, which is widening the scope of hazardous-substance restrictions.
Volatility in Crude-oil Prices Fueling Bio-alternatives
Crude benchmarks jumped by double-digit percentages several times in 2024, narrowing the cost gap between bio-solvents and petro-solvents. Many buyers responded by writing dual-sourcing clauses that trigger automatic substitution when oil surpasses pre-set thresholds. Waste-oil imports into the United States doubled, proving that low-carbon waste feedstocks can hold price advantages even when crude oil eases. Price-hedge strategies reduce working-capital swings, making long-term contracts for bio-solvents more attractive to purchasing managers. The lesson for suppliers is clear: cost competitiveness now depends as much on managing feedstock spread risk as on absolute production costs.
Higher Production Costs
Fermentation reactors, costly purification steps, and lower plant utilization rates still give bio-solvents an unfavorable cost curve versus entrenched petro-equivalents. Recent process modernization trimmed bio-propylene glycol conversion costs by 25%, but the gap remains material outside incentive-rich jurisdictions. Many producers solve for economy by pairing bio-solvents with higher-value co-products, spreading fixed costs across multiple revenue streams. Others design drop-in molecules that allow customers to avoid re-tooling downstream processes, thereby lowering total cost of change. Until more brownfield petro-chemical assets convert, the green and bio-based solvents market faces selective price resistance, particularly in commoditized applications.
Other drivers and restraints analyzed in the detailed report include:
- Corporate ESG Pledges and Green Procurement Mandates
- Increasing Government Incentives and Tax Credits
- Feedstock Supply Volatility and Agri-price Swings
For complete list of drivers and restraints, kindly check the Table Of Contents.
Segment Analysis
Bio-alcohols generated the largest revenue slice in 2024, taking a 37.2% share of the green and bio-based solvents market. Mature ethanol fermenters, widespread agricultural feedstock supply, and flexible downstream blending lines support this position. Ethyl lactate's 9.56% CAGR underscores the pivot into niche molecules with superior solvency power and biodegradability, attributes prized in pharmaceutical synthesis and electronic-grade cleaning.
The Green and Bio-Based Solvents Market Report Segments the Industry by Type (Bio-Alcohols, Bio-Glycols, Bio-Diols, and More), Application (Paints and Coatings, Industrial and Domestic Cleaning, Printing Inks, Adhesives and Sealants, and More), End-User Industry (Automotive, Construction, Agriculture, and More), and Geography (Asia-Pacific, North America, Europe, South America, and Middle-East and Africa).
Geography Analysis
Asia Pacific led the green and bio-based solvents market with a 45.2% revenue share in 2024 and posts the highest 8.77% CAGR through 2030. China's dual-carbon strategy forces refineries and downstream resin producers to curb VOC releases, creating immediate pull for renewable solvents.
North America benefits from the intersection of strict federal and state air-quality rules and a mature biofuel infrastructure. Europe stands out for policy ambition. The Green Deal, the Circular Economy Action Plan, and country-level plastic taxes all favor renewable solvents.
South America and Africa remain smaller in revenue but hold long-run value because they combine cheap feedstock availability with rising environmental awareness. Capacity build-outs, however, depend on regulatory clarity and infrastructure upgrades, both of which lag the front-runner regions.
- ADM
- BASF
- Bio Brands LLC
- Bioeutectics
- Braskem
- Cargill, Incorporated
- Corbion
- Covation Biomaterials
- Dow
- Elevance Renewable Sciences Inc.
- Florachem Corp.
- Florida Chemical Company
- Galactic
- Gevo
- GFBIOCHEMICALS
- LyondellBasell Industries Holdings B.V.
- Merck
- Peter Cremer Holding GmbH & Co. KG
- Sekab
- Solvay
- Vertec BioSolvents Inc.
Additional Benefits:
- The market estimate (ME) sheet in Excel format
- 3 months of analyst support
TABLE OF CONTENTS
1 Introduction
- 1.1 Study Assumptions and Market Definition
- 1.2 Scope of the Study
2 Research Methodology
3 Executive Summary
4 Market Landscape
- 4.1 Market Overview
- 4.2 Market Drivers
- 4.2.1 Stringent VOC-emission regulations
- 4.2.2 Volatility in crude-oil prices fuelling bio-alternatives
- 4.2.3 Corporate ESG pledges and green procurement mandates
- 4.2.4 Increasing Government incentives and tax credits for bio-chemicals
- 4.2.5 Global Expansion of Renewable Feedstock Availability
- 4.3 Market Restraints
- 4.3.1 Higher production costs
- 4.3.2 Feed-stock supply volatility and agri-price swings
- 4.3.3 Limited compatibility with legacy solvent-recovery units
- 4.4 Value Chain Analysis
- 4.5 Technological Outlook
- 4.6 Patent Analysis
- 4.7 Porter's Five Forces
- 4.7.1 Bargaining Power of Suppliers
- 4.7.2 Bargaining Power of Buyers
- 4.7.3 Threat of New Entrants
- 4.7.4 Threat of Substitutes
- 4.7.5 Degree of Competition
5 Market Size and Growth Forecasts (Value)
- 5.1 By Type
- 5.1.1 Bio-alcohols
- 5.1.1.1 Bio-ethanol
- 5.1.1.2 Bio-methanol
- 5.1.1.3 Bio-propanol
- 5.1.1.4 Bio-butanol
- 5.1.2 Bio-glycols
- 5.1.2.1 Bio-based Propylene Glycol
- 5.1.2.2 Bio-based Ethylene Glycol
- 5.1.3 Bio-diols
- 5.1.4 Ethyl Lactate
- 5.1.5 D-Limonene
- 5.1.6 Methyl Soyate
- 5.1.7 Other Types
- 5.1.1 Bio-alcohols
- 5.2 By Application
- 5.2.1 Paints and Coatings
- 5.2.2 Industrial and Domestic Cleaning
- 5.2.3 Printing Inks
- 5.2.4 Adhesives and Sealants
- 5.2.5 Pharmaceuticals
- 5.2.6 Cosmetics and Personal Care
- 5.2.7 Agriculture
- 5.2.8 Other Applications
- 5.3 By End-User Industry
- 5.3.1 Automotive
- 5.3.2 Construction
- 5.3.3 Pharmaceutical and Healthcare
- 5.3.4 Food and Beverages
- 5.3.5 Consumer Goods
- 5.3.6 Agriculture
- 5.3.7 Electronics
- 5.3.8 Others
- 5.4 By Geography
- 5.4.1 Asia Pacific
- 5.4.1.1 China
- 5.4.1.2 India
- 5.4.1.3 Japan
- 5.4.1.4 South Korea
- 5.4.1.5 Rest of APAC
- 5.4.2 North America
- 5.4.2.1 United States
- 5.4.2.2 Canada
- 5.4.2.3 Mexico
- 5.4.3 Europe
- 5.4.3.1 Germany
- 5.4.3.2 United Kingdom
- 5.4.3.3 France
- 5.4.3.4 Italy
- 5.4.3.5 Rest of Europe
- 5.4.4 South America
- 5.4.4.1 Brazil
- 5.4.4.2 Argentina
- 5.4.4.3 Rest of South America
- 5.4.5 Middle East and Africa
- 5.4.5.1 Saudi Arabia
- 5.4.5.2 South Africa
- 5.4.5.3 Rest of Middle East and Africa
- 5.4.1 Asia Pacific
6 Competitive Landscape
- 6.1 Market Concentration
- 6.2 Strategic Moves
- 6.3 Market Share Analysis
- 6.4 Company Profiles (includes Global level Overview, Market level overview, Core Segments, Financials as available, Strategic Information, Market Rank/Share for key companies, Products and Services, and Recent Developments)
- 6.4.1 ADM
- 6.4.2 BASF
- 6.4.3 Bio Brands LLC
- 6.4.4 Bioeutectics
- 6.4.5 Braskem
- 6.4.6 Cargill, Incorporated
- 6.4.7 Corbion
- 6.4.8 Covation Biomaterials
- 6.4.9 Dow
- 6.4.10 Elevance Renewable Sciences Inc.
- 6.4.11 Florachem Corp.
- 6.4.12 Florida Chemical Company
- 6.4.13 Galactic
- 6.4.14 Gevo
- 6.4.15 GFBIOCHEMICALS
- 6.4.16 LyondellBasell Industries Holdings B.V.
- 6.4.17 Merck
- 6.4.18 Peter Cremer Holding GmbH & Co. KG
- 6.4.19 Sekab
- 6.4.20 Solvay
- 6.4.21 Vertec BioSolvents Inc.
7 Market Opportunities and Future Outlook
- 7.1 White-space and Unmet-Need Assessment