
|
시장보고서
상품코드
1844536
파이토뉴트리언트 : 시장 점유율 분석, 산업 동향, 통계, 성장 예측(2025-2030년)Phytonutrients - Market Share Analysis, Industry Trends & Statistics, Growth Forecasts (2025 - 2030) |
||||||
파이토뉴트리언트 시장 규모는 2025년에 63억 9,000만 달러로 평가되었고, CAGR은 6.73%를 나타낼 것으로 예측되며, 2030년에 88억 4,000만 달러에 이를 것으로 전망됩니다.

성장은 세 가지 수렴하는 힘에서 비롯됩니다. 소비자들은 이제 ‘자연적'을 '건강한'과 동일시하며, 규제 기관들은 계속해서 승인 목록에서 합성 첨가물을 제거하고 있으며, 초임계 CO2 및 용매 없는 발효와 같은 추출 기술이 생산 비용을 낮추고 있습니다. 2025년 2월 FDA는 단일 영양소가 아닌 영양소 밀도를 중심으로 '건강한’ 가공 식품을 재정의하는 규정을 발표하여 식물성 영양소로 강화된 제품에 새로운 라벨 표기 경로를 열어줍니다. 한편, 나비콩꽃과 갈디에리아 추출물 청색 착색제의 신규 승인은 식물 유래 원료에 대한 공식적 지지를 시사합니다. 만성 질환 부담이 심화되면서 예방 건강을 위한 폴리페놀, 카로티노이드, 식물 스테롤에 대한 과학적·상업적 관심이 가속화되는 가운데, 축산 사료 제조사들은 가축의 장벽 기능과 성장 성능 향상을 위해 복합 파이토뉴트리언트 혼합물을 도입하고 있습니다.
세계의 파이토뉴트리언트 시장 동향 및 인사이트
클린 라벨 식품 및 음료에 대한 수요 증가
2024년 FDA의 식품용 적색 3호(Red Dye No. 3) 사용 금지 조치로 제조업체들은 천연 대체재로 제품 재구성을 추진했습니다. 식품·음료 기업들은 브랜드 전략, 규제 요건, 감각적 요구 사항을 충족하기 위해 스피루리나, 비트 뿌리 적색, 카로티노이드 등 천연 색소 성분을 점점 더 많이 도입하고 있습니다. 제조사들은 2025년 소매 가격을 12-15% 인상함으로써 증가한 원자재 비용을 성공적으로 상쇄했습니다. 특히 천연 심유태성 용매를 활용한 첨단 추출 기술 도입으로 기존 에탄올 공정 대비 10% 이상의 수율 향상을 달성하면서 지속가능성 목표도 지원하고 있습니다. 클린 라벨 원료로의 산업 전환은 전문 시장 부문에서 주요 소비자 고려 사항으로 크게 진화했으며, 이는 파이토뉴트리언트 시장의 지속적인 성장을 뒷받침하고 있습니다. 이러한 변화는 식품에 대한 천연 원료와 투명성에 대한 소비자의 광범위한 선호도를 반영합니다.
예방 의료 및 웰니스에 대한 소비자 인식 제고
예방 의료에 대한 인식이 높아지면서 모든 인구 통계군에서 파이토뉴트리언트가 풍부한 제품에 대한 소비자 수요가 증가했습니다. 이러한 변화는 건강 의식의 광범위한 전환을 반영하며, 소비자들이 웰니스 루틴을 위해 적극적으로 천연 화합물을 찾는 현상을 보여줍니다. 파이토뉴트리언트가 염증 및 면역 기능에 미치는 영향을 입증한 연구는 증거 기반 건강 솔루션을 찾는 소비자에게 과학적 타당성을 제공했습니다. 다수의 임상 연구에서 이러한 화합물이 다양한 생물학적 과정을 조절하고 전반적인 건강 유지에 도움을 줄 수 있음을 보여주었습니다. 피토솜과 같은 첨단 전달 시스템은 파이토뉴트리언트의 흡수를 개선하여 효과적인 제품에 대한 소비자 요구를 충족시키고 높은 가격대를 뒷받침합니다. 이러한 기술적 개선으로 제조업체들은 식물성 화합물의 치료 잠재력을 극대화하면서도 생체 이용률을 높인 효율적인 제형을 개발할 수 있게 되었습니다.
파이토뉴트리언트 추출 및 가공과 관련된 높은 생산 비용
높은 생산 비용은 가격에 민감한 소비자의 접근성을 제한하고 제조업체의 이익을 감소시켜 시장 성장을 저해합니다. 전통적인 추출 방법은 상당한 에너지와 특수 장비를 필요로 하며, 특히 초임계 CO2 시스템은 제조업체에게 막대한 자본 투자를 요구합니다. 아임계 수처리 및 천연 심유태 용매와 같은 새로운 추출 기술은 제품 품질과 환경 기준을 유지하면서 비용을 절감할 수 있습니다. 많은 파이토뉴트리언트 카테고리는 응용 분야와 지역에 걸쳐 수요가 분산되어 규모의 경제를 달성하기 어렵습니다. 미생물 발효 및 식물 세포 배양과 같은 생명공학 방법은 장기적인 생산 비용을 낮추고 농업적 한계를 극복할 수 있지만 상당한 초기 투자가 필요합니다. 농업 부산물을 파이토뉴트리언트 원료로 활용하면 비용 절감과 지속가능성 향상에 기여합니다.
부문 분석
카로티노이드는 식품 및 보충제에서 착색제 및 항산화제로의 오랜 사용을 바탕으로 2024년 파이토뉴트리언트 시장 점유율의 38.45%를 차지했습니다. 산화제 제거 능력과 프로비타민 A 기능으로 수요가 안정적입니다. 반면 폴리페놀은 심장 보호 및 신경 보호 효과에 대한 증거가 증가함에 따라 가장 높은 9.55%의 연평균 복합 성장률(CAGR)을 기록했습니다. 발효 기반 합성 기술은 계절적 작물 한계를 극복하여 배치 간 일관성을 개선하고 용매 잔류물을 감소시킵니다. 이는 클린 라벨 브랜드 소유자에게 매력적인 장점입니다.
강력한 임상 검증과 비용 효율적인 생산으로 카로티노이드는 파이토뉴트리언트 시장의 수익 기반을 유지할 것입니다. 그러나 갈로일 풍부 타닌, 레스베라트롤 유사체, 플라보놀 글리코사이드 분야의 혁신으로 폴리페놀은 두 자릿수 성장을 향해 나아가며, 이는 10년 후반까지 카로티노이드의 우위를 잠식할 수 있습니다. 정밀 영양 플랫폼이 유전자 변이와 산화 스트레스 지표를 연결함에 따라 개인 건강 프로필에 맞춤화된 폴리페놀 블렌드가 주목받고 있습니다. 이러한 추세는 광범위한 파이토뉴트리언트 시장 내에서 점진적으로 재조정되는 제품 구성을 예고합니다.
과일과 채소는 광범위한 농업 생산과 소비자 신뢰에 힘입어 2024년 파이토뉴트리언트 시장의 53.75%를 차지했습니다. 토마토 찌꺼기, 양파 껍질, 포도 찌꺼기 같은 식품 가공 부산물이 원료로 점점 더 많이 사용되면서 폐기물을 가치 있는 제품으로 전환하고 환경적 영향을 줄이고 있습니다. 미국 농무부(USDA)는 2023년 채소 생산량이 7억 5,800만 cwt(중량 단위)로 충분한 원료 공급을 보장한다고 보고했습니다.
허브와 나무는 아슈와간다, 인삼, 녹차 카테킨의 적응성 화합물에 대한 관심에 힘입어 8.45%의 가장 빠른 연평균 성장률(CAGR)을 기록했습니다. 표준화된 추출 프로토콜은 일관된 효능을 보장하여 역사적인 품질 관리 문제를 완화합니다. 곡물, 콩류, 유종은 비용 효율적인 규모를 제공하지만 식품용 수요와 경쟁해야 합니다. 해조류와 합성생물학 플랫폼은 순도와 환경 통제를 약속하는 장기적 대안이지만, 파이토뉴트리언트 시장을 재편하기 전에 추가적인 비용 최적화가 필요합니다.
지역 분석
북미는 2024년 파이토뉴트리언트 시장의 41.65%를 차지했으며, 이는 강력한 규제 명확성, 연구 개발 투자, 그리고 프리미엄 가격 지불 의사가 있는 소비자 기반을 바탕으로 합니다. 최근 FDA가 나비콩꽃과 갈디에리아 유래 청색 색소를 승인함으로써 천연 착색제 공급이 증가하여 시장 신뢰도를 더욱 강화하고 있습니다. 이 지역의 농산물 생산량(2023년 채소 7억 5,800만 cwt 포함)은 안정적인 원료 공급을 보장합니다. 전자상거래와 맞춤형 영양 구독 모델은 슈퍼푸드 블렌드 및 맞춤형 젤리의 소비자 직접 구매(DTC) 확산을 가속화합니다.
아시아태평양 지역은 중산층 인구 확대, 진보적인 규제, 전통 의학 유산에 힘입어 연평균 8.65% 성장률로 가장 빠르게 성장하는 지역입니다. 미세조류 오일 및 프로안토시아니딘 등 신규 건강식품 원료에 대한 중국의 승인은 허용 원료 목록을 풍부하게 하고 제품 혁신의 폭을 넓힙니다(cfda.com). 인도 아유르베다와 일본 기능성 식품 표시 제도는 파이토뉴트리언트 사용을 더욱 주류화하는 한편, 현지 계약 제조 생태계는 생산 비용을 절감하여 수출 경쟁력을 강화합니다.
유럽은 엄격한 품질 및 지속가능성 기준에 힘입어 꾸준한 성장을 기록하고 있습니다. 녹색 추출 기술과 생애주기 평가 보고서의 도입은 프리미엄 브랜드 포지셔닝을 지원하지만, EU 회원국 간 규제 조정의 분산은 시간과 비용을 추가합니다. 남미와 중동 및 아프리카는 아직 초기 단계이지만 유망합니다. 브라질의 풍부한 농업 자원과 걸프협력회의(GCC) 지역의 신흥 기능성 식품 수요는 파이토뉴트리언트 시장의 미래 확장을 위한 비옥한 토양을 조성합니다.
기타 혜택 :
- 엑셀 형식 시장 예측(ME) 시트
- 3개월의 애널리스트 지원
목차
제1장 서론
- 조사의 전제조건과 시장 정의
- 조사 범위
제2장 조사 방법
제3장 주요 요약
제4장 시장 상황
- 시장 개요
- 시장 성장 촉진요인
- 클린 라벨 식품 및 음료 강화에 대한 수요 급증
- 예방 의료 및 웰니스에 대한 소비자 인식 제고
- 만성 질환 및 건강 상태의 유병률의 상승
- 면역 강화 제품에 대한 수요 증가
- 식품에 천연 및 식물성 원료 수요 증가
- 사료에 파이토뉴트리언트의 통합
- 시장 성장 억제요인
- 피토뉴트리엔트의 추출과 가공에 따른 높은 생산 비용
- 계절적 의존성과 농업적 제약으로 인한 원료 공급 제한
- 지역별 복잡한 규제 요건 및 승인 절차스
- 낮은 생산 비용의 합성 대체재와의 경쟁
- 공급망 분석
- 규제 상황
- 기술적 전망
- Porter's Five Forces 분석
- 신규 진입업자의 위협
- 구매자의 협상력
- 공급기업의 협상력
- 대체품의 위협
- 경쟁 기업간 경쟁 관계
제5장 시장 규모와 성장 예측
- 유형별
- 카로티노이드
- 폴리페놀
- 피토스테롤
- 오메가-3 지방산과 오메가-6 지방산
- 비타민
- 기타
- 원료별
- 과일 및 채소
- 곡류, 콩류, 기름씨
- 허브와 나무
- 기타
- 형태별
- 분말
- 액체
- 기타
- 용도별
- 음식
- 영양보조식품
- 동물영양
- 화장품 및 퍼스널케어
- 의약품
- 지역별
- 북미
- 미국
- 캐나다
- 멕시코
- 기타 북미
- 유럽
- 독일
- 영국
- 이탈리아
- 프랑스
- 스페인
- 네덜란드
- 기타 유럽
- 아시아태평양
- 중국
- 인도
- 일본
- 호주
- 한국
- 기타 아시아태평양
- 남미
- 브라질
- 아르헨티나
- 기타 남미
- 중동 및 아프리카
- 남아프리카
- 사우디아라비아
- 아랍에미리트(UAE)
- 기타 중동 및 아프리카
- 북미
제6장 경쟁 구도
- 시장의 집중
- 전략적인 동향
- 시장 랭킹 분석
- 기업 프로파일
- Cargill Inc.
- BASF SE
- Archer Daniels Midland Company
- DSM-Firmenich
- Kerry Group
- Givaudan SA
- Kemin Industries
- Lycored Ltd.
- Sabinsa Corp.
- Indena SpA
- International Flavors and Fragrances Inc.
- Ingredion Inc.
- Tate and Lyle PLC
- Arla Foods amba
- Roquette Freres
- Kalsec Inc.
- Prinova Group
- Foodchem International
- Zhejiang Medicine Co.
- Guangzhou Leader Bio-Tech
제7장 시장 기회와 전망
HBR 25.11.03The phytonutrients market size is estimated at USD 6.39 billion in 2025 and is expected to reach USD 8.84 billion by 2030, reflecting a 6.73% CAGR.
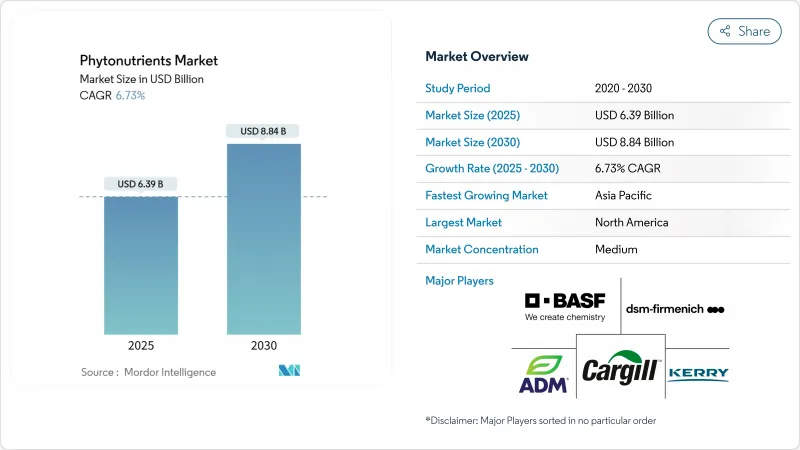
Growth stems from three converging forces: consumers now equate "natural" with "healthy," regulators continue to remove synthetic additives from approved lists, and extraction technologies such as supercritical CO2 and solvent-free fermentation are lowering production costs. February 2025 FDA rules that redefine "healthy" prepared foods around nutrient density rather than single nutrients open new label-claim pathways for products fortified with phytonutrients. Meanwhile, fresh approvals of butterfly pea flower and Galdieria extract blue colorants signal official support for plant-derived ingredients. Intensifying chronic-disease burdens accelerate scientific and commercial interest in polyphenols, carotenoids, and phytosterols for preventive health, while animal-feed manufacturers adopt complex phytonutrient blends to improve gut barrier function and growth performance in livestock
Global Phytonutrients Market Trends and Insights
Surging Demand for Clean-Label Food and Beverage Fortification
The FDA's delisting of Red Dye No. 3 for food applications in 2024 prompted manufacturers to reformulate their products with natural alternatives. Food and beverage companies are increasingly incorporating natural color ingredients such as spirulina, beetroot red, and carotenoids to meet their branding, regulatory, and sensory requirements. Manufacturers have successfully offset the increased raw material costs through retail price premiums of 12-15% in 2025. The implementation of advanced extraction methods, particularly natural deep eutectic solvents, has achieved yield improvements exceeding 10% compared to traditional ethanol processes while supporting sustainability goals. The industry's transition toward clean-label ingredients has evolved significantly from a specialized market segment to become a primary consumer consideration, which continues to support sustained growth in the phytonutrients market. This shift reflects broader consumer preferences for natural ingredients and transparency in food products.
Heightened Consumer Awareness About Preventive Healthcare and Wellness
Growing awareness of preventive healthcare has increased consumer demand for phytonutrient-enriched products across all demographics. This shift reflects a broader transformation in health consciousness, where consumers actively seek natural compounds for their wellness routines. Research demonstrating phytonutrients' effects on inflammation and immune function has provided scientific validation that appeals to consumers seeking evidence-based health solutions. Multiple clinical studies have shown these compounds can help regulate various biological processes and support overall health maintenance. Advanced delivery systems like phytosomes improve the absorption of phytonutrients, meeting consumer requirements for effective products and supporting higher price points. These technological improvements have enabled manufacturers to develop more efficient formulations that maximize the therapeutic potential of plant-based compounds while ensuring better bioavailability.
High Production Costs Associated with Phytonutrient Extraction and Processing
High production costs limit market growth by restricting access to price-sensitive consumers and reducing manufacturer profits. Traditional extraction methods require substantial energy and specialized equipment, particularly supercritical CO2 systems that demand significant capital investment from manufacturers. New extraction technologies, such as subcritical water processing and natural deep eutectic solvents, may reduce costs while maintaining product quality and environmental standards. Many phytonutrient categories struggle to achieve economies of scale due to scattered demand across applications and regions. While biotechnology methods like microbial fermentation and plant cell culture could lower long-term production costs and overcome agricultural limitations, they require substantial initial investment. Using agricultural by-products as phytonutrient sources helps reduce costs and improve sustainability.
Other drivers and restraints analyzed in the detailed report include:
- Rising Prevalence of Chronic Diseases and Health Conditions
- Accelerating Demand for Immunity-Boosting Products
- Limited Availability of Raw Materials Due to Seasonal Dependencies and Agricultural Constraints
For complete list of drivers and restraints, kindly check the Table Of Contents.
Segment Analysis
Carotenoids secured 38.45% of the phytonutrients market share in 2024, anchored in long-standing uses as colorants and antioxidants in foods and supplements. Their oxide-scavenging capacity and Provitamin A functions keep demand stable. Conversely, polyphenols deliver the highest 9.55% CAGR on mounting evidence of cardioprotective and neuroprotective benefits. Fermentation-based synthesis now sidesteps seasonal crop limits, improving batch-to-batch consistency and reducing solvent residues-all persuasive advantages for clean-label brand owners.
Strong clinical validation and cost-efficient production ensure carotenoids remain the revenue anchor of the phytonutrients market. However, innovations in galloyl-rich tannins, resveratrol analogs, and flavonol glycosides propel polyphenols toward double-digit gains, which could erode carotenoids' dominance by the late decade. As precision-nutrition platforms link gene variants to oxidative-stress markers, polyphenol blends tailored to personal health profiles gain traction. These trends foreshadow a gradually rebalancing product mix within the wider phytonutrients market.
Fruits and vegetables accounted for 53.75% of the phytonutrients market in 2024, supported by extensive agricultural production and consumer trust. Food processing byproducts such as tomato pomace, onion skins, and grape marc are increasingly used as raw materials, converting waste into valuable products while reducing environmental impact. The United States Department of Agriculture (USDA) reported vegetable production of 758 million cwt in 2023, ensuring a sufficient raw material supply.
Herbs and trees chart the fastest 8.45% CAGR, propelled by interest in adaptogenic compounds from ashwagandha, ginseng, and green tea catechins. Standardized extraction protocols ensure consistent potency, alleviating historical quality-control concerns. Cereals, pulses, and oilseeds offer cost-efficient scale yet must compete with food-use demand. Marine algae and synthetic-biology platforms represent longer-term alternatives that promise purity and environmental control but require further cost optimization before they reshape the phytonutrients market.
The Phytonutrients Market Report is Segmented by Type (Carotenoids, Polyphenols, and More), Source (Fruits and Vegetables, Cereals, Pulses, and Oilseeds, and More), Form (Powder, Liquid, Others), Application (Food and Beverages, Dietary Supplements, Animal Nutrition, and More), and Geography (North America, Europe, Asia-Pacific, South America, Middle East and Africa). The Market Forecasts are Provided in Terms of Value (USD).
Geography Analysis
North America held 41.65% of the phytonutrients market in 2024, leveraging robust regulatory clarity, investment in research and development, and consumer readiness to pay premium prices. Recent FDA approvals of butterfly pea flower and Galdieria-derived blue pigment boost the supply of natural colorants, further reinforcing market confidence. The region's produce output, including 758 million cwt of vegetables in 2023, guarantees steady raw-material flows. E-commerce and personalized-nutrition subscription models accelerate direct-to-consumer adoption of superfood blends and targeted gummies.
Asia-Pacific is the fastest-growing region at an 8.65% CAGR, fueled by expanding middle-class populations, progressive regulations, and traditional-medicine heritage. China's approval of new health-food ingredients such as microalgae oil and proanthocyanidins enriches the permissible ingredient list and widens product innovation latitude cfda.com. Indian Ayurveda and Japanese Foods with Function Claims further mainstream phytonutrient usage, while local contract-manufacturing ecosystems reduce production costs, enhancing export competitiveness.
Europe posts steady growth underpinned by stringent quality and sustainability standards. Adoption of green extraction technologies and life-cycle-assessment reporting supports premium brand positioning, though fragmented regulatory alignment across EU members adds time and cost. South America and the Middle East and Africa remain nascent but promising; agricultural abundance in Brazil and emerging nutraceutical demand in the Gulf Cooperation Council create fertile terrain for the future expansion of the phytonutrients market.
- Cargill Inc.
- BASF SE
- Archer Daniels Midland Company
- DSM-Firmenich
- Kerry Group
- Givaudan SA
- Kemin Industries
- Lycored Ltd.
- Sabinsa Corp.
- Indena SpA
- International Flavors and Fragrances Inc.
- Ingredion Inc.
- Tate and Lyle PLC
- Arla Foods amba
- Roquette Freres
- Kalsec Inc.
- Prinova Group
- Foodchem International
- Zhejiang Medicine Co.
- Guangzhou Leader Bio-Tech
Additional Benefits:
- The market estimate (ME) sheet in Excel format
- 3 months of analyst support
TABLE OF CONTENTS
1 INTRODUCTION
- 1.1 Study Assumptions and Market Definition
- 1.2 Scope of the Study
2 RESEARCH METHODOLOGY
3 EXECUTIVE SUMMARY
4 MARKET LANDSCAPE
- 4.1 Market Overview
- 4.2 Market Drivers
- 4.2.1 Surging demand for clean-label food and beverage fortification
- 4.2.2 Heightened consumer awareness about preventive healthcare and wellness
- 4.2.3 Rising prevalence of chronic diseases and health conditions
- 4.2.4 Accelerating demand for immunity-boosting products
- 4.2.5 Increasing demand for natural and plant-based ingredients in food products
- 4.2.6 Integration of phytonutrients in animal feed
- 4.3 Market Restraints
- 4.3.1 High production costs associated with phytonutrient extraction and processing
- 4.3.2 Limited availability of raw materials due to seasonal dependencies and agricultural constraints
- 4.3.3 Complex regulatory requirements and approval processes across different regions
- 4.3.4 Competition from synthetic alternatives with lower production costs
- 4.4 Supply Chain Analysis
- 4.5 Regulatory Landscape
- 4.6 Technological Outlook
- 4.7 Porter's Five Forces Analysis
- 4.7.1 Threat of New Entrants
- 4.7.2 Bargaining Power of Buyers
- 4.7.3 Bargaining Power of Suppliers
- 4.7.4 Threat of Substitutes
- 4.7.5 Competitive Rivalry
5 MARKET SIZE AND GROWTH FORECASTS
- 5.1 By Type
- 5.1.1 Carotenoids
- 5.1.2 Polyphenols
- 5.1.3 Phytosterols
- 5.1.4 Omega-3 and 6 Fatty Acids
- 5.1.5 Vitamins
- 5.1.6 Others
- 5.2 By Source
- 5.2.1 Fruits and Vegetables
- 5.2.2 Cereals, Pulses, and Oilseeds
- 5.2.3 Herbs and Trees
- 5.2.4 Other Sources
- 5.3 By Form
- 5.3.1 Powder
- 5.3.2 Liquid
- 5.3.3 Others
- 5.4 By Application
- 5.4.1 Food and Beverages
- 5.4.2 Dietary Supplements
- 5.4.3 Animal Nutrition
- 5.4.4 Cosmetics and Personal Care
- 5.4.5 Pharmaceuticals
- 5.5 By Geography
- 5.5.1 North America
- 5.5.1.1 United States
- 5.5.1.2 Canada
- 5.5.1.3 Mexico
- 5.5.1.4 Rest of North America
- 5.5.2 Europe
- 5.5.2.1 Germany
- 5.5.2.2 United Kingdom
- 5.5.2.3 Italy
- 5.5.2.4 France
- 5.5.2.5 Spain
- 5.5.2.6 Netherlands
- 5.5.2.7 Rest of Europe
- 5.5.3 Asia-Pacific
- 5.5.3.1 China
- 5.5.3.2 India
- 5.5.3.3 Japan
- 5.5.3.4 Australia
- 5.5.3.5 South Korea
- 5.5.3.6 Rest of Asia-Pacific
- 5.5.4 South America
- 5.5.4.1 Brazil
- 5.5.4.2 Argentina
- 5.5.4.3 Rest of South America
- 5.5.5 Middle East and Africa
- 5.5.5.1 South Africa
- 5.5.5.2 Saudi Arabia
- 5.5.5.3 United Arab Emirates
- 5.5.5.4 Rest of Middle East and Africa
- 5.5.1 North America
6 COMPETITIVE LANDSCAPE
- 6.1 Market Concentration
- 6.2 Strategic Moves
- 6.3 Market Ranking Analysis
- 6.4 Company Profiles (includes Global level Overview, Market level overview, Core Segments, Financials (if available), Strategic Information, Market Rank/Share for key companies, Products and Services, and Recent Developments)
- 6.4.1 Cargill Inc.
- 6.4.2 BASF SE
- 6.4.3 Archer Daniels Midland Company
- 6.4.4 DSM-Firmenich
- 6.4.5 Kerry Group
- 6.4.6 Givaudan SA
- 6.4.7 Kemin Industries
- 6.4.8 Lycored Ltd.
- 6.4.9 Sabinsa Corp.
- 6.4.10 Indena SpA
- 6.4.11 International Flavors and Fragrances Inc.
- 6.4.12 Ingredion Inc.
- 6.4.13 Tate and Lyle PLC
- 6.4.14 Arla Foods amba
- 6.4.15 Roquette Freres
- 6.4.16 Kalsec Inc.
- 6.4.17 Prinova Group
- 6.4.18 Foodchem International
- 6.4.19 Zhejiang Medicine Co.
- 6.4.20 Guangzhou Leader Bio-Tech
