
|
시장보고서
상품코드
1844624
나노 금속 산화물 : 시장 점유율 분석, 산업 동향, 통계, 성장 예측(2025-2030년)Nano-Metal Oxides - Market Share Analysis, Industry Trends & Statistics, Growth Forecasts (2025 - 2030) |
||||||
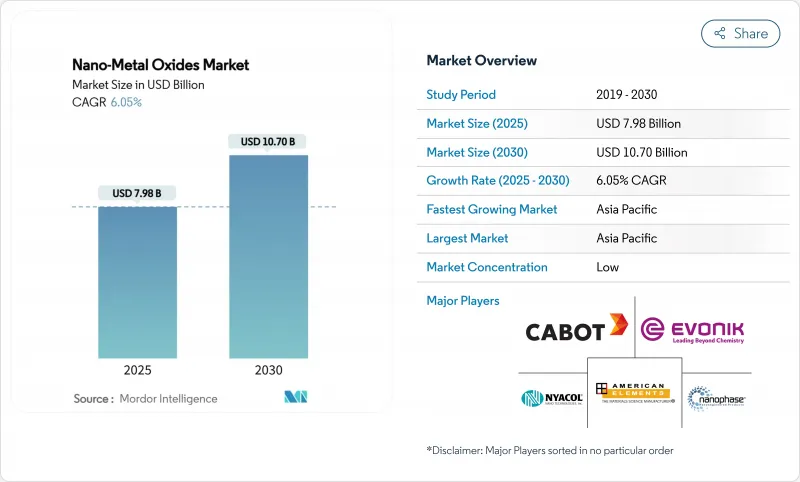
나노 금속 산화물 시장 규모는 2025년에 79억 8,000만 달러로 평가되었고, 예측 기간 중(2025-2030년) CAGR은 6.05%를 나타낼 것으로 예측되며, 2030년에는 107억 달러에 달할 전망입니다.

산업계는 에너지 저장 전극 성능 향상, 자가 세정 표면 개발, 항공우주용 초합금 성능 한계 돌파를 위해 이 소재들의 활용을 확대하고 있습니다. 또한 제형 개발자들이 유기계 살생제를 나노 산화물 항균제로 대체하면서 수요가 가속화되고 있으며, 친환경 생합성 공정은 기존 공정 대비 에너지 사용량을 30% 절감하고 생산 비용을 40% 절감합니다. 글로벌 화학 대기업들이 전구체 공급으로 역통합하고 소규모 전문업체들이 응용 분야별 입자 설계로 틈새 시장을 개척하면서 경쟁 구도가 분화되고 있습니다. 아시아태평양 지역의 제조 규모와 지속적인 공공 연구 투자가 결합되어 파일럿 도입 및 대량 생산에서 해당 지역의 선도적 위치를 공고히 하고 있습니다.
세계의 나노 금속 산화물 시장 동향 및 인사이트
항공우주 초합금에 적용되는 나노 소재
항공우주 프로그램은 기존 알루미늄 시스템 대비 40% 향상된 500°C까지 안정적인 기계적 특성을 제공하는 산화물 분산 강화 합금을 적용 중입니다. 나노 규모 L12 석출물로 강화된 고엔트로피 니켈 합금은 -196°C에서 600°C까지 인장 강도를 일정하게 유지하여 초음속 차량의 온도 민감성 장애물을 제거합니다. 보잉 787 및 에어버스 A350 플랫폼의 복합재 동체 섹션은 나노 산화물 충전재를 통해 구조적 무결성을 유지하면서 이미 20%의 중량 절감을 입증하고 있습니다. 하중 지지력 향상 외에도 내장된 나노입자는 외부 간섭으로부터 항공 전자 장비를 보호하는 전자기 차폐 기능을 제공합니다. 이러한 복합적 이점은 인증 주기를 가속화하고 1차 공급업체 전반에 걸쳐 조달 계약을 촉진합니다.
개인 위생 제품의 항균 수요
방부제 무첨가 화장품에 대한 소비자 선호로 인해 세포 독성 없이 박테리아 증식을 90% 감소시키는 산화아연 나노입자에 대한 관심이 높아지고 있습니다. 다기능 이산화티타늄 입자는 자외선 차단과 광활성 병원체 살균을 동시에 제공하여 제형당 첨가제 부하를 줄입니다. 산화구리는 우수한 항진균 활성을 제공하며 내성 피부사상균을 표적으로 한 고급 스킨케어 제품 출시를 지원합니다. 금속 기반 활성 성분으로의 신속한 전환은 성분 목록을 단축하고 클린 라벨 주장을 뒷받침하며, 특히 규제 승인이 빠른 아시아태평양 지역에서 두드러집니다. 화장품 등급 분산액 생산을 확대하는 공급업체들은 브랜드 소유자들이 글로벌 SKU 포트폴리오를 재구성함에 따라 선점 효과를 얻습니다.
금속 분말을 사용하여 환경에 미치는 영향
생애주기 평가에 따르면 화학 및 생합성 나노 산화물 모두 수생 생물에서 산화 스트레스와 DNA 손상을 유발할 수 있어 규제 당국의 심사를 촉발하고 있습니다. 유럽 식품안전청(EFSA)과 FDA는 현재 소비자 제품에 대해 더 엄격한 노출 기준을 시행하여 중소 생산자의 준수 비용을 증가시키고 있습니다. 재활용 프로토콜과 폐쇄형 폐수 시스템은 허가 취득의 필수 요건이 되어 신규 프로젝트에 자본 지출을 추가하고 있습니다. 따라서 시장 진입 기업들은 시장 접근을 위해 혁신과 엄격한 환경 관리 사이의 균형을 유지해야 합니다.
부문 분석
2024년 티타늄 산화물은 광촉매 강도와 유전 안정성으로 인해 자가 세정 외벽부터 고-k 트랜지스터까지 폭넓게 사용되며 나노 금속 산화물 시장 점유율의 33.28%를 차지했습니다. 식물 추출물을 활용해 유사한 밴드갭을 가지면서도 탄소 발자국이 낮은 생체 적합성 입자를 생산하는 친환경 공정으로 세그먼트 확장이 지속되고 있습니다. 세륨 산화물은 Ce3+/Ce4+ 이중 상태가 반도체 평탄화에 필수적인 CMP 슬러리를 주도하며 7.96%의 연평균 복합 성장률(CAGR)로 동종 제품군을 앞지를 것으로 전망됩니다. 실리카와 산화 아연은 차단막 및 피부과용 크림에 여전히 신뢰할 수 있는 소재로 자리매김하는 한편, 산화철 나노구조체는 89%의 염료 분해 효율을 통해 정화 시스템에 진출하고 있습니다.
입자 공학과 최종 사용 인증을 연계한 공급업체들이 시장 모멘텀의 수혜를 입는다. 이산화 티타늄 제조사는 식품 접촉 및 화장품 분야의 광범위한 규제 승인을 활용하는 반면, 세리아 공급사는 웨이퍼 규모 순도에 집중합니다. 통합 기업들은 공유된 전구체 네트워크를 활용해 물류 비용을 절감함으로써 나노 금속 산화물 시장의 이 부문에서 경쟁 우위를 공고히 합니다.
20-80nm 크기의 입자는 2024년 시장 점유율 46.25%를 기록했으며, 연평균 7.85% 성장률로 주도할 전망입니다. 이 크기는 양자 표면 반응성과 공정 안정성을 균형 있게 제공하여 잉크 및 폴리머 내 용이한 분산성을 보장하는 동시에 20nm 미만에서 흔히 발생하는 응집 현상을 방지합니다. 20nm 미만 입자는 우수한 촉매 속도를 제공하지만 여과 및 분진 안전성 문제를 야기하여 취급 비용을 증가시킵니다. 80nm 초과 입자는 특수 광학 또는 내마모성 용도로 활용되나, 대량 시장 점유율은 중간 크기 입자에 양보합니다. 졸-젤 및 수열 반응기 기술 발전으로 ±5nm 공차 확보가 가능해져 배합사들은 배치 간 일관성에 대한 신뢰도를 확보했습니다.
이 최적 영역은 광촉매의 조절 가능한 밴드갭과 도료의 예측 가능한 유변학적 특성을 제공하여 채택 기업들에게 가치를 부여합니다. 지속적인 반응기 최적화와 인라인 분광 분석 기술의 결합은 생산성 향상을 약속하며, 20-80nm 범위를 나노 금속 산화물 시장의 주력 세그먼트로 공고히 할 것입니다.
지역 분석
아시아태평양 지역은 2024년 46.05%의 점유율을 기록했으며, 중국의 글로벌 실리콘 음극재 시장 점유율 67.8%와 일본의 첨단 소재 특허 점유율 21.5%를 기반으로 연평균 8.01%의 성장률을 보일 것으로 전망됩니다. 수직적 통합은 비용을 절감하고 파일럿 단계에서 양산 단계로의 전환을 가속화합니다. 2001년 이후 300억 달러를 초과하는 정부 자금이 대학-산업 컨소시엄을 지원하여 기술 성숙도와 인력 역량을 향상시키고 있습니다.
북미는 산화물 강화 합금 및 첨단 반도체가 필요한 항공우주 공급망의 지원으로 2위를 차지했습니다. American Elements 및 Evonik과 같은 생산자들은 칩 제조 공장을 지원하기 위해 초고순도 콜로이드 실리카 공장에 투자했습니다.
유럽은 친환경 설계를 중시합니다. 엄격한 REACH 규정은 친환경 생합성 기술의 조기 도입을 촉진하며, 에너지 효율 기준 충족을 위해 건축물 개조 시 근적외선 반사 코팅이 적용됩니다. 남미 및 중동 같은 신흥 지역은 기후 변화 대응 인프라 구축을 위해 나노 산화물 외장재를 활용하며, 현지 규제가 성숙함에 따라 점차 소비량이 증가하고 있습니다.
기타 혜택 :
- 엑셀 형식 시장 예측(ME) 시트
- 3개월의 애널리스트 지원
목차
제1장 서론
- 조사의 전제조건과 시장 정의
- 조사 범위
제2장 조사 방법
제3장 주요 요약
제4장 시장 상황
- 시장 개요
- 시장 성장 촉진요인
- 항공우주 초합금 분야에서의 나노 소재 채택
- 퍼스널케어 처방에 있어서의 항균 수요
- 에너지 저장 전극 성능 향상
- 도료 및 코팅 산업의 나노 금속 산화물 수요 증가
- 3D 프린팅 공정 기술 증가
- 시장 성장 억제요인
- 금속 분말 사용에 의한 환경에 대한 영향
- 전구체 금속의 가격 변동
- 높은 제조 비용
- 밸류체인 분석
- Five Forces 분석
- 공급기업의 협상력
- 구매자의 협상력
- 신규 참가업체의 위협
- 대체품의 위협
- 경쟁도
제5장 시장 규모와 성장 예측
- 제품 유형별
- 알루미나
- 실리카
- 산화티탄
- 산화아연
- 산화철
- 기타 제품 유형(산화동 등)
- 입자 사이즈별
- 20nm 미만
- 20-80nm
- 80nm 이상
- 합성 방법별
- 졸-겔
- 화염 분무 열분해
- 수열/솔보 서멀
- 화학기상증착법
- 친환경/생물학적 합성
- 최종 사용자 산업별
- 운송
- 전자
- 에너지
- 건설
- 퍼스널케어
- 헬스케어
- 기타 최종 사용자 산업(화학, 촉매 등)
- 지역별
- 아시아태평양
- 중국
- 일본
- 인도
- 한국
- ASEAN 국가
- 기타 아시아태평양
- 북미
- 미국
- 캐나다
- 멕시코
- 유럽
- 독일
- 영국
- 프랑스
- 이탈리아
- 스페인
- 러시아
- 북유럽 국가
- 기타 유럽
- 남미
- 브라질
- 아르헨티나
- 기타 남미
- 중동 및 아프리카
- 사우디아라비아
- 남아프리카
- 기타 중동 및 아프리카
- 아시아태평양
제6장 경쟁 구도
- 시장의 집중도
- 전략적인 동향
- 시장 점유율(%)/랭킹 분석
- 기업 프로파일
- Advanced Nano Products Co., Ltd.
- American Elements
- Baikowski SA
- Cabot Corporation
- Cerion Nanomaterials
- Chengyin Technology
- Diamon-Fusion International Inc.
- Evonik Industries AG
- MATEXCEL
- Meliorum Technologies, Inc.
- Merck KGaA
- NaBond Technologies Co., Ltd.
- NanoComposix(Fortis Life Sciences)
- Nano-Oxides Inc.
- Nanophase Technologies Corporation
- Nanoshel LLC
- Nissan Chemical Corporation
- NYACOL Nano Technologies, Inc.
- Reinste Nano Ventures
- SkySpring Nanomaterials Inc.
- US Research Nanomaterials, Inc.
제7장 시장 기회와 전망
HBR 25.11.07The Nano-Metal Oxides Market size is estimated at USD 7.98 billion in 2025, and is expected to reach USD 10.70 billion by 2030, at a CAGR of 6.05% during the forecast period (2025-2030), underpinned by the distinct surface area, reactivity and functional tunability that nanostructuring unlocks.
Industries are intensifying the use of these materials to enhance energy storage electrodes, develop self-cleaning surfaces and raise the performance ceiling of aerospace super-alloys. Demand also accelerates as formulators replace organic biocides with nano-oxide antimicrobial agents, while green bio-synthesis trims energy use by 30% and slashes production costs 40% relative to conventional routes. Competition is fragmenting as global chemical majors integrate backward into precursor supply and smaller specialists carve niches through application-specific particle design. Asia-Pacific's manufacturing scale, combined with sustained public research spending, secures the region's lead in pilot adoption and high-volume output.
Global Nano-Metal Oxides Market Trends and Insights
Nanomaterials Adoption in Aerospace Super-Alloys
Aerospace programmes are embedding oxide-dispersion-strengthened alloys that deliver stable mechanical properties up to 500 °C, a 40% improvement on legacy aluminum systems. High-entropy nickel alloys fortified with nanoscale L12 precipitates keep tensile strength constant from -196 °C to 600 °C, removing temperature-sensitivity roadblocks for hypersonic vehicles. Composite fuselage sections on Boeing 787 and Airbus A350 platforms already demonstrate 20% weight savings while preserving structural integrity through nano-oxide fillers. Beyond load-bearing gains, embedded nanoparticles offer electromagnetic shielding that safeguards avionics from external interference. These combined benefits accelerate qualification cycles and ignite procurement contracts across Tier-1 suppliers.
Anti-Microbial Demand in Personal Care Formulations
Consumer preference for preservative-free cosmetics is raising interest in zinc oxide nanoparticles that achieve 90% bacterial growth reduction without cytotoxicity. Multifunctional titanium dioxide particles deliver simultaneous UV protection and photo-activated pathogen kill, reducing additive loading per formulation. Copper oxide offers premium antifungal activity and supports luxury skin-care launches targeting resistant dermatophytes. The swift pivot toward metal-based actives shortens ingredient lists and supports clean-label claims, particularly in Asia-Pacific where regulatory clearance is rapid. Suppliers scaling cosmetic-grade dispersions gain first-mover advantage as brand owners re-formulate global SKU portfolios.
Environmental Implications of Using Metal Powder
Lifecycle assessments reveal that both chemically and bio-synthesised nano-oxides can induce oxidative stress and DNA damage in aquatic species, prompting regulatory scrutiny. The European Food Safety Authority and the FDA now enforce tighter exposure thresholds for consumer products, lifting compliance costs for smaller producers. Recycling protocols and closed-loop wastewater systems are becoming prerequisites for permits, adding capital expenditure to greenfield projects. Market entrants must therefore balance innovation with stringent environmental stewardship to gain market access.
Other drivers and restraints analyzed in the detailed report include:
- Energy Storage Electrode Enhancements
- Growing Demand from Paints and Coatings Industry
- Price Volatility of Precursor Metals
For complete list of drivers and restraints, kindly check the Table Of Contents.
Segment Analysis
Titanium oxide commanded 33.28% of the nano-metal oxides market share in 2024 as its photocatalytic strength and dielectric stability secured usage from self-cleaning facades to high-k transistors. Segment expansion continues as green routes employ plant extracts to yield biocompatible particles with similar band gaps yet lower carbon footprints. Cerium oxide is projected to outpace peers with a 7.96% CAGR as dual Ce3+/Ce4+ states drive CMP slurries vital for semiconductor planarisation. Silica and zinc oxide remain dependable for barrier films and dermatological creams, while iron oxide nanostructures penetrate remediation systems via 89% dye degradation efficiency.
Market momentum benefits suppliers that align particle engineering with end-use certification. Titanium dioxide makers capitalise on broad regulatory acceptance in food contact and cosmetics, whereas ceria suppliers focus on wafer-scale purity. Integrated firms leverage shared precursor networks to cut logistic costs, reinforcing competitive moats in this slice of the nano-metal oxides market.
The 20-80 nm band represented 46.25% in 2024 and is forecast to lead with a 7.85% CAGR. The interval balances quantum surface reactivity and process stability, offering easy dispersion in inks and polymers while avoiding the agglomeration typical below 20 nm. Sub-20 nm particles deliver superior catalytic rates but raise filtration and dust-safety issues that lift handling costs. Sizes above 80 nm serve niche optical or abrasion-resistant roles yet cede mass-market volumes to the mid-range. Advances in sol-gel and hydrothermal reactors now hold +-5 nm tolerances, giving formulators confidence in batch-to-batch consistency.
Adopters value this sweet spot for tunable band gaps in photocatalysts and predictable rheology in paints. Continued reactor optimisation coupled with inline spectroscopy promises to lift throughput, cementing the 20-80 nm window as the workhorse segment of the nano-metal oxides market.
The Nano-Metal Oxides Market Report is Segmented by Product Type (Alumina, Silica, and More), Particle Size (Less Than 20 Nm, 20-80 Nm, and More), Synthesis Method (Sol-Gel, Flame Spray Pyrolysis, and More), End-User Industry (Transportation, Electronics, and More), and Geography (Asia-Pacific, North America, Europe, South America, Middle East and Africa). The Market Forecasts are Provided in Terms of Value (USD).
Geography Analysis
Asia-Pacific captured 46.05% share in 2024 and is projected to record an 8.01% CAGR, anchored by China's 67.8% share of global silicon-anode materials and Japan's 21.5% cut of advanced material patents. Vertical integration compresses costs and quickens pilot-to-mass-production transitions. Government funding exceeding USD 30 billion since 2001 finances university-industry consortia that raise technology readiness and workforce skills.
North America ranks second, supported by aerospace supply chains that require oxide-strengthened alloys and advanced semiconductors. Producers such as American Elements and Evonik invested in ultra-high-purity colloidal silica plants to serve chip fabs.
Europe emphasises eco-design. Strict REACH directives motivate early adoption of green bio-synthesis, and construction retrofits absorb NIR-reflective coatings to meet energy-efficiency mandates. Emerging regions like South America and the Middle East tap nano-oxide facades for climate-resilient infrastructure, gradually lifting their consumption as local regulations mature.
- Advanced Nano Products Co., Ltd.
- American Elements
- Baikowski SA
- Cabot Corporation
- Cerion Nanomaterials
- Chengyin Technology
- Diamon-Fusion International Inc.
- Evonik Industries AG
- MATEXCEL
- Meliorum Technologies, Inc.
- Merck KGaA
- NaBond Technologies Co., Ltd.
- NanoComposix (Fortis Life Sciences)
- Nano-Oxides Inc.
- Nanophase Technologies Corporation
- Nanoshel LLC
- Nissan Chemical Corporation
- NYACOL Nano Technologies, Inc.
- Reinste Nano Ventures
- SkySpring Nanomaterials Inc.
- US Research Nanomaterials, Inc.
Additional Benefits:
- The market estimate (ME) sheet in Excel format
- 3 months of analyst support
TABLE OF CONTENTS
1 Introduction
- 1.1 Study Assumptions and Market Definition
- 1.2 Scope of the Study
2 Research Methodology
3 Executive Summary
4 Market Landscape
- 4.1 Market Overview
- 4.2 Market Drivers
- 4.2.1 Nanomaterials adoption in aerospace super-alloys
- 4.2.2 Anti-microbial demand in personal care formulations
- 4.2.3 Energy storage electrode enhancements
- 4.2.4 Growing demand for nano metal oxides from paints and coatings industry
- 4.2.5 Increasing technology of 3D-printing Process
- 4.3 Market Restraints
- 4.3.1 Environmental Implications of Using Metal Powder
- 4.3.2 Price volatility of precursor metals
- 4.3.3 High Production Costs
- 4.4 Value Chain Analysis
- 4.5 Porter's Five Forces
- 4.5.1 Bargaining Power of Suppliers
- 4.5.2 Bargaining Power of Buyers
- 4.5.3 Threat of New Entrants
- 4.5.4 Threat of Substitutes
- 4.5.5 Degree of Competition
5 Market Size and Growth Forecasts (Value)
- 5.1 By Product Type
- 5.1.1 Alumina
- 5.1.2 Silica
- 5.1.3 Titanium Oxide
- 5.1.4 Zinc Oxide
- 5.1.5 Iron Oxide
- 5.1.6 Other Product Types (Copper Oxide, etc.)
- 5.2 By Particle Size
- 5.2.1 Less than 20 nm
- 5.2.2 20 - 80 nm
- 5.2.3 Greater than 80 nm
- 5.3 By Synthesis Method
- 5.3.1 Sol-gel
- 5.3.2 Flame Spray Pyrolysis
- 5.3.3 Hydrothermal/ Solvothermal
- 5.3.4 Chemical Vapor Deposition
- 5.3.5 Green/ Bio-synthesis
- 5.4 By End-user Industry
- 5.4.1 Transportation
- 5.4.2 Electronics
- 5.4.3 Energy
- 5.4.4 Construction
- 5.4.5 Personal Care
- 5.4.6 Healthcare
- 5.4.7 Other End-user Industries (Chemicals and Catalysts, etc.)
- 5.5 By Geography
- 5.5.1 Asia-Pacific
- 5.5.1.1 China
- 5.5.1.2 Japan
- 5.5.1.3 India
- 5.5.1.4 South Korea
- 5.5.1.5 ASEAN Countries
- 5.5.1.6 Rest of Asia-Pacific
- 5.5.2 North America
- 5.5.2.1 United States
- 5.5.2.2 Canada
- 5.5.2.3 Mexico
- 5.5.3 Europe
- 5.5.3.1 Germany
- 5.5.3.2 United Kingdom
- 5.5.3.3 France
- 5.5.3.4 Italy
- 5.5.3.5 Spain
- 5.5.3.6 Russia
- 5.5.3.7 NORDIC Countries
- 5.5.3.8 Rest of Europe
- 5.5.4 South America
- 5.5.4.1 Brazil
- 5.5.4.2 Argentina
- 5.5.4.3 Rest of South America
- 5.5.5 Middle East and Africa
- 5.5.5.1 Saudi Arabia
- 5.5.5.2 South Africa
- 5.5.5.3 Rest of Middle East and Africa
- 5.5.1 Asia-Pacific
6 Competitive Landscape
- 6.1 Market Concentration
- 6.2 Strategic Moves
- 6.3 Market Share(%)/Ranking Analysis
- 6.4 Company Profiles {(includes Global level Overview, Market level overview, Core Segments, Financials as available, Strategic Information, Market Rank/Share for key companies, Products and Services, and Recent Developments)}
- 6.4.1 Advanced Nano Products Co., Ltd.
- 6.4.2 American Elements
- 6.4.3 Baikowski SA
- 6.4.4 Cabot Corporation
- 6.4.5 Cerion Nanomaterials
- 6.4.6 Chengyin Technology
- 6.4.7 Diamon-Fusion International Inc.
- 6.4.8 Evonik Industries AG
- 6.4.9 MATEXCEL
- 6.4.10 Meliorum Technologies, Inc.
- 6.4.11 Merck KGaA
- 6.4.12 NaBond Technologies Co., Ltd.
- 6.4.13 NanoComposix (Fortis Life Sciences)
- 6.4.14 Nano-Oxides Inc.
- 6.4.15 Nanophase Technologies Corporation
- 6.4.16 Nanoshel LLC
- 6.4.17 Nissan Chemical Corporation
- 6.4.18 NYACOL Nano Technologies, Inc.
- 6.4.19 Reinste Nano Ventures
- 6.4.20 SkySpring Nanomaterials Inc.
- 6.4.21 US Research Nanomaterials, Inc.
7 Market Opportunities and Future Outlook
- 7.1 White-space and Unmet-Need Assessment
