


|
시장보고서
상품코드
1846195
유량 센서 : 시장 점유율 분석, 산업 동향, 통계, 성장 예측(2025-2030년)Flow Sensors - Market Share Analysis, Industry Trends & Statistics, Growth Forecasts (2025 - 2030) |
||||||
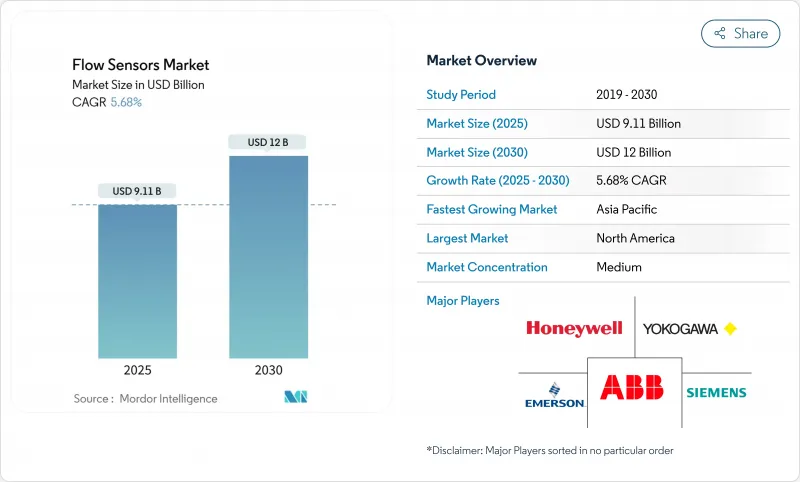
유량 센서 시장은 현재 91억 1,000만 달러로, 2030년에는 120억 달러에 이르고, CAGR 5.68%를 나타낼 것으로 예측됩니다.

성장의 배경은 공정 산업 전체의 디지털화의 진전, 국경을 넘는 파이프라인에서의 누설 감지 규칙의 의무화, 정확한 실시간 계측을 필요로 하는 대규모 해수 담수화 투자가 있습니다. 초음파 기술 혁신, 클램프식 복고풍, IIoT 커넥티비티는 설치 시간을 단축하고, 가동 시간을 개선하며, 운영자가 진화하는 캐스트 디트랜스퍼와 환경 기준을 준수할 수 있도록 도와줍니다. 동시에, 반도체 부족과 대구경 코리오 리미터의 높은 자본 요건이 채택 페이스를 제약하고 있으며, 공급업체는 보다 입수하기 쉬운 칩셋을 중심으로 제품을 재설계하도록 촉구되고 있습니다.
북미는 엄격한 파이프라인 안전 의무화와 적극적인 스마트 워터 배포로 최대 판매 점유율을 차지하고 있는 반면, 아시아태평양은 중국과 인도에서 수십억 달러 규모의 제조 업그레이드를 배경으로 가장 빠른 성장을 기록하고 있습니다. 상하수도 사업자는 무수수량 감소와 자산의 신뢰성을 우선시하기 때문에 최종 사용자로서 가장 급성장하고 있는 그룹입니다. 경쟁은 치열해지고 있으며 기존 기업은 틈새 초음파 전문 기업을 인수하고 IIoT 서비스 레이어를 시작하고 데이터 아즈아 서비스와 소형화 MEMS 설계가 가치 제공을 재정의하는 시장에서 점유율을 확보하기 위해 제휴를 맺고 있습니다.
세계의 유량 센서 시장 동향과 인사이트
스마트 및 IIoT 대응 유량 측정 솔루션 채택 증가
KROHNE과 같은 공급업체가 제공하는 에지 대응 센서는 밸브 작동과 내장 유량, 압력, 온도 측정을 통합하여 운영자가 사후 검사에서 예측 유지보수로 전환할 수 있도록 합니다. IIoT 대응 센서를 도입한 시설에서는 이상이 조기에 발견되었기 때문에 계획외의 다운타임이 최대 30% 삭감되었습니다. 로컬 데이터 처리는 네트워크 부하를 줄여 실시간 안전 대책을 가능하게 합니다. 그러나 최근에 발견된 ABB TotalFlow 컴퓨터의 원격 실행 결함은 사이버 리스크를 부각시키고 강화된 보안 프레임워크의 필요성을 강조합니다.
리노베이션 프로젝트에서 비 침습 클램프 온 초음파 미터 수요 급증
클램프 온 유닛은 배관 절단을 피하고 약 30분 만에 설치가 완료되기 때문에 며칠이 걸리는 인라인 리노베이션과는 대조적입니다. 발전소와 화학 공장에서는 레거시 라인을 멈추지 않고 새로 고치기 위해이 기술이 채택되었습니다. 에머슨의 FLUXUS 시리즈는 -200°C-630°C까지 지원하며 극저온 및 고온에서 사용하기에 적합합니다. 자동화된 미터 검증을 통해 현장에서의 건전성 점검이 가능하며, 유지보수 시간을 줄이고 총 자산 이용률을 더욱 높일 수 있습니다.
대구경 캐스트 디 트랜스퍼 라인의 코리오 리미터의 고액 설비 투자
대구경 코리올리 설치는 1대당 USD 10만 달러를 초과할 수 있으며 프로젝트 예산을 압박합니다. 운영자는 저렴하지만 정밀도가 낮은 초음파 및 차압 대체 옵션과 비교하여 그 높이를 고려합니다. 임대 모델과 성과 기반 계약은 구제책을 제공하지만, 많은 보관 이체 규약은 코리올리 수준의 정확성을 강제하고 있으며, 비용 장애에도 불구하고 수요는 유지되고 있습니다.
부문 분석
액체 측정은 2024년 유량 센서 시장의 58.2%를 차지했으며 CAGR 6.88%를 나타낼 것으로 예측됩니다. 유틸리티 규모의 스마트워터 프로젝트가 수요를 끌어올려 Moulton Niguel Water District의 5만 5,000미터 전개가 연간 5억 갤런을 절약 mnwd.com 가스 분야에서는 파이프라인 모니터링와 산업용 연소 제어가 안정적인 수익을 유지하고 있지만, 성장률이 낮기 때문에 기여도는 액체 분야를 밑돌고 있습니다.
스마트시티의 의무화는 무수수량 삭감을 전력회사에 강하게 함으로써 액체의 채용을 가속화하고 있습니다. 노스캐롤라이나주 케리의 1,800만 달러의 AMI 플랫폼은 매년 7만 1,000마일의 트럭을 줄이고 서비스 비용을 줄이고 배출량을 줄였습니다. 화학처리업자와 양조장은 특히 위생기준이나 부식성이 강한 매체에서 완전 용접의 스테인리스제 유로가 필요한 경우에 액체의 설치를 추진하고 있습니다.
차압 장치는 수십 년에 걸친 설치 기반과 유리한 수명주기 경제성을 뒷받침하며 여전히 31.03%로 가장 큰 수익 부문을 차지하고 있습니다. 그러나 초음파 센서는 클램프 폼 팩터가 다운타임을 줄이고 고급 신호 알고리즘이 측정 오차를 1%로 억제하므로 CAGR로 가장 빠른 7.11%를 나타낼 전망입니다. 초음파 장치와 관련된 유량 센서 시장 규모는 2030년까지 중공업의 복고풍에서 2자리 성장을 이룹니다.
코리올리미터는 밀도와 질량 유량이 중요한 멀티파라미터 측정을 위한 프리미엄 상태를 유지하며, 와전식과 열식은 증기 라인과 저유량 가스 용도를 지원합니다. 마그네틱 센서는 제로 압력 강하와 내식성 라이너를 통해 수도 사업과 펄프 공장에서 인기를 유지하고 있습니다. 대부분의 기술에 자체 검증 펌웨어가 통합되어 운영자의 신뢰가 높아지고 재교정 비용이 절감됩니다.
유량 센서 시장 보고서는 업계를 유형별(액체, 가스), 기술별(코리올리, 차압, 초음파, 와류, 열, 자기), 설치 유형별(인라인, 클램프온, 삽입), 최종 사용자 업계별(석유 및 가스, 상하수도, 식품 및 음료, 발전, 펄프·제지, 제약, 기타 업계), 지역별로 분류하고 있습니다.
지역 분석
북미는 2024년 매출액의 34.3%를 차지한 PHMSA의 엄격한 누수 감지 규칙과 엄청난 스마트워터 보조금을 사용했습니다. Austin Water의 8,020만 달러의 미터 현대화는 인프라 패키지가 다년간의 센서 조달을 어떻게 해제하는지를 보여줍니다. 메탄 감축 기술에 대한 연방 정부의 우대 조치는 자동 경고 시스템에 공급하는 고정밀 센서에 대한 파이프라인 사업자의 지출을 더욱 증가시킵니다.
아시아태평양의 CAGR은 6.32%로 세계 최고를 기록하고 있습니다. 중국과 인도의 자동화 프로젝트에서의 연간 투자액은 17억 달러를 넘어 자동차 도장공장, 화학 콤비나트, 일렉트로닉스 공장에서 수요에 박차를 가하고 있습니다. 현지 벤더는 가격 경쟁력 있는 인라인 마구미터와 심플한 소용돌이 모델로 세계의 기존 기업에 도전하고 있으며, 다국적 기업은 현지에서의 지원이나 부가가치 분석에 연마를 필요로 하고 있습니다. 동남아시아는 초순수나 화학 라인에서의 엄격한 유량 제어를 필요로 하는 전자기기나 배터리의 기가팩토리로부터의 유입으로 혜택을 받습니다.
유럽에서는 폐수지령의 개정에 의해 배출기준이 강화되고, 지자체가 지속적인 감시를 실시할 필요가 있어 규제 주도의 안정된 수요가 예상됩니다. 중동 및 아프리카에서는 오만의 바르카 5와 같은 해수 담수화 메가 프로젝트에 2자리 지출이 있으며 내식성 흐름 솔루션에 의존합니다. 남미에서는 브라질의 위생 컨세션과 아르헨티나의 LNG 터미널 확장에 센서 도입이 연결되어 있으며, 모두 가혹한 공정 조건 하에서 신뢰성 높은 측정이 요구되고 있습니다.
기타 혜택 :
- 엑셀 형식 시장 예측(ME) 시트
- 3개월의 애널리스트 서포트
목차
제1장 서론
- 조사 전제조건과 시장 정의
- 조사 범위
제2장 조사 방법
제3장 주요 요약
제4장 시장 상황
- 시장 개요
- 시장 성장 촉진요인
- 스마트 및 IIoT 대응 유량계 솔루션의 채용 증가
- 리노베이션 프로젝트에서 비침습성 클램프식 초음파 미터에 대한 수요 급증
- 국경을 넘은 석유 및 가스 파이프라인에 있어서 누설 검출 규제의 의무화
- 물 부족의 경제에 있어서 해수 담수화와 재이용 플랜트의 급속한 확대
- 일회용 바이오프로세싱 기기에 전력을 공급하는 소형화 MEMS 유량 센서
- Data-as-a-service(DaaS) 비즈니스 모델에 의한 지속적인 수익원의 창출
- 시장 성장 억제요인
- 대형 직경 소유권 이전 라인에 있어서 코리올리스 유량계의 고액 설비 투자
- 신흥국에서의 숙련된 교정실의 부족
- 무선 유량계 네트워크에서의 사이버 보안 취약성
- 중요한 반도체 칩공급망 불안정성
- 중요한 규제 틀의 평가
- 밸류체인 분석
- 기술적 전망
- Porter's Five Forces
- 공급기업의 협상력
- 구매자의 협상력
- 신규 참가업체의 위협
- 대체품의 위협
- 경쟁 기업 간 경쟁 관계
- 주요 이해관계자의 영향 평가
- 주요 이용 사례와 사례 연구
- 시장의 거시경제 요인에 미치는 영향
- 투자분석
제5장 시장 세분화
- 유형별
- 액체
- 가스
- 기술별
- 코리올리스
- 차압
- 초음파
- 와류
- 열
- 자기
- 설치 유형별
- 인라인
- 클램프 온
- 삽입
- 최종 사용자 산업별
- 석유 및 가스
- 상하수도
- 화학 및 석유화학
- 식음료
- 발전
- 펄프 및 제지
- 제약
- 기타 산업
- 지역별
- 북미
- 미국
- 캐나다
- 멕시코
- 남미
- 브라질
- 아르헨티나
- 기타 남미
- 유럽
- 영국
- 독일
- 프랑스
- 이탈리아
- 스페인
- 북유럽
- 기타 유럽
- 중동 및 아프리카
- 중동
- 사우디아라비아
- 아랍에미리트(UAE)
- 튀르키예
- 기타 중동
- 아프리카
- 남아프리카
- 이집트
- 나이지리아
- 기타 아프리카
- 아시아태평양
- 중국
- 인도
- 일본
- 한국
- ASEAN
- 호주
- 뉴질랜드
- 기타 아시아태평양
- 북미
제6장 경쟁 구도
- 시장의 집중
- 전략적인 동향
- 시장 점유율 분석
- 기업 프로파일
- ABB Ltd.
- Endress Hauser Group Services AG
- Siemens AG
- Emerson Electric Co.
- Honeywell International Inc.
- Yokogawa Electric Corporation
- Krohne Messtechnik GmbH
- Badger Meter, Inc.
- Christian Burkert GmbH and Co. KG
- Sensirion AG
- TSI Incorporated
- Keyence Corporation
- Brooks Instrument LLC
- TE Connectivity Ltd.
- Texas Instruments Incorporated
- Schneider Electric SE
- OMEGA Engineering Inc.
- SICK AG
- Proxitron GmbH
- Rechner Sensors
- Bronkhorst High-Tech BV
- Katronic Technologies Ltd.
- Alicat Scientific, Inc.
- Tokyo Keiki Inc.
- Fuji Electric Co., Ltd.
제7장 시장 기회와 전망
KTH 25.11.07The flow sensors market is currently valued at USD 9.11 billion and is projected to reach USD 12 billion by 2030, advancing at a 5.68% CAGR.
Growth rests on rising digitalization across process industries, mandatory leak-detection rules in cross-border pipelines, and large-scale desalination investments that demand accurate, real-time measurement. Ultrasonic innovation, clamp-on retrofits, and IIoT connectivity shorten installation times, improve uptime, and help operators comply with evolving custody-transfer and environmental standards. At the same time, semiconductor shortages and high capital requirements for large-diameter Coriolis meters constrain the pace of adoption, nudging suppliers to redesign products around more readily available chipsets.
North America commands the largest revenue share because of strict pipeline safety mandates and aggressive smart-water rollouts, while Asia-Pacific records the fastest growth on the back of multi-billion-dollar manufacturing upgrades in China and India. Water and wastewater utilities represent the fastest-expanding end-user group as utilities prioritize non-revenue water reduction and asset reliability. Competition is intensifying: incumbents acquire niche ultrasonic specialists, launch IIoT service layers, and forge alliances to secure share in a market where data-as-a-service and miniaturized MEMS designs redefine value delivery.
Global Flow Sensors Market Trends and Insights
Increasing adoption of smart and IIoT-enabled flow metering solutions
Edge-ready sensors from suppliers such as KROHNE merge valve actuation with embedded flow, pressure, and temperature measurement, letting operators shift from reactive checks to predictive upkeep. Facilities that fitted IIoT-enabled sensors cut unplanned downtime by up to 30% because anomalies surfaced early. Local data processing lowers network load and empowers real-time safety actions. However, recent discoveries of remote-execution flaws in ABB TotalFlow computers spotlight cyber risks and underscore the need for hardened security frameworks.
Surging demand for non-invasive clamp-on ultrasonic meters in retrofit projects
Clamp-on units avoid pipe cutting and finish installation in roughly 30 minutes, a sharp contrast to multi-day inline retrofits. Power plants and chemical sites now favor the technology to refresh legacy lines without halts. Emerson's FLUXUS series handles -200 °C to +630 °C, proving suitability in cryogenic and high-temperature duties. Automated meter verification permits on-site health checks, trimming maintenance hours and further boosting total asset utilization.
High CapEx for Coriolis meters in large-diameter custody-transfer lines
Each large-bore Coriolis installation can exceed USD 100,000, straining project budgets. Operators weigh the premium against alternative ultrasonic or differential-pressure options that cost less but deliver lower accuracy. Leasing models and outcome-based contracts offer relief, yet many custody-transfer codes enforce Coriolis-level precision, sustaining demand despite cost hurdles.
Other drivers and restraints analyzed in the detailed report include:
- Mandatory leak-detection regulations in cross-border oil and gas pipelines
- Rapid expansion of desalination and reuse plants in water-stressed economies
- Supply-chain volatility for critical semiconductor chips
For complete list of drivers and restraints, kindly check the Table Of Contents.
Segment Analysis
Liquid measurement held 58.2% of the flow sensors market in 2024 and is projected to grow at a 6.88% CAGR. Utility-scale smart-water projects boost demand, with Moulton Niguel Water District's 55,000-meter rollout saving 500 million gallons annually mnwd.com. Electromagnetic variants remain dominant for conductive fluids, while ultrasonic sensors gain share in low-conductivity or slurry settings. On the gas side, pipeline monitoring and industrial combustion control sustain steady revenue, but lower growth keeps its contribution below the liquid segment.
Smart city mandates accelerate liquid adoption by compelling utilities to lower non-revenue water. Cary, North Carolina's USD 18 million AMI platform eliminated 71,000 truck miles each year, demonstrating service cost reductions and emissions cuts. Chemical processors and breweries also propel liquid installations, particularly where sanitary standards or aggressive media require fully welded stainless-steel flow paths.
Differential-pressure devices still represent the largest revenue block at 31.03%, anchored by decades of installed base and favorable life-cycle economics. Yet ultrasonic sensors deliver the fastest 7.11% CAGR because clamp-on form factors reduce downtime, and advanced signal algorithms trim measurement error to 1%. The flow sensors market size tied to ultrasonic devices is positioned for double-digit gains in retrofit heavy industries through 2030.
Coriolis meters maintain premium status for multi-parameter measurement where density and mass flow are critical, while vortex and thermal variants address steam lines and low-flow gas applications. Magnetic sensors stay popular in water utilities and pulp plants due to zero pressure drop and corrosion-resistant liners. Integration of self-verification firmware across most technologies boosts operator confidence and lowers recalibration spend.
The Flow Sensor Market Report Segments the Industry Into by Type (Liquid, and Gas), Technology (Coriolis, Differential Pressure, Ultrasonic, Vortex, Thermal, and Magnetic), Installation Type (Inline, Clamp-On, and Insertion), End-User Industry (Oil and Gas, Water and Wastewater, Chemical and Petrochemical, Food and Beverage, Power Generation, Pulp and Paper, Pharmaceuticals, and Other Industries), and Geography.
Geography Analysis
North America controlled 34.3% of 2024 revenue thanks to PHMSA's stringent leak-detection rules and significant smart-water grants. Austin Water's USD 80.2 million meter modernization illustrates how infrastructure packages unlock multi-year sensor procurement. Federal incentives for methane-reduction technologies further raise spending by pipeline operators on high-precision sensors that feed automated alert systems.
Asia-Pacific records a 6.32% CAGR, the highest worldwide. Annual investments topping USD 1.7 billion in Chinese and Indian automation projects spur demand across automotive paint shops, chemical complexes, and electronics fabs. Local vendors challenge global incumbents with price-competitive inline magmeters and simple vortex models, forcing multinationals to sharpen local support and value-added analytics. Southeast Asia benefits from electronics and battery gigafactory inflows that require tight flow control in ultrapure water and chemical lines.
Europe posts stable, regulation-led demand as the revised wastewater directive tightens discharge norms, compelling municipalities to fit continuous monitoring. Middle East and Africa see double-digit spending on desalination megaprojects such as Oman's Barka 5 that depend on corrosion-resistant flow solutions. In South America, sensor uptake is tied to Brazil's sanitation concessions and Argentina's LNG terminal expansions, both of which demand reliable measurement under harsh process conditions.
- ABB Ltd.
- Endress+Hauser Group Services AG
- Siemens AG
- Emerson Electric Co.
- Honeywell International Inc.
- Yokogawa Electric Corporation
- Krohne Messtechnik GmbH
- Badger Meter, Inc.
- Christian Burkert GmbH and Co. KG
- Sensirion AG
- TSI Incorporated
- Keyence Corporation
- Brooks Instrument LLC
- TE Connectivity Ltd.
- Texas Instruments Incorporated
- Schneider Electric SE
- OMEGA Engineering Inc.
- SICK AG
- Proxitron GmbH
- Rechner Sensors
- Bronkhorst High-Tech B.V.
- Katronic Technologies Ltd.
- Alicat Scientific, Inc.
- Tokyo Keiki Inc.
- Fuji Electric Co., Ltd.
Additional Benefits:
- The market estimate (ME) sheet in Excel format
- 3 months of analyst support
TABLE OF CONTENTS
1 INTRODUCTION
- 1.1 Study Assumptions and Market Definition
- 1.2 Scope of the Study
2 RESEARCH METHODOLOGY
3 EXECUTIVE SUMMARY
4 MARKET LANDSCAPE
- 4.1 Market Overview
- 4.2 Market Drivers
- 4.2.1 Increasing adoption of smart and IIoT-enabled flow metering solutions
- 4.2.2 Surging demand for non-invasive, clamp-on ultrasonic meters in retrofit projects
- 4.2.3 Mandatory leak-detection regulations in cross-border oil and gas pipelines
- 4.2.4 Rapid expansion of desalination and reuse plants in water-stressed economies
- 4.2.5 Miniaturised MEMS flow sensors powering single-use bioprocessing equipment
- 4.2.6 Data-as-a-service (DaaS) business models creating recurring revenue streams
- 4.3 Market Restraints
- 4.3.1 High CapEx for Coriolis meters in large-diameter custody-transfer lines
- 4.3.2 Scarcity of skilled calibration labs in emerging countries
- 4.3.3 Cyber-security vulnerabilities in wireless flow-meter networks
- 4.3.4 Supply-chain volatility for critical semiconductor chips
- 4.4 Evaluation of Critical Regulatory Framework
- 4.5 Value Chain Analysis
- 4.6 Technological Outlook
- 4.7 Porter's Five Forces
- 4.7.1 Bargaining Power of Suppliers
- 4.7.2 Bargaining Power of Buyers
- 4.7.3 Threat of New Entrants
- 4.7.4 Threat of Substitutes
- 4.7.5 Competitive Rivalry
- 4.8 Impact Assessment of Key Stakeholders
- 4.9 Key Use Cases and Case Studies
- 4.10 Impact on Macroeconomic Factors of the Market
- 4.11 Investment Analysis
5 MARKET SEGMENTATION
- 5.1 By Type
- 5.1.1 Liquid
- 5.1.2 Gas
- 5.2 By Technology
- 5.2.1 Coriolis
- 5.2.2 Differential Pressure
- 5.2.3 Ultrasonic
- 5.2.4 Vortex
- 5.2.5 Thermal
- 5.2.6 Magnetic
- 5.3 By Installation Type
- 5.3.1 Inline
- 5.3.2 Clamp-on
- 5.3.3 Insertion
- 5.4 By End-user Industry
- 5.4.1 Oil and Gas
- 5.4.2 Water and Wastewater
- 5.4.3 Chemical and Petrochemical
- 5.4.4 Food and Beverage
- 5.4.5 Power Generation
- 5.4.6 Pulp and Paper
- 5.4.7 Pharmaceuticals
- 5.4.8 Other Industries
- 5.5 By Geography
- 5.5.1 North America
- 5.5.1.1 United States
- 5.5.1.2 Canada
- 5.5.1.3 Mexico
- 5.5.2 South America
- 5.5.2.1 Brazil
- 5.5.2.2 Argentina
- 5.5.2.3 Rest of South America
- 5.5.3 Europe
- 5.5.3.1 United Kingdom
- 5.5.3.2 Germany
- 5.5.3.3 France
- 5.5.3.4 Italy
- 5.5.3.5 Spain
- 5.5.3.6 Nordics
- 5.5.3.7 Rest of Europe
- 5.5.4 Middle East and Africa
- 5.5.4.1 Middle East
- 5.5.4.1.1 Saudi Arabia
- 5.5.4.1.2 United Arab Emirates
- 5.5.4.1.3 Turkey
- 5.5.4.1.4 Rest of Middle East
- 5.5.4.2 Africa
- 5.5.4.2.1 South Africa
- 5.5.4.2.2 Egypt
- 5.5.4.2.3 Nigeria
- 5.5.4.2.4 Rest of Africa
- 5.5.5 Asia-Pacific
- 5.5.5.1 China
- 5.5.5.2 India
- 5.5.5.3 Japan
- 5.5.5.4 South Korea
- 5.5.5.5 ASEAN
- 5.5.5.6 Australia
- 5.5.5.7 New Zealand
- 5.5.5.8 Rest of Asia-Pacific
- 5.5.1 North America
6 COMPETITIVE LANDSCAPE
- 6.1 Market Concentration
- 6.2 Strategic Moves
- 6.3 Market Share Analysis
- 6.4 Company Profiles (includes Global level Overview, Market level overview, Core Segments, Financials as available, Strategic Information, Market Rank/Share for key companies, Products and Services, and Recent Developments)
- 6.4.1 ABB Ltd.
- 6.4.2 Endress+Hauser Group Services AG
- 6.4.3 Siemens AG
- 6.4.4 Emerson Electric Co.
- 6.4.5 Honeywell International Inc.
- 6.4.6 Yokogawa Electric Corporation
- 6.4.7 Krohne Messtechnik GmbH
- 6.4.8 Badger Meter, Inc.
- 6.4.9 Christian Burkert GmbH and Co. KG
- 6.4.10 Sensirion AG
- 6.4.11 TSI Incorporated
- 6.4.12 Keyence Corporation
- 6.4.13 Brooks Instrument LLC
- 6.4.14 TE Connectivity Ltd.
- 6.4.15 Texas Instruments Incorporated
- 6.4.16 Schneider Electric SE
- 6.4.17 OMEGA Engineering Inc.
- 6.4.18 SICK AG
- 6.4.19 Proxitron GmbH
- 6.4.20 Rechner Sensors
- 6.4.21 Bronkhorst High-Tech B.V.
- 6.4.22 Katronic Technologies Ltd.
- 6.4.23 Alicat Scientific, Inc.
- 6.4.24 Tokyo Keiki Inc.
- 6.4.25 Fuji Electric Co., Ltd.
7 MARKET OPPORTUNITIES AND FUTURE OUTLOOK
- 7.1 White-space and Unmet-need Assessment


