


|
시장보고서
상품코드
1846238
스마트 스페이스 : 시장 점유율 분석, 산업 동향, 통계, 성장 예측(2025-2030년)Smart Spaces - Market Share Analysis, Industry Trends & Statistics, Growth Forecasts (2025 - 2030) |
||||||
2025년 스마트 스페이스 시장 규모는 167억 달러에 이르고, CAGR 12.22%를 나타내 2030년에는 294억 6,000만 달러에 달할 것으로 예상됩니다.

이 상승 궤도는 대규모 전개를 간소화하는 IoT 센서의 가격 하락, 디지털 리노베이션을 가속시키는 넷 제로 건축 기준법의 의무화, 실시간 공간 최적화에 보답하는 하이브리드 워크 정책에 의해 형성됩니다. 2025년 1분기까지 670개 이상의 제품으로 인증된 Thread 1.4와 같은 상호 운용 가능한 표준은 통합 위험을 없애고 투자 회수 기간을 단축했습니다. 상용 캠퍼스에 프라이빗 5G를 배치하는 것은 예측적인 작업 공간 서비스를 가능하게 하는 반면, 광열비와 유지 보수 비용을 줄이는 고급 분석을 지원합니다. 공급업체는 또한 지속적인 최적화와 성과 기반 가격 설정을 번들로 제공하는 SaaS 모델을 확대하고 있으며, 이는 임시 자본 지출을 지속적인 수익으로 바꾸는 변화입니다. 따라서 스마트 스페이스 시장은 컴플라이언스에 대한 최상위 수요와 효율성에 대한 하단 라인 수요 모두에서 이익을 얻고 있습니다.
세계의 스마트 스페이스 시장 동향과 인사이트
IoT 대응 디바이스의 보급과 센서 가격의 하락
반도체 공급 과잉으로 2023년 이후 센서 평균 판매 가격이 두 자릿수 하락하면서 건물 소유주들은 점유율, 공기질, 전력 계량 노드를 건물 전체에 설치해 클라우드 분석 시스템에 세분화된 데이터를 전송할 수 있게 되었습니다. 2025년 초까지 670대 이상의 스레드 인증 장치가 출하되었는데, 이는 벤더가 멀티 벤더의 상호 운용성을 중요시하고 있음을 명확하게 보여줍니다. Milesight 본사의 352센서 도입으로 연간 광열비가 4만 5,000달러 감소했습니다. 에지 AI 칩의 확장 메모리 대역폭은 대기 시간 패널티를 제거하고 실시간 제어 루프를 지원하지만 브라운필드 통합은 여전히 레거시 배선 및 제어에 따라 달라집니다. 자본 비용이 낮아짐에 따라 의사 결정은 하드웨어의 저렴성보다 에너지 절약 증명 포인트에 달려 있습니다.
가속하는 사무실 하이브리드 워크 재 설계
하이브리드 스케줄링은 평일의 직원 수를 변화시켜 기존의 시간대별 HVAC 프로그래밍을 시대 지연시킵니다. 존슨 컨트롤스는 2025년 1분기에 기류와 조명을 과거의 평균값이 아닌 실제 재실자에 맞게 조절하는 적응형 제어장치의 수주를 16% 늘렸습니다. 워싱턴 DC가 있는 오피스 빌딩은 정적 세트 포인트를 멀티 센서에 의한 가동률 데이터로 대체한 결과 33%의 에너지 절약을 실현했습니다. AI 환기 모델은 환기 에너지를 12.5% 줄이면서 CO2 농도를 1,000ppm 미만으로 줄여 웰니스 목표와 수익 목표를 일치시켰습니다. 상업시설의 대출 커뮤니티는 검증된 이용률에 따라 변동하는 동적 임대료를 시험하고 있으며 데이터 배출을 수익원으로 바꾸고 있습니다. 그러나 실시간 분석에는 GDPR(EU 개인정보보호규정) 및 CCPA 하에서 임차인의 프라이버시를 보호하기 위해 사이버 하드화된 네트워크와 보안 데이터 레이크가 필요합니다.
썩은 건물에서는 초기 리노베이션 비용이 높습니다.
오래된 부동산은 오픈 프로토콜 오버레이에 저항하는 독자적인 HVAC 및 조명 시스템을 포함하는 경우가 많습니다. QuadReal은 3,000만 평방 피트에 걸쳐 패시브 광 백본을 구축하고 이종 서브시스템을 통합해야 했습니다. Limbach는 여러 HVAC 빈티지에 걸쳐 20개 사이트를 디지털화하여 분석을 복잡하게 하는 일관성 없는 데이터 입도를 보여주었습니다. PHOENIX와 같은 파일럿 프로그램은 39-61%의 효율성 향상을 보였지만 원격 측정을 정규화하기 위해 맞춤형 미들웨어가 필요했습니다. 에너지 서비스 회사의 자금 조달 및 성과 기반 임대는 현금 지출을 서비스 수수료로 전환하는 데 도움이 되지만 이해관계자가 기계, 전기 및 IT 업그레이드를 하나의 프로젝트 헌장 하에서 조정해야 하는 경우 의사 결정 주기는 여전히 길어집니다.
부문 분석
솔루션은 2024년 매출의 68%를 차지하며 스마트 스페이스 시장 규모의 113억 6,000만 달러에 해당했습니다. 하드웨어 디바이스와 감시 소프트웨어가 디지털 백본을 형성하고 있지만, 최종 사용자가 최적화를 제3자에게 위탁하는 경우가 늘고 있습니다. 지속적인 시운전, 원격 진단, AI에 의한 의사결정 지원에 대한 의욕을 반영하여 서비스의 CAGR은 13.87%를 나타낼 것으로 예측됩니다. BrainBox AI는 2024년 3월에 생성된 빌 어시스턴트를 발표하여 에너지 이상에 대한 대화를 통한 문의 및 처방적인 조정을 가능하게 했습니다. Trane Technologies는 이 기능을 즉시 애프터마켓 포트폴리오에 통합하여 2자리 광열비 절감을 보장하는 성과 기반 계약에 자율 HVAC 제어를 번들했습니다. 매니지드 서비스 벤더는 냉동기를 좁은 설정 온도대에 유지하고 마모를 줄이고 이산화탄소 배출량을 억제하는 알고리즘에 공급함으로써 매시간의 텔레메트리를 수익화하고 있습니다. 노동력 부족으로 사내 설비팀이 제약을 받는 가운데 경영 간부는 외부 전문 지식을 퍼포먼스 페널티에 대한 리스크 보험으로 간주하고 있습니다.
장기적으로 하이브리드 클라우드 아키텍처는 장치의 펌웨어, 분석 모델 및 보안 패치가 지속적으로 업데이트되므로 제품 및 서비스의 경계가 모호해질 것으로 보입니다. 에지 디바이스와 클라우드 플랫폼을 모두 소유하는 벤더는 현지에 발을 들지 않고 OTA(Over-the-Air)를 통한 향상된 기능을 추진할 수 있기 때문에 록인이 깊어지면서 순수한 하드웨어 라이벌을 압박하게 됩니다. 따라서 스마트 스페이스 시장은 한 번의 설치에서 라이프사이클 스튜어드십으로 축발을 옮기는 기업에 보상을 주고 서비스 성장 프리미엄을 강화합니다.
상업 부동산, 헬스케어, 접객, 소매는 2024년 스마트 스페이스 시장 규모의 59%, 98억 5,000만 달러의 매출을 창출했습니다. 사무실에서는 분석 가능한 가동률 데이터가 필요한 유연한 좌석을 추구하고 병원은 감염 제어를 위해 공기 교환 및 장비 가동 시간을 추적합니다. 반면 주택, 특히 집주택에 대한 수요는 CAGR 13.75%를 나타낼 것으로 예측됩니다. Logical Buildings는 수요화를 위한 수요화를 위해 집합 주택 전체에서 1억 1,000만 달러의 가상 발전소를 계획하고 함대 규모의 주택 경제성을 입증합니다. SmartRent는 2024년 12월에 셀프서비스 거주자 포털, 입퇴실 관리, 서브미터의 집주인 채용을 확대하기 위해 1,000만 달러를 기록했습니다. 규제 완화 시장의 유틸리티자는 피크 컷 프로그램과 연동한 스마트 서모스탯에 현금 인센티브를 제공하여 주택 소유자의 이익과 송전망의 안정성을 일치시키고 있습니다. 소비자의 가격 감응도가 여전히 억제요인인 반면 광대역과 에너지의 번들 패키지는 취득 마찰을 저하시키고, 2030년까지 스마트 스페이스 시장은 부문간에 균형 잡힌 수요에 기울어집니다.
규제 당국은 EU의 일부와 미국의 일부 주에서 신축 아파트에 서브미터를 설치하도록 의무화하고 가정의 에너지 관리를 뒷받침하고 있습니다. 이와 같은 정책의 추풍으로 인해 주택 판매량이 증가하고 있지만, 1대당 매출은 상업용 평균에 뒤처져 있습니다. 벤더는 보안, 웰니스, 노인 케어 모니터링에 걸친 플랫폼 멀티 제품의 크로스세일스를 통해 마진의 희박화에 대항하고 있습니다. 서비스 포트폴리오가 심화됨에 따라 주택용 커브는 상업용 기존 기업과의 차이를 줄이고 스마트 공간 산업이 유비쿼터스 인프라층으로 진화하고 있음을 뒷받침하고 있습니다.
스마트 스페이스 시장 보고서는 유형별(솔루션 및 서비스), 최종 사용자 산업별(상업용 및 주택용), 용도별(에너지 관리, 거주 및 공간 분석, 조명 및 HVAC 제어 등), 연결 기술별(Wi-Fi, Zigbee, Z-Wave 등), 지역별로 분류됩니다.
지역 분석
북미는 2024년 매출의 37%를 차지했고, 엄격한 주 수준의 에너지 규범과 하이브리드 워크 분석의 조기 도입이 견인했습니다. 캘리포니아의 적극적인 기준과 연방세 공제는 대규모 리노베이션을 지원하고 물류 공원의 민간 5G 파일럿 테스트는 대기 시간에 민감한 이용 사례를 확인합니다. 하니웰은 클라우드 네이티브 대시보드에 대한 미국 수요에 힘입어 2025년 1분기에 빌딩 오토메이션 제품 전체에서 8%의 유기적 성장을 기록했습니다. 사이버 보안 규제에 의해 기업이 컴플라이언스 업무를 신뢰할 수 있는 벤더에 위탁하는 것으로, 매니지드 서비스의 도입이 가속. 노후화된 스톡의 리노베이션 비용은 롤아웃의 속도를 억제하지만, 측정된 절약에 요금을 연결하는 성과 기반 계약은 보수적인 예산을 해방하고 스마트 스페이스 시장은 견실한 확대 노선을 유지하고 있습니다.
아시아태평양의 CAGR은 13.53%로 앞으로 점점 세계 시장 규모를 밀어올릴 것으로 보입니다. 중국은 2024년 예산으로 스마트 시티의 조종사 사업에 45억 달러를 할당하고 모든 새로운 시청에 디지털 트윈을 통합하도록 규정했습니다. 일본의 '소사이어티 5.0' 로드맵은 스마트 빌딩과 보다 광범위한 로보틱스 및 이동성 네트워크를 번들로 제공하고 있으며, 인도의 '스마트 시티 미션'은 196억 7,000만 달러에 해당하는 8,000개의 라이브 프로젝트에 이르고 있습니다. 기업 투자도 공공의 뒷받침과 보조를 맞추고 있습니다. 규제 상황이 다르기 때문에 다국적 기업의 스케일링은 복잡하지만, 도시 밀도, 에너지 안보, 고령화 등 공통의 동기가 지역 전체 수요를 지지하고 있습니다.
유럽은 기후 변화 정책을 배경으로 규율적인 성장을 유지하고 있습니다. EU의 제로 방출 명령은 비효율적인 제어 장치의 대체 시장을 보장하고 GDPR(EU 개인정보보호규정)은 개인 정보 보호 디자인의 기능이 프리미엄 가격임을 보장합니다. 지멘스는 베를린의 지멘스슈타트를 디지털 트윈으로 재생하기 위해 7억 5,000만 유로를 던져 스마트 캠퍼스 모델에 대한 자신감을 반영합니다. 중동 및 아프리카에서는 도입이 늦었지만 거대한 프로젝트 쇼케이스가 있습니다. 예산 변동과 정치적 위험으로 인해 정부 지원 벤처 기업에 대한 도입이 편향되었지만, 입증된 수익은 장기간에 걸쳐 민간 공동 투자자를 끌어들여 대응 가능한 스마트 스페이스 시장을 확대하고 있습니다.
기타 혜택 :
- 엑셀 형식 시장 예측(ME) 시트
- 3개월간의 애널리스트 지원
목차
제1장 서론
- 조사 전제조건과 시장 정의
- 조사 범위
제2장 조사 방법
제3장 주요 요약
제4장 시장 상황
- 시장 개요
- 시장 성장 촉진요인
- IoT 대응 디바이스의 보급과 센서 가격 하락
- COVID 후의 하이브리드 워크에 의한 오피스 재설계의 가속
- 그린빌딩/넷제로규제의 의무화
- 상업시설에서의 5G 사설망의 급속한 전개
- AI를 활용한 워크플레이스 분석에 의한 부동산 OPEX의 삭감
- 입주 베이스의 보험과 리스 모델의 대두
- 시장 성장 억제요인
- 브라운필드 빌딩의 높은 초기 리노베이션 비용
- 사이버 보안 및 데이터 프라이버시에 대한 부채
- 벤더간의 상호 운용성의 갭과 표준의 단편화
- 상업용 부동산 평가의 변동성
- 밸류체인 분석
- 규제 상황
- 기술적 전망
- Porter's Porter's Five Forces
- 신규 참가업체의 위협
- 구매자·소비자의 협상력
- 공급기업의 협상력
- 대체품의 위협
- 경쟁 기업 간 경쟁 관계의 강도
제5장 시장 규모와 성장 예측
- 유형별
- 솔루션
- 소프트웨어 플랫폼
- 하드웨어 및 엣지 디바이스
- 서비스
- 전문 서비스
- 관리 서비스
- 솔루션
- 최종 사용자 업계별
- 상업
- 사무실 및 공동 작업 공간
- 소매점 및 쇼핑몰
- 의료시설
- 숙박 및 레저
- 주택
- 단독 주택
- 다세대 주택
- 상업
- 용도별
- 에너지 관리
- 점유 및 공간 분석
- 조명 및 HVAC 제어
- 보안 및 접근 관리
- 설비 자동화 통합 플랫폼
- 접속 기술별
- Wi-Fi
- 블루투스 저에너지(BLE)
- Zigbee
- 스레드/매터
- Z-Wave
- NB-IoT 및 LoRaWAN
- 유선(이더넷/PoE)
- 지역별
- 북미
- 미국
- 캐나다
- 멕시코
- 남미
- 아르헨티나
- 브라질
- 기타 남미
- 유럽
- 영국
- 프랑스
- 독일
- 기타 유럽
- 아시아태평양
- 중국
- 일본
- 인도
- 한국
- 기타 아시아태평양
- 중동 및 아프리카
- 중동
- 사우디아라비아
- 아랍에미리트(UAE)
- 튀르키예
- 기타 중동
- 아프리카
- 나이지리아
- 남아프리카
- 기타 아프리카
- 북미
제6장 경쟁 구도
- 시장의 집중
- 전략적인 동향
- 시장 점유율 분석
- 기업 프로파일
- ABB Ltd
- Siemens AG
- Cisco Systems Inc.
- Schneider Electric SE
- IBM Corporation
- Microsoft Corporation
- Honeywell International Inc.
- Johnson Controls International
- Huawei Technologies Co. Ltd.
- Hitachi Vantara LLC
- ICONICS Inc.
- Spacewell(Nemetschek Group)
- SmartSpace Software PLC
- Ubisense Ltd.
- Adappt Intelligence Inc.
- Enlighted Inc.(Siemens)
- Bosch Building Technologies
- Legrand SA
- Crestron Electronics Inc.
- Verkada Inc.
제7장 시장 기회와 전망
KTH 25.11.07The Smart spaces market size stood at USD 16.70 billion in 2025 and is forecast to expand at a 12.22% CAGR, reaching USD 29.46 billion by 2030.
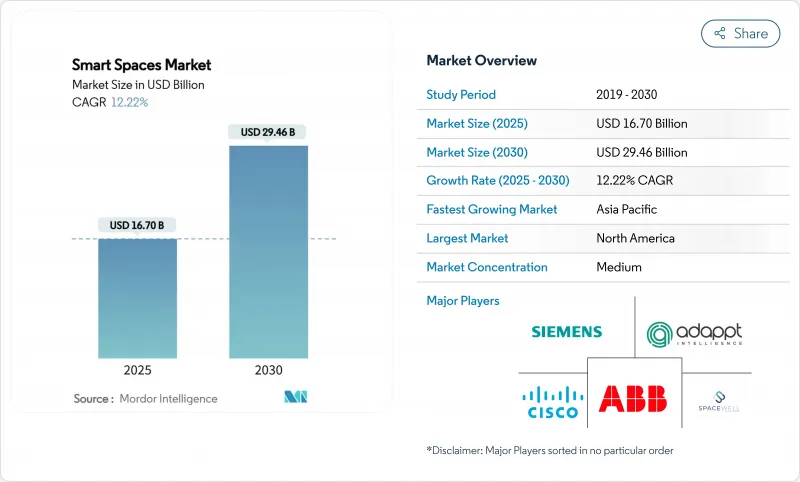
The upward trajectory is shaped by falling IoT sensor prices that simplify large-scale deployment, mandatory net-zero building codes that accelerate digital retrofits, and hybrid-work policies that reward real-time space optimisation. Interoperable standards such as Thread 1.4, certified on more than 670 products by Q1 2025, remove integration risks and shorten payback windows. Private 5G rollouts across commercial campuses underpin advanced analytics that lower utilities and maintenance costs while enabling predictive workplace services. Vendors are also scaling software-as-a-service models that bundle continuous optimisation with outcome-based pricing, a shift that converts one-time capital expenditure into recurring revenue. The Smart space market, therefore, benefits from both top-line demand for compliance and bottom-line demand for efficiency.
Global Smart Spaces Market Trends and Insights
IoT-enabled device proliferation and falling sensor prices
Semiconductor oversupply has pushed sensor average selling prices down by double-digits since 2023, allowing building owners to blanket properties with occupancy, air-quality and power-meter nodes that feed granular data to cloud analytics. More than 670 Thread-certified devices shipped by early 2025, a clear signal that vendors now view multi-vendor interoperability as table stakes. A 352-sensor deployment at Milesight's headquarters cut annual utilities by USD 45,000, a case that has circulated widely among facilities managers. Expanded memory bandwidth in edge AI chips eliminates latency penalties and supports real-time control loops, yet brownfield integration still varies by legacy wiring and controls. As capital costs decline, decisions hinge on energy-saving proof points rather than hardware affordability, a pivot that keeps the Smart space market in a demand-led cycle.
Accelerated hybrid-work redesign of offices
Hybrid scheduling fluctuates weekday headcounts, making legacy time-of-day HVAC programming obsolete. Johnson Controls logged 16% order growth in Q1 2025 for adaptive controls that modulate airflow and lighting to actual presence rather than historical averages. A Washington D.C. office building realised 33% energy savings after replacing static set-points with multi-sensor occupancy data that instructs chillers to follow demand curves. AI ventilation models have kept CO2 concentrations below 1,000 ppm while trimming ventilation energy by 12.5%, aligning wellness goals with bottom-line targets. The commercial landlord community is experimenting with dynamic rent that flexes by verified utilisation, turning data exhaust into revenue streams. Real-time analytics, however, require cyber-hardened networks and secure data lakes to protect tenant privacy under GDPR and CCPA.
High upfront retrofit costs for brown-field buildings
Older properties often contain proprietary HVAC or lighting systems that resist open-protocol overlays. QuadReal required a passive optical backbone across 30 million sq ft to unify disparate subsystems, a capital project justifiable only by projected 50-70% operational savings. Limbach's digitisation of 20 sites spanning multiple HVAC vintages exposed inconsistent data granularity that complicated analytics. Pilot programmes such as PHOENIX delivered headline efficiency gains of 39-61% but demanded customised middleware to normalise telemetry. Energy-service-company financing and outcome-based leases help convert cash outlays into service fees, yet decision cycles still elongate when stakeholders must coordinate mechanical, electrical, and IT upgrades under one project charter.
Other drivers and restraints analyzed in the detailed report include:
- Mandatory green-building / net-zero regulations
- Rapid 5G private-network rollouts in commercial estates
- Cyber-security and data-privacy liabilities
For complete list of drivers and restraints, kindly check the Table Of Contents.
Segment Analysis
Solutions retained the lion's share at 68% of 2024 revenue, equal to USD 11.36 billion of the Smart space market size. Hardware devices and supervisory software form the digital backbone, yet end-users increasingly outsource optimisation to third parties. Services are set to post a 13.87% CAGR, reflecting appetite for continuous commissioning, remote diagnostics, and AI-driven decision support. BrainBox AI launched its generative building assistant in March 2024, enabling conversational queries about energy anomalies and prescriptive adjustments. Trane Technologies quickly folded the capability into its aftermarket portfolio, bundling autonomous HVAC controls inside outcome-based contracts that guarantee double-digit utility cuts. Managed-service vendors monetise hourly telemetry by feeding algorithms that keep chillers within narrow set-point bands, reducing wear and curbing carbon fees. As labour shortages constrain in-house facility teams, executives view external expertise as risk insurance against performance penalties.
In the long run, hybrid cloud architectures will blur product and service boundaries because device firmware, analytics models, and security patches update continuously. Vendors that own both edge devices and cloud platforms can push over-the-air enhancements without onsite visits, deepening lock-in while squeezing pure-play hardware rivals. The Smart space market therefore rewards firms that pivot from one-and-done installations toward lifecycle stewardship, reinforcing the Services growth premium.
Commercial real estate, healthcare, hospitality and retail collectively generated 59% of 2024 revenue, or USD 9.85 billion of the Smart space market size. Offices pursue flexible seating that demands analytics-ready occupancy data, whereas hospitals track air exchange and device uptime for infection control. Yet residential demand, especially in multi-dwelling units, is forecast to rise at a 13.75% CAGR. Logical Buildings is orchestrating a USD 110 million virtual power plant across multifamily stock to monetise demand response, demonstrating fleet-scale residential economics. SmartRent earmarked USD 10 million in December 2024 to widen landlord adoption of self-service resident portals, access control, and sub-metering. Utilities in deregulated markets offer cash incentives for smart thermostats linked to peak-shave programmes, aligning homeowner interests with grid stability. While consumer price sensitivity remains a restraint, bundled broadband plus energy packages lower acquisition friction, tilting the Smart space market toward balanced demand across sectors by 2030.
Regulators also push home energy management via mandatory sub-meters in new apartments across parts of the EU and select US states. This policy tailwind elevates residential volumes, though per-unit revenue lags commercial averages. Vendors combat margin dilution through platform multiproduct cross-sales spanning security, wellness and eldercare monitoring. As service portfolios deepen, the residential curve narrows its gap with commercial incumbents, confirming the Smart space industry's evolution into a ubiquitous infrastructure layer.
Smart Spaces Market Report is Segmented by Type (Solutions and Services), End-User Industry (Commercial and Residential), Application (Energy Management, Occupancy and Space Analytics, Lighting and HVAC Control, and More), Connectivity Technology (Wi-Fi, Zigbee, Z-Wave, and More), and Geography.
Geography Analysis
North America contributed 37% of 2024 revenue, driven by stringent state-level energy codes and early adoption of hybrid-work analytics. California's aggressive standards and federal tax credits support deep retrofits, while private 5G pilots in logistics parks validate latency-sensitive use cases. Honeywell recorded 8% organic growth across its building automation lines in Q1 2025, underpinned by US demand for cloud-native dashboards. Cyber-security regulation accelerates managed-service uptake as firms outsource compliance tasks to trusted vendors. Retrofit costs for ageing stock temper rollout pace, but outcome-based contracts that tie fees to measured savings unlock conservative budgets, keeping the Smart space market on a solid expansion path.
Asia Pacific is on track for a 13.53% CAGR and will increasingly tilt global volume. China allocated USD 4.5 billion to smart city pilots in its 2024 budget, stipulating that all new municipal buildings integrate digital twins. Japan's Society 5.0 roadmap bundles smart buildings with wider robotics and mobility networks, while India's Smart Cities Mission spans 8,000 live projects worth USD 19.67 billion. Corporate investments match the public push: Toyota's Woven City near Mount Fuji serves as a private testbed for sensor-dense neighbourhoods. Heterogeneous regulatory landscapes complicate multinational scaling, but common motivations-urban density, energy security and ageing populations-sustain demand across the region.
Europe maintains disciplined growth on the back of climate policy. The EU's zero-emission mandate guarantees a replacement market for inefficient controls, and GDPR ensures that privacy-by-design features carry premium pricing. Siemens committed EUR 750 million to regenerate Berlin's Siemensstadt with digital twins, reflecting confidence in smart campus models. Middle East and Africa trail in adoption but showcase showcase megaprojects: Saudi Arabia's Neom and the UAE's Masdar City rely on fully digital building fabrics, serving as regional proof points. Budget volatility and political risk keep deployment skewed to government-backed ventures, yet demonstrable returns draw private co-investors over time, widening the addressable Smart spaces market.
- ABB Ltd
- Siemens AG
- Cisco Systems Inc.
- Schneider Electric SE
- IBM Corporation
- Microsoft Corporation
- Honeywell International Inc.
- Johnson Controls International
- Huawei Technologies Co. Ltd.
- Hitachi Vantara LLC
- ICONICS Inc.
- Spacewell (Nemetschek Group)
- SmartSpace Software PLC
- Ubisense Ltd.
- Adappt Intelligence Inc.
- Enlighted Inc. (Siemens)
- Bosch Building Technologies
- Legrand SA
- Crestron Electronics Inc.
- Verkada Inc.
Additional Benefits:
- The market estimate (ME) sheet in Excel format
- 3 months of analyst support
TABLE OF CONTENTS
1 INTRODUCTION
- 1.1 Study Assumptions and Market Definition
- 1.2 Scope of the Study
2 RESEARCH METHODOLOGY
3 EXECUTIVE SUMMARY
4 MARKET LANDSCAPE
- 4.1 Market Overview
- 4.2 Market Drivers
- 4.2.1 IoT-enabled device proliferation and falling sensor prices
- 4.2.2 Accelerated post-COVID hybrid-work redesign of offices
- 4.2.3 Mandatory green-building / net-zero regulations
- 4.2.4 Rapid 5G private-network roll-outs in commercial estates
- 4.2.5 AI-driven workplace analytics reducing real-estate OPEX
- 4.2.6 Rise of occupancy-based insurance and leasing models
- 4.3 Market Restraints
- 4.3.1 High upfront retro-fit costs for brown-field buildings
- 4.3.2 Cyber-security and data-privacy liabilities
- 4.3.3 Inter-vendor interoperability gaps and standards fragmentation
- 4.3.4 Volatility in commercial real-estate valuations
- 4.4 Value Chain Analysis
- 4.5 Regulatory Landscape
- 4.6 Technological Outlook
- 4.7 Porter's Five Forces Analysis
- 4.7.1 Threat of New Entrants
- 4.7.2 Bargaining Power of Buyers/Consumers
- 4.7.3 Bargaining Power of Suppliers
- 4.7.4 Threat of Substitute Products
- 4.7.5 Intensity of Competitive Rivalry
5 MARKET SIZE AND GROWTH FORECASTS (VALUE)
- 5.1 By Type
- 5.1.1 Solutions
- 5.1.1.1 Software Platforms
- 5.1.1.2 Hardware and Edge Devices
- 5.1.2 Services
- 5.1.2.1 Professional Services
- 5.1.2.2 Managed Services
- 5.1.1 Solutions
- 5.2 By End-user Industry
- 5.2.1 Commercial
- 5.2.1.1 Offices and Co-working Spaces
- 5.2.1.2 Retail and Malls
- 5.2.1.3 Healthcare Facilities
- 5.2.1.4 Hospitality and Leisure
- 5.2.2 Residential
- 5.2.2.1 Single-family Homes
- 5.2.2.2 Multi-dwelling Units
- 5.2.1 Commercial
- 5.3 By Application
- 5.3.1 Energy Management
- 5.3.2 Occupancy and Space Analytics
- 5.3.3 Lighting and HVAC Control
- 5.3.4 Security and Access Management
- 5.3.5 Facility Automation Integration Platforms
- 5.4 By Connectivity Technology
- 5.4.1 Wi-Fi
- 5.4.2 Bluetooth Low Energy (BLE)
- 5.4.3 Zigbee
- 5.4.4 Thread / Matter
- 5.4.5 Z-Wave
- 5.4.6 NB-IoT and LoRaWAN
- 5.4.7 Wired (Ethernet / PoE)
- 5.5 By Geography
- 5.5.1 North America
- 5.5.1.1 United States
- 5.5.1.2 Canada
- 5.5.1.3 Mexico
- 5.5.2 South America
- 5.5.2.1 Argentina
- 5.5.2.2 Brazil
- 5.5.2.3 Rest of South America
- 5.5.3 Europe
- 5.5.3.1 United Kingdom
- 5.5.3.2 France
- 5.5.3.3 Germany
- 5.5.3.4 Rest of Europe
- 5.5.4 Asia Pacific
- 5.5.4.1 China
- 5.5.4.2 Japan
- 5.5.4.3 India
- 5.5.4.4 South Korea
- 5.5.4.5 Rest of Asia Pacific
- 5.5.5 Middle East and Africa
- 5.5.5.1 Middle East
- 5.5.5.1.1 Saudi Arabia
- 5.5.5.1.2 United Arab Emirates
- 5.5.5.1.3 Turkey
- 5.5.5.1.4 Rest of Middle East
- 5.5.5.2 Africa
- 5.5.5.2.1 Nigeria
- 5.5.5.2.2 South Africa
- 5.5.5.2.3 Rest of Africa
- 5.5.1 North America
6 COMPETITIVE LANDSCAPE
- 6.1 Market Concentration
- 6.2 Strategic Moves
- 6.3 Market Share Analysis
- 6.4 Company Profiles (includes Global level Overview, Market level overview, Core Segments, Financials as available, Strategic Information, Market Rank/Share for key companies, Products and Services, and Recent Developments)
- 6.4.1 ABB Ltd
- 6.4.2 Siemens AG
- 6.4.3 Cisco Systems Inc.
- 6.4.4 Schneider Electric SE
- 6.4.5 IBM Corporation
- 6.4.6 Microsoft Corporation
- 6.4.7 Honeywell International Inc.
- 6.4.8 Johnson Controls International
- 6.4.9 Huawei Technologies Co. Ltd.
- 6.4.10 Hitachi Vantara LLC
- 6.4.11 ICONICS Inc.
- 6.4.12 Spacewell (Nemetschek Group)
- 6.4.13 SmartSpace Software PLC
- 6.4.14 Ubisense Ltd.
- 6.4.15 Adappt Intelligence Inc.
- 6.4.16 Enlighted Inc. (Siemens)
- 6.4.17 Bosch Building Technologies
- 6.4.18 Legrand SA
- 6.4.19 Crestron Electronics Inc.
- 6.4.20 Verkada Inc.
7 MARKET OPPORTUNITIES AND FUTURE OUTLOOK
- 7.1 White-space and Unmet-need Assessment
