


|
시장보고서
상품코드
1849842
증강현실(AR) : 시장 점유율 분석, 산업 동향, 통계, 성장 예측(2025-2030년)Augmented Reality - Market Share Analysis, Industry Trends & Statistics, Growth Forecasts (2025 - 2030) |
||||||
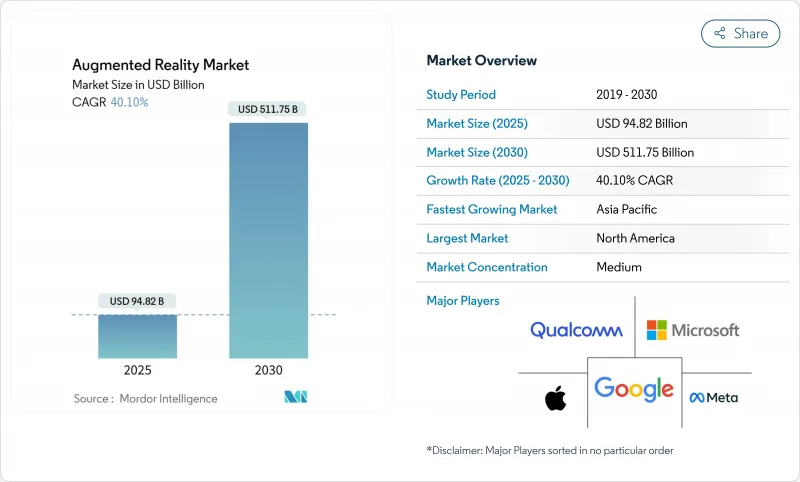
증강현실(AR) 시장 규모는 2025년 948억 2,000만 달러에 이르며, CAGR 40.1%를 나타내 2030년에는 5,117억 5,000만 달러로 상승할 것으로 예측됩니다.
5G 네트워크가 지연 장벽을 없애고 주권의 AI 정책이 장치에서 추론을 추진하고 Apple의 Vision Pro가 공간 컴퓨팅 이용 사례를 검증함에 따라 수요가 가속화됩니다. 제조, 헬스케어, 에너지 분야의 기업들은 의사결정 주기를 단축하기 위해 디지털 트윈 오버레이를 표준화하고, 생성형 AI 툴은 컨텐츠 개발 시간을 수개월에서 며칠로 단축하고 있습니다. 도파관과 MicroLED의 하드웨어 혁신은 계속되고 있지만, 클라우드 중심의 소프트웨어 플랫폼은 더욱 빠르게 성장하고 있으며, 기업은 무거운 인프라 없이 세계 공장으로 파일럿을 확대할 수 있게 되었습니다. 기업이 민감한 데이터를 소비자 스마트폰에서 관리되는 산업용 엔드포인트로 이동함에 따라 보안 강화 AR 스택과 에지 최적화된 렌더링이 기본 요구사항이 되고 있습니다.
세계의 증강현실(AR) 시장 동향과 인사이트
5G 지원 저지연 모바일 네트워크
독립형 5G로 달성할 수 있는 20ms 이하의 라운드 트립 시간은 공유 홀로그램의 실시간 위치 업데이트를 가능하게 합니다. 에릭슨은 공간 데이터 트래픽을 선호하는 엣지 컴퓨팅 슬라이스를 통해 장치가 연결되면 AR 세션의 지속 시간이 길어진다고 보고합니다. 체코공화국의 원자력발전소 등 프라이빗 5G를 채용하고 있는 제조현장에서는 가이드 부착 검사시의 효율 향상과 안전성의 향상이 기록되어 있습니다. 통신 사업자는 증강현실(AR) 시장을 음성 소득 감소를 보완하는 프리미엄 업셀이라고 보고 있으며, 개발자에게 서비스 품질 계층을 공개하는 네트워크 API에 대한 투자를 촉구하고 있습니다. 테라비트 처리량을 목표로 하는 6G 준비는 테더링 없이 볼륨이 있는 비디오를 스트리밍하는 경량 안경을 가능하게 하여 2자리 성장 예측을 강화합니다.
스마트폰 보급률 상승과 AR 대응 앱
아시아태평양에서는 2024년에 1억 3,000만 명의 모바일 가입자가 증가하고 보급률은 51%에 달하며 AR 커머스를 위한 비옥한 설치 기반이 형성되었습니다. IKEA와 L'Oreal의 소매 파일럿은 고객이 실제 규모로 상품을 시각화함으로써 체류 시간이 10분을 초과하는 것으로 나타났습니다. 스마트폰의 광학계는 실내 내비게이션에서는 여전히 고전하고 있으며, 오사카 대학은 드리프트에 의한 멀미를 관찰하고 있습니다. 하지만 스마트폰은 처음으로 AR을 사용하는 많은 사용자에게 대중용 안경보다 먼저 개발자의 생태계를 육성하는 온 램프인 것으로 변함이 없습니다.
헤드 마운트 디스플레이 배터리 수명 및 인체 공학
현재의 장치는 100g 가까운 무게로, 2시간을 넘는 동작은 거의 없습니다. Apple의 Vision Pro는 마이크로 OLED의 고휘도가 배터리를 빠르게 소모한다는 절충점을 강조합니다. 도쿄 대학의 연구자들은 헤드셋에서 전력 소비를 이동시키기 위해 오프 보드의 "비밍 디스플레이"를 제안했습니다. HoloLens 2의 에너지 프로파일링에 따르면 디스플레이의 휘도는 전력 소비의 62%를 차지하고 있으며, 소프트웨어에 의한 디밍과 장면을 고려한 렌더링은 세션을 5분의 1로 늘릴 수 있음을 시사합니다. 산업용 사용자는 제한된 작업을 위해 더 무거운 장비를 받아들이고 있지만, 대량 소비자의 섭취는 진정한 하루 종일 사용할 수있는 웨어러블에 달려 있습니다.
부문 분석
2024년 증강현실(AR) 시장 판매의 67.5%는 기계설비가 차지했습니다. 구성 요소 벤더는 도파관 효율과 MicroLED의 휘도를 높이고 배터리 수명을 연장하고 옥외에서 사용할 수 있습니다. 삼성의 LEDoS 로드맵은 2027년까지 양산을 목표로 하며 기업용 및 라이프스타일용 안경 모두에 적합한 슬림한 광학계를 약속하고 있습니다. 하드웨어가 필수적인 것은 아니지만 클라우드 퍼스트 플랫폼을 통해 기업은 기존 모바일 장치에 AR을 시험적으로 도입할 수 있어 소규모 공장과 클리닉의 장벽이 낮아졌습니다. 결과적으로 소프트웨어 CAGR은 42.0%를 기록했으며 2030년까지 수익 격차가 줄어들 것으로 예측됩니다. 타사 OEM에 성숙한 운영 체제를 사전 로드하는 라이선싱 전략은 PC의 생태계를 반영하여 장치 간 용도의 이식성을 가속화합니다.
클라우드 오케스트레이션 도구는 CAD 어셈블리를 시퀀싱된 홀로그래픽 명령어로 자동 변환하는 일반 AI 모듈을 통합하여 배포 시간을 3분의 2로 줄입니다. 구독 가격은 투자를 자본 지출에서 운영 예산으로 이동시키고 기업의 디지털화 지침에 부합합니다. 이러한 디바이스 비용의 저하와 플랫폼의 고도화의 융합은 증강현실(AR) 시장의 지속적인 확대를 지원하고 있습니다.
도파관과 회절 광학은 2024년 시장 수익의 51.3%를 차지했습니다. SCHOTT의 새로운 크림 시설은 유리 블랭크의 생산 능력을 끌어올리지만 MicroLED 혁신이 기존 점유율을 침식하고 있습니다. Mojo Vision의 모놀리식 RGB 어레이는 소비 전력을 반감시키면서 6,350 PPI를 실현하여 기존 디스플레이를 능가했습니다. 폭스콘이 폴로텍과 제휴하여 2025년 웨이퍼 가공을 시작하면 공급망이 대량 생산을 위한 준비를 진행하고 있음을 보여줍니다. 수율이 향상되면 MicroLED 모듈은 개발자용 키트에서 소비자용 아이웨어로 이동하여 비용 구조가 변경되고 옥외에서의 가시성이 향상됩니다.
제조체는 MicroLED 패널을 팬케이크 렌즈나 다층막 코팅과 조합해 콘트라스트를 높입니다. 액정 온실리콘은 특히 컴팩트함이 주간 시인성에 우선하는 트레이닝 키오스크 단말기 등 저렴한 헤드셋에 여전히 적합합니다. 예측 기간 동안 MicroLED의 급속한 효율성 향상은 우선 고성능 이용 사례를 전환한 후 중급 제품에 파급되고 증강현실(AR) 시장 전체의 기술 로드맵이 재구성될 것으로 예측됩니다.
지역 분석
북미가 2024년 증강현실(AR) 시장 매출의 38.6%를 차지하며 우위를 차지했습니다. 방위 및 공공 안전 기관의 정부 계약은 견고한 헤드셋의 안정적인 수요를 제공하고 FDA의 예측 가능한 승인 경로는 의료에 대한 배포를 가속화합니다. 벤처 투자는 실리콘 밸리와 시애틀에 집중하고 나중에 멕시코와 캐나다에서 제조 파트너십을 확대하는 플랫폼 신흥 기업에 자금을 제공하여 지역 생태계를 강화하고 있습니다.
아시아태평양의 CAGR 전망은 40.8%로 가장 높으며, 중국의 3조 3,300억 위안의 연구개발 자금이 부품 주조소나 소프트웨어 연구소에 보조금을 공급하고 있습니다. 일본의 토미타카 스파콘은 실시간 공간 매핑을 위한 알고리즘 트레이닝을 지원하여 국내 광학 공급업체에게 이익을 제공합니다. 한국의 메타버스 청사진은 55억원의 장려금을 배경으로 2026년까지 220개 몰입형 기술기업 육성을 목표로 하고 있습니다. 이 지역의 모바일 경제는 GDP에 8,800억 달러의 영향을 미치고, 엄청난 소비자 대응 시장을 확보하고, 증강현실(AR) 시장 전체의 하드웨어 규모를 원활하게 합니다.
유럽은 균형 잡힌 궤도를 유지하고 있습니다. 독일은 AR을 활용하여 자동차와 기계의 조립 라인을 최적화하여 2자리 품질 향상을 달성. EU의 GDPR(EU 개인정보보호규정) 대응 압력은 공급업체가 프라이버시 보호 설계의 통합을 강요하고 나중에 세계 규범이 될 것입니다. 프랑스와 네덜란드의 스마트 시티 펀드는 대중 교통 AR 내비게이션 조종사에 자금을 제공하여 시민들에게 친숙해 졌습니다. 아시아태평양의 성장은 늦었지만 유럽 제조업의 엄격함은 증강현실(AR) 시장의 상당 부분을 지원하고 세계에서 채택된 안전 기준을 형성하고 있습니다.
기타 혜택 :
- 엑셀 형식 시장 예측(ME) 시트
- 3개월간의 애널리스트 지원
목차
제1장 서론
- 조사 전제조건과 시장 정의
- 조사 범위
제2장 조사 방법
제3장 주요 요약
제4장 시장 상황
- 시장 개요
- 시장 성장 촉진요인
- 5G 대응의 저지연 모바일 네트워크
- 스마트폰 보급률 상승과 AR 대응 앱
- 기업 트레이닝과 필드 서비스의 효율성 향상
- 신속한 AR 컨텐츠 작성을 위한 생성형 AI 툴
- 실시간 IoT 데이터를 위한 산업용 디지털 트윈 오버레이
- Apple Vision-Pro 주도의 공간 컴퓨팅 에코시스템의 추진
- 시장 성장 억제요인
- 헤드 마운트 디스플레이의 배터리 수명과 인체 공학
- 개인정보 보호 및 데이터 보안에 대한 우려
- 광 도파로 유리 공급의 병목
- 단편화된 개발자 표준과 크로스 플랫폼 문제
- 밸류체인 분석
- 규제 상황
- 기술 전망
- 클라우드 컴퓨팅
- 인공지능
- 사이버 보안
- 디지털 서비스
- Porter's Five Forces 분석
- 공급기업의 협상력
- 구매자의 협상력
- 신규 참가업체의 위협
- 대체품의 위협
- 경쟁 기업 간 경쟁 관계
- 투자분석
- 거시 경제 동향이 시장에 미치는 영향 평가
제5장 시장 규모와 성장 예측
- 제공별
- 하드웨어
- 독립형 HMD
- 유선 연결형 HMD
- 스크린리스 뷰어
- 소프트웨어
- 하드웨어
- 핵심 기술별
- OLED/마이크로 OLED
- 마이크로 LED
- 도파관 및 회절 광학
- 실리콘 상 액정(LCOS)
- 용도별
- 원격 지원 및 유지보수
- 제품의 시각화 및 구성
- 내비게이션 및 매핑
- 소셜 및 커뮤니케이션 필터
- 기타 용도
- 최종 사용자별
- 게임 및 엔터테인먼트
- 교육
- 헬스케어
- 소매
- 자동차 및 운송
- 기타 최종 사용자 분야
- 지역별
- 북미
- 미국
- 캐나다
- 멕시코
- 유럽
- 독일
- 영국
- 프랑스
- 이탈리아
- 스페인
- 기타 유럽
- 아시아태평양
- 중국
- 일본
- 인도
- 한국
- 호주
- 기타 아시아태평양
- 남미
- 브라질
- 아르헨티나
- 기타 남미
- 중동 및 아프리카
- 중동
- 사우디아라비아
- 아랍에미리트(UAE)
- 튀르키예
- 기타 중동
- 아프리카
- 남아프리카
- 이집트
- 나이지리아
- 기타 아프리카
- 북미
제6장 경쟁 구도
- 시장 집중도
- 전략적 동향
- 시장 점유율 분석
- 기업 프로파일
- Microsoft Corporation
- Google LLC(Alphabet)
- Meta Platforms Inc.
- Apple Inc.
- Snap Inc.
- Niantic Inc.
- PTC Inc.
- Vuzix Corporation
- Magic Leap Inc.
- Seiko Epson Corporation
- RealWear Inc.
- Lenovo Group Ltd.
- Fujitsu Ltd.
- Kopin Corporation
- Qualcomm Technologies Inc.
- Unity Technologies
- Dynabook Europe GmbH
- Optinvent SA
- Immersion Corporation
제7장 시장 기회와 향후 전망
KTH 25.11.03The Augmented Reality market size reached USD 94.82 billion in 2025 and is projected to climb to USD 511.75 billion by 2030, reflecting a 40.1% CAGR.

Demand accelerates as 5G networks remove latency barriers, sovereign AI policies push on-device inference, and Apple's Vision Pro validates spatial-computing use cases. Enterprises in manufacturing, healthcare, and energy are standardizing digital-twin overlays to shorten decision cycles, while generative-AI tools shrink content-development time from months to days. Hardware innovation in waveguides and MicroLEDs continues, yet cloud-centric software platforms are growing even faster, enabling organizations to scale pilots across global plants without heavy infrastructure. Security-hardened AR stacks and edge-optimized rendering are becoming default requirements as companies move sensitive data off consumer smartphones and into managed industrial endpoints.
Global Augmented Reality Market Trends and Insights
5G-enabled Low-latency Mobile Networks
Sub-20 millisecond round-trip times now achievable on standalone 5G allow real-time positional updates for shared holograms. Ericsson reports higher AR session durations when devices connect through edge-computing slices that prioritize spatial data traffic. Manufacturing sites adopting private 5G-such as nuclear plants in the Czech Republic-have documented efficiency lifts and safety gains during guided inspections. Operators view the Augmented Reality market as a premium upsell that offsets shrinking voice revenues, prompting investment in network APIs that expose quality-of-service tiers to developers. Preparations for 6G, targeting terabit throughput, will enable lightweight glasses to stream volumetric video without tethering, reinforcing double-digit growth forecasts.
Rising Smartphone Penetration and AR-ready Apps
Asia-Pacific added 130 million mobile subscribers in 2024, bringing penetration to 51% and creating a fertile install base for AR commerce. Retail pilots from IKEA and L'Oreal show dwell-time gains exceeding 10 minutes when customers visualize products in real scale. Smartphone optics still struggle in indoor navigation, where Osaka University observed drift-induced motion sickness; research points to ultra-wideband anchors as a remedy. Nevertheless, the handset remains the on-ramp for many first-time AR users, nurturing developer ecosystems ahead of mass-market glasses.
Battery-life and Ergonomics of Head-mounted Displays
Current devices weigh near 100 grams and seldom exceed two hours of operation. Apple's Vision Pro highlights the trade-off: high micro-OLED brightness drains batteries quickly. University of Tokyo researchers propose off-board "beaming displays" to shift power draw away from the headset. Energy profiling of HoloLens 2 shows display brightness accounts for 62% of consumption, implying software dimming and scene-aware rendering can stretch sessions by one-fifth. Industrial users accept heavier gear for limited tasks, yet mass-consumer uptake hinges on true all-day wearables.
Other drivers and restraints analyzed in the detailed report include:
- Enterprise Training and Field-service Efficiency Gains
- Generative-AI Tools for Rapid AR Content Creation
- Privacy and Data-security Concerns
For complete list of drivers and restraints, kindly check the Table Of Contents.
Segment Analysis
Hardware captured 67.5% of Augmented Reality market revenue in 2024 on the strength of stand-alone and tethered head-mounted displays. Component vendors push waveguide efficiency and MicroLED brightness to extend battery life and enable outdoor use. Samsung's LEDoS roadmap targets mass production before 2027, promising slimmer optics that suit both enterprise and lifestyle glasses. While hardware remains indispensable, cloud-first platforms now let firms pilot AR with existing mobile devices, lowering barriers for smaller factories and clinics. As a result, software is set to post a 42.0% CAGR and will narrow the revenue gap by 2030. Licensing strategies that let third-party OEMs preload mature operating systems mirror the PC ecosystem and accelerate application portability across devices.
Cloud orchestration tools embed generative-AI modules that auto-convert CAD assemblies into sequenced holographic instructions, trimming deployment time by two-thirds. Subscription pricing shifts investment from capital expenditure to operating budgets, aligning with enterprise digitization mandates. This blend of falling device costs and rising platform sophistication underpins sustained expansion across the Augmented Reality market.
Waveguide and diffractive optics controlled 51.3% market revenue in 2024, reflecting incumbent manufacturing depth. SCHOTT's new Kulim facility lifts glass-blank capacity, yet MicroLED innovations are eroding incumbent share. Mojo Vision's monolithic RGB array delivered 6,350 PPI while halving power draw, marking a leap over traditional displays. Foxconn's partnership with Porotech to start wafer processing in 2025 signals that supply chains are preparing for volume. As yields improve, MicroLED modules will move from developer kits into consumer eyewear, shifting cost structures and brightening outdoor legibility.
Manufacturers pair MicroLED panels with pancake lenses and multilayer coatings to enhance contrast. Liquid-Crystal-on-Silicon remains relevant for budget headsets, especially in training kiosks where compactness trumps daylight visibility. Over the forecast window, MicroLED's rapid efficiency gains are expected to convert high-performance use cases first, then cascade into mid-tier products, reshaping technical roadmaps across the Augmented Reality market.
The Augmented Reality Market Report is Segmented by Offering (Hardware and Software), Core Technology (OLED / Micro-OLED, Microled, Waveguide and Diffractive Optics, and More), Application (Remote Assistance and Maintenance, Product Visualisation and Configuration, and More), End-User Vertical (Gaming and Entertainment, Education, Healthcare, and More), and Geography. The Market Forecasts are Provided in Terms of Value (USD).
Geography Analysis
North America dominated with 38.6% Augmented Reality market revenue in 2024 owing to deep enterprise adoption and robust 5G coverage. Government contracts from defense and public-safety agencies provide steady demand for ruggedized headsets, while the FDA's predictable approval pathway accelerates medical deployments. Venture investment concentrates in Silicon Valley and Seattle, funding platform startups that later expand manufacturing partnerships in Mexico and Canada, reinforcing the regional ecosystem.
Asia-Pacific posted the highest 40.8% CAGR outlook, fueled by China's 3.33 trillion-yuan R&D pool that subsidizes component foundries and software labs. Japan's Fugaku supercomputer supports algorithm training for real-time spatial mapping, benefitting domestic optical suppliers. South Korea's metaverse blueprint aims to nurture 220 immersive-tech firms by 2026, backed by 5.5 billion won in incentives. The region's mobile economy, adding USD 880 billion in GDP impact, ensures massive consumer addressable markets, smoothing hardware scale-up across the Augmented Reality market.
Europe maintains a balanced trajectory. Germany leverages AR to optimize automotive and machinery assembly lines, achieving double-digit quality gains. The EU's GDPR compliance pressure forces vendors to embed privacy-preserving designs that later become global norms. Smart-city funds in France and the Netherlands finance AR navigation pilots for public transportation, expanding citizen familiarity. Though growth lags Asia-Pacific, European manufacturing rigor sustains a sizable slice of the Augmented Reality market and shapes safety standards adopted worldwide.
- Microsoft Corporation
- Google LLC (Alphabet)
- Meta Platforms Inc.
- Apple Inc.
- Snap Inc.
- Niantic Inc.
- PTC Inc.
- Vuzix Corporation
- Magic Leap Inc.
- Seiko Epson Corporation
- RealWear Inc.
- Lenovo Group Ltd.
- Fujitsu Ltd.
- Kopin Corporation
- Qualcomm Technologies Inc.
- Unity Technologies
- Dynabook Europe GmbH
- Optinvent SA
- Immersion Corporation
Additional Benefits:
- The market estimate (ME) sheet in Excel format
- 3 months of analyst support
TABLE OF CONTENTS
1 INTRODUCTION
- 1.1 Study Assumptions and Market Definition
- 1.2 Scope of the Study
2 RESEARCH METHODOLOGY
3 EXECUTIVE SUMMARY
4 MARKET LANDSCAPE
- 4.1 Market Overview
- 4.2 Market Drivers
- 4.2.1 5G-enabled low-latency mobile networks
- 4.2.2 Rising smartphone penetration and AR-ready apps
- 4.2.3 Enterprise training and field-service efficiency gains
- 4.2.4 Generative-AI tools for rapid AR content creation
- 4.2.5 Industrial digital-twin overlays for real-time IoT data
- 4.2.6 Apple Vision-Pro-led spatial-computing ecosystem push
- 4.3 Market Restraints
- 4.3.1 Battery-life and ergonomics of head-mounted displays
- 4.3.2 Privacy and data-security concerns
- 4.3.3 Optical-waveguide glass supply bottlenecks
- 4.3.4 Fragmented developer standards and cross-platform issues
- 4.4 Value Chain Analysis
- 4.5 Regulatory Landscape
- 4.6 Technological Outlook
- 4.6.1 Cloud Computing
- 4.6.2 Artificial Intelligence
- 4.6.3 Cyber-Security
- 4.6.4 Digital Services
- 4.7 Porter's Five Forces Analysis
- 4.7.1 Bargaining Power of Suppliers
- 4.7.2 Bargaining Power of Buyers
- 4.7.3 Threat of New Entrants
- 4.7.4 Threat of Substitutes
- 4.7.5 Intensity of Competitive Rivalry
- 4.8 Investment Analysis
- 4.9 Assessment of the Impact of Macroeconomic Trends on the Market
5 MARKET SIZE AND GROWTH FORECASTS (VALUE)
- 5.1 By Offering
- 5.1.1 Hardware
- 5.1.1.1 Stand-alone HMDs
- 5.1.1.2 Tethered HMDs
- 5.1.1.3 Screenless Viewers
- 5.1.2 Software
- 5.1.1 Hardware
- 5.2 By Core Technology
- 5.2.1 OLED / Micro-OLED
- 5.2.2 MicroLED
- 5.2.3 Waveguide and Diffractive Optics
- 5.2.4 Liquid-Crystal-on-Silicon (LCOS)
- 5.3 By Application
- 5.3.1 Remote Assistance and Maintenance
- 5.3.2 Product Visualisation and Configuration
- 5.3.3 Navigation and Mapping
- 5.3.4 Social and Communication Filters
- 5.3.5 Other Applications
- 5.4 By End-user Vertical
- 5.4.1 Gaming and Entertainment
- 5.4.2 Education
- 5.4.3 Healthcare
- 5.4.4 Retail
- 5.4.5 Automotive and Transportation
- 5.4.6 Other End-User Verticals
- 5.5 By Geography
- 5.5.1 North America
- 5.5.1.1 United States
- 5.5.1.2 Canada
- 5.5.1.3 Mexico
- 5.5.2 Europe
- 5.5.2.1 Germany
- 5.5.2.2 United Kingdom
- 5.5.2.3 France
- 5.5.2.4 Italy
- 5.5.2.5 Spain
- 5.5.2.6 Rest of Europe
- 5.5.3 Asia-Pacific
- 5.5.3.1 China
- 5.5.3.2 Japan
- 5.5.3.3 India
- 5.5.3.4 South Korea
- 5.5.3.5 Australia
- 5.5.3.6 Rest of Asia-Pacific
- 5.5.4 South America
- 5.5.4.1 Brazil
- 5.5.4.2 Argentina
- 5.5.4.3 Rest of South America
- 5.5.5 Middle East and Africa
- 5.5.5.1 Middle East
- 5.5.5.1.1 Saudi Arabia
- 5.5.5.1.2 United Arab Emirates
- 5.5.5.1.3 Turkey
- 5.5.5.1.4 Rest of Middle East
- 5.5.5.2 Africa
- 5.5.5.2.1 South Africa
- 5.5.5.2.2 Egypt
- 5.5.5.2.3 Nigeria
- 5.5.5.2.4 Rest of Africa
- 5.5.1 North America
6 COMPETITIVE LANDSCAPE
- 6.1 Market Concentration
- 6.2 Strategic Moves
- 6.3 Market Share Analysis
- 6.4 Company Profiles (includes Global level Overview, Market level overview, Core Segments, Financials as available, Strategic Information, Market Rank/Share for key companies, Products and Services, and Recent Developments)
- 6.4.1 Microsoft Corporation
- 6.4.2 Google LLC (Alphabet)
- 6.4.3 Meta Platforms Inc.
- 6.4.4 Apple Inc.
- 6.4.5 Snap Inc.
- 6.4.6 Niantic Inc.
- 6.4.7 PTC Inc.
- 6.4.8 Vuzix Corporation
- 6.4.9 Magic Leap Inc.
- 6.4.10 Seiko Epson Corporation
- 6.4.11 RealWear Inc.
- 6.4.12 Lenovo Group Ltd.
- 6.4.13 Fujitsu Ltd.
- 6.4.14 Kopin Corporation
- 6.4.15 Qualcomm Technologies Inc.
- 6.4.16 Unity Technologies
- 6.4.17 Dynabook Europe GmbH
- 6.4.18 Optinvent SA
- 6.4.19 Immersion Corporation
7 MARKET OPPORTUNITIES AND FUTURE OUTLOOK
- 7.1 White-space and Unmet-need Assessment
