
|
시장보고서
상품코드
1850127
청량음료 포장 시장 : 점유율 분석, 산업 동향 & 통계, 성장 예측(2025-2030년)Soft Drinks Packaging - Market Share Analysis, Industry Trends & Statistics, Growth Forecasts (2025 - 2030) |
||||||
청량음료 포장 시장은 2025년에 1,651억 달러, 2030년에는 2,146억 달러에 이르고, CAGR 5.4%로 성장할 것으로 예상됩니다.
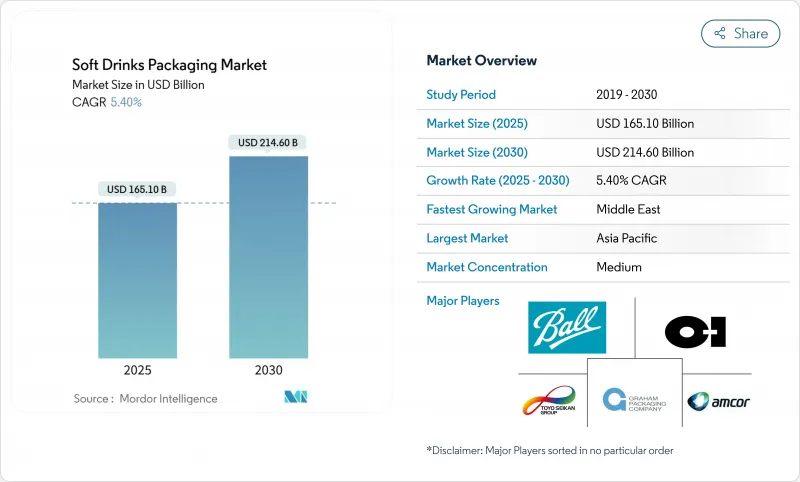
이 성장은 재활용 가능성에 대한 규제 요구가 증가하고, 프리미엄에서 커넥티드 팩에 브랜드 투자가 가속화되고, 화학 재활용 자산의 급속한 스케일 업을 반영합니다. 유럽연합(EU)이 2030년까지 PET병의 리사이클율을 30%로 할 것을 의무화하는 등 규제가 강화됨에 따라 rPET의 생산능력 확대에 박차가 가해지는 동시에 각 포맷으로 디자인의 재검토가 강요되고 있습니다. 브랜드는 또한 이산화탄소 배출량을 줄이는 경량 병과 바이오 폴리머로 축발을 옮기고 있으며, 이 시프트는 분량이 관리되고 외형이 특징적인 팩을 선호하는 Z세대의 기호에 의해 강해지고 있습니다. 한편, 84억 달러를 투자한 암코와 베리 세계 거래와 같은 합병은 규모 이코노미와 혁신 파이프라인을 확보하려고 경쟁하는 업계를 부각하고 있습니다. 지역별로는 아시아태평양의 도시화하는 중산계급이 수요의 중심이 되고 있으며, 중동은 정부가 음료의 현지 생산을 장려하는 가운데 가장 급성장하고 있습니다.
세계 청량음료 포장 시장 동향과 통찰
PET 병의 경량화와 rPET 통합의 급증
규제 목표와 비용 압력이 컨버터에 수지 사용량 삭감을 강요하고 있으며, 일본의 PET 병 중에는 종래의 절반의 중량인 20g을 자르는 것도 나오고 있습니다. 인도의 Ganesha Ecopet은 2026년까지 지역 병 폐기물의 25%를 회수하기 위해 4만 2,000톤의 rPET로 규모를 확대하려고 합니다. 경량화에 의해 재료비는 15-20% 삭감되고, 수송시의 배출량도 삭감되지만, 유통기한을 넘어 맛을 지키기 위해서 뛰어난 산소와 CO2 배리어성이 요구됩니다.
프리미엄 팩을 요구하는 '기능성 소다' SKU의 성장
세계의 기능성 음료 매출은 2026년까지 1,981억 달러에 달할 전망이며, 건강 증명과 성분의 스토리텔링을 가능하게 하는 팩이 요구되고 있습니다. Z세대는 이미 카테고리 확대의 38%를 견인하고 있으며, 투명성을 중시하고 있기 때문에 펩시코는 20-30% 높은 패키징 비용을 정당화하는 온팩 내러티브를 통합하도록 촉구하고 있습니다. 금속 캔은 차광성과 뛰어난 가스 배리어성으로 보존료 없이 활성 화합물을 보호하고 보존 안정성을 유지하며 프리미엄 단서를 제공함으로써 지지를 얻고 있습니다.
확대 생산자 책임(EPR) 요금이 마진을 압박
미국의 5개 주가 EPR법을 제정하고 2031년까지 커브사이드 재활용에 드는 비용의 90%를 생산자에게 전가하는 것을 정하고 있습니다. 디자인 재활용 가능성에 연동된 환경 조정 요금은 포장비를 2-3% 밀어 올려 음료 마진을 압박할 가능성이 있습니다. 여러 국가의 PRO에 대응하는 것은 관리 부담과 규정 준수 위반의 벌칙 위험을 증가시킵니다.
부문 분석
2024년 매출은 PET 병과 rPET 병이 71%를 차지했고 수십년에 걸친 비용, 투명성, 라인 적합성의 조정을 반영하고 있습니다. PET의 청량음료 포장 시장 규모는 2025년 1,172억 달러에 해당하며, 식품급 rPET공급이 개선됨에 따라 한 자릿수 중반의 안정적인 확대가 예상됩니다. 아반튬 PEF와 다니머 PHA 파이프라인은 바이오플라스틱 CAGR17.4%를 지원합니다.
변화하는 브랜드 목표, 넷 제로 서약, 재활용 함량 할당은 가격에 민감한 시장에서도 rPET의 도입을 앞당기고 있으며, 인도에서는 2025년까지 30%의 PCR이 의무화되고 있습니다. 알루미늄 캔은 무한히 재활용 가능하며 유럽의 재활용률은 76.1%라는 이점이 있지만 불안정한 프리미엄이 컨버터의 마진을 압박하고 있습니다. 유리는 공예품 라인에서 높은 평가를 받고 있지만 물류면에서는 불리하며, 판지는 금지가 다가오기 전에 PFAS 코팅의 대체물로 분주하고 있습니다.
병은 정착한 블로우 성형 플릿, 폭넓은 SKU 사이즈, 랩 라벨 용지에 의해 2024년 매출의 59%를 차지합니다. 병의 청량 음료 포장 시장 규모는 장벽 기술 혁신에 의한 프리폼의 경량화를 도와주며, 2030년에는 1,220억 달러 이상에 달할 것으로 예측되고 있습니다. 그러나 슬림한 알루미늄 캔은 CAGR 8.9%로 급성장하고 있으며, 이것은 GEN-Z가 용량보다 휴대성과 인스타 감성하는 실루엣을 중시하고 있기 때문입니다.
소매업체는 이 형식의 선반 효율성을 받아들이고, 브랜드는 동일한 충전량으로 최대 20%의 가격 상승을 획득했습니다. 테트라팩이 식물 유래의 HDPE 캡으로 시프트하는 가운데, 칠드 주스의 통로에서는 카톤이 쉐어를 확대. 작은 가방은 신흥 시장에서 여전히 중요하며 환경세가 다가오고 있음에도 불구하고 초저비용 진입점을 제공합니다.
지역 분석
아시아태평양의 매출 점유율 43%는 중간층 구매력 급상승, 도시 소매점 밀집, 저비용 rPET 루프를 촉진하는 소비자 사용 후 PET 회수 시스템의 충실로 인해 발생하고 있습니다. 일본은 90%의 PET 회수율로 국내 컨버터에 공급하고 있으며, 중국은 재활용률의 야심적인 목표를 달성하기 위해 화학 재활용 허브에 보조금을 내고 있습니다. 인도의 EPR 로드맵은 병급 rPET에 대한 수요를 강화하고, 이 지역을 순환 경제 규모의 선구자로 자리잡고 있습니다.
사우디아라비아와 아랍에미리트(UAE)이 식량 안보 과제를 추구하고 캔 시트의 현지 압연 라인과 식음료 플랜트의 건설을 급피치로 진행하고 있기 때문에 중동의 2030년까지의 CAGR은 최고의 7.1%를 기록할 전망입니다. 청소년층은 정교한 통조림 에너지 음료를 선호하며, 세계적인 알루미늄 가격 변동에도 불구하고 금속 수요가 강화됩니다. 지속 가능한 산업 클러스터에 대한 정부의 우대 조치는 걸프 협력 회의 충전 라인에서 rPET 프리폼을 채택하는 데 더욱 박차를 가합니다.
북미는 EPR에 의한 비용 상승의 역풍과 알루미늄판의 수급 핍박과 격투하고 있지만, 신규 SKU의 타임라인을 단축하는 AI 주도의 설계 소프트웨어의 선행 상업 시험으로부터 이익을 얻고 있습니다. PPWR의 재활용 의무화는 단일 소재의 유연한 필름과 고급 해중합에 대한 투자를 촉진합니다. 남미는 브라질의 ALPLA HDPE 재활용 플랜트의 신설과 도시의 밀레니얼 세대에서 기능성 음료의 소비 확대로 꾸준한 이익을 확보하고 있습니다. 아프리카는 아직 시작되었지만 도시의 스프롤화와 콜드체인 물류의 확대를 배경으로 두 자리 수량 성장을 기록하고 있습니다.
기타 혜택 :
- 엑셀 형식 시장 예측(ME) 시트
- 3개월간의 애널리스트 서포트
목차
제1장 서론
- 조사의 전제조건과 시장의 정의
- 조사 범위
제2장 조사 방법
제3장 주요 요약
제4장 시장 상황
- 시장 개요
- 시장 성장 촉진요인
- PET병의 경량화와 rPET의 통합의 급증
- 프리미엄 팩을 요구하는 「기능성 소다」SKU의 성장
- Z세대 소비자의 이동 중 슬림 캔 수요
- 보틀-투-보틀 화학적 재활용 설비(용량) 증설
- AI 대응 설계 플랫폼이 패키지 개발의 리드 타임을 단축
- 카본 네거티브 PEF와 PHA의 파일럿이 상업 규모에 도달
- 시장 성장 억제요인
- 확대 생산자 책임(EPR) 요금이 이익률을 압박
- 알루미늄 가격 변동과 공급 병목
- PFAS 단계적 퇴출로 인한 배리어 코팅 지류(지기) 제품의 혼란
- 소매업체에 의한 일회용 2차 플라스틱의 금지
- 규제 상황
- 기술의 전망
- Porter's Five Forces 분석
- 신규 참가업체의 위협
- 공급기업의 협상력
- 구매자의 협상력
- 대체품의 위협
- 경쟁 기업간 경쟁 관계
- 투자분석(설비투자와 Manda의 동향)
제5장 시장 규모와 성장 예측
- 재료별
- 플라스틱(PET, rPET, HDPE, 바이오플라스틱)
- 금속(알루미늄, 스틸)
- 유리
- 종이 및 판지
- 연질 및 퇴비화 가능한 필름
- 제품 유형별
- 병
- 캔
- 상자 및 무균 벽돌
- 파우치 및 주머니
- 백 인 박스 / 디스펜싱 팩
- 용량별
- 250ml 미만
- 251-600ml
- 601ml-1 L
- 1L 이상의 패밀리 팩
- 클로저 유형별
- 스크류 캡과 스포츠 캡
- 크라운과 풀 탭
- 스냅 온/프레스 피트
- 스마트/커넥티드 클로저
- 청량음료 카테고리별
- 탄산음료
- 주스와 넥타
- 에너지와 기능성 음료
- RTD 차와 커피
- 풍미 워터와 스파클링 워터
- 지역별
- 북미
- 미국
- 캐나다
- 멕시코
- 남미
- 브라질
- 아르헨티나
- 기타 남미
- 유럽
- 독일
- 영국
- 프랑스
- 이탈리아
- 스페인
- 기타 유럽
- 아시아태평양
- 중국
- 일본
- 인도
- 한국
- 호주
- 기타 아시아태평양
- 중동
- 이스라엘
- 사우디아라비아
- 아랍에미리트(UAE)
- 튀르키예
- 기타 중동
- 아프리카
- 남아프리카
- 이집트
- 기타 아프리카
- 북미
제6장 경쟁 구도
- 시장 집중도
- 전략적 동향
- 시장 점유율 분석
- 기업 프로파일
- Amcor PLC
- Ball Corporation
- Tetra Pak International SA
- Crown Holdings Inc.
- Toyo Seikan Group Holdings Ltd
- Owens-Illinois Inc.
- Graham Packaging Company
- Ardagh Group SA
- CAN-PACK SA
- Refresco Group NV
- CKS Packaging Inc.
- Pacific Can China Holdings
- Berry Global Group Inc.
- Silgan Holdings Inc.
- Huhtamaki Oyj
- Mondi plc
- WestRock Company
- Plastipak Holdings Inc.
- UFlex Ltd.
- Nihon Yamamura Glass Co. Ltd
- Vetropack Holding AG
- Visy Industries
제7장 시장 기회와 장래의 전망
SHW 25.11.17The soft drink packaging market generated USD 165.1 billion in 2025 and is projected to reach USD 214.6 billion by 2030, advancing at a 5.4% CAGR.
Growth reflects rising regulatory demands for recyclability, accelerating brand investments in premium, connected packs, and rapid scale-up of chemical recycling assets. Stricter mandates-such as the European Union's requirement for 30% recycled content in PET bottles by 2030-are forcing redesigns across formats while spurring rPET capacity expansion. Brands are also pivoting toward lightweight bottles and bio-based polymers that lower carbon footprints, a shift intensified by Gen-Z preferences for portion-controlled, visually distinctive packs. Meanwhile, mergers such as the USD 8.4 billion Amcor-Berry Global deal highlight an industry racing to secure scale economies and innovation pipelines. Across regions, Asia-Pacific's urbanizing middle class anchors demand, and the Middle East posts the fastest growth as governments court local beverage production.
Global Soft Drinks Packaging Market Trends and Insights
Surge in PET bottle lightweighting and rPET integration
Regulatory targets and cost pressure are pushing converters to cut resin use, with some Japanese PET bottles now below 20 g-half the traditional weight. High collection rates-90% in Japan versus 75% in Europe-underpin closed-loop economics, while India's Ganesha Ecopet is scaling to 42,000 t rPET to capture 25% of local bottle waste by 2026. Lightweighting trims material cost 15-20% and lowers freight emissions, but demands superior oxygen and CO2 barriers to safeguard taste over shelf life.
Growth of "functional soda" SKUs demanding premium packs
Global functional beverage sales headed toward USD 198.1 billion by 2026 are forcing packs that signal health credentials and enable ingredient storytelling. Gen-Z already drives 38% of category expansion and values transparency, prompting PepsiCo to embed on-pack narratives that justify 20-30% higher packaging spend. Metal cans win favor for their light-blocking and superior gas barriers that protect active compounds without preservatives, sustaining shelf stability and delivering premium cues.
Extended Producer-Responsibility (EPR) fees squeezing margins
Five U.S. states have enacted EPR laws that shift 90% of curbside recycling costs to producers by 2031. Eco-modulated charges tied to design recyclability can push packaging spend up 2-3%, compressing beverage margins while firms retool to lighter, mono-material formats. Navigating multiple state PROs adds administrative load and penalty risk for non-compliance.
Other drivers and restraints analyzed in the detailed report include:
- On-the-go slim-can demand from Gen-Z consumers
- Bottle-to-bottle chemical recycling capacity build-out
- Volatile aluminium premiums and supply bottlenecks
For complete list of drivers and restraints, kindly check the Table Of Contents.
Segment Analysis
PET and rPET bottles dominated with 71% revenue in 2024, reflecting a decades-long alignment of cost, clarity, and line compatibility. The soft drink packaging market size for PET equated to USD 117.2 billion in 2025 and is set for stable mid-single-digit expansion as the supply of food-grade rPET improves. Avantium's PEF and Danimer's PHA pipelines underpin a 17.4% CAGR for bioplastics, a niche today but one poised to carve premium categories with superior barrier metrics and lower cradle-to-grave footprints.
Shifting brand targets, net-zero pledges, and recycled-content quotas are hastening rPET uptake even in price-sensitive markets, with India mandating 30% PCR by 2025. Aluminium cans benefit from infinite recyclability and a 76.1% European recycling rate, yet volatile premiums dent converter margins. Glass retains cachet in craft lines but carries logistics penalties, while paperboard innovators scramble to replace PFAS coatings before looming bans take hold.
Bottles commanded 59% of 2024 sales thanks to entrenched blow-molding fleets, broad SKU sizes, and wrap-label real estate. The soft drink packaging market size for bottles is forecast to cross USD 122 billion by 2030, aided by barrier innovations allowing lower-weight preforms. Slim aluminum cans, however, are surging at 8.9% CAGR as Gen-Z ranks portability and Instagram-ready silhouettes above volume.
Retailers embrace the format's shelf efficiencies, and brands glean up to 20% price uplifts on identical fill volumes. Cartons gain share in chilled juice aisles as Tetra Pak shifts to plant-derived HDPE caps. Sachets remain vital in emerging markets, delivering ultra-low-cost entry points even as eco-taxes loom.
The Soft Drinks Packaging Market Report Segments the Industry Into by Material (Plastic, Metal, Glass and More), Product Type (Bottle, Can, Cartons and Boxes), Capacity (Less Than 250 Ml, 251-600 Ml and More), Closure Type (Screw and Sports Caps, Crown and Pull-Tab and More), Soft-Drink Category (Carbonated Soft Drinks, Juices and Nectars and More) and Geography. The Market Forecasts are Provided in Terms of Value (USD).
Geography Analysis
Asia-Pacific's 43% revenue share stems from surging middle-class purchasing power, dense urban retail, and robust post-consumer PET recovery systems that fuel low-cost rPET loops. Japan's 90% PET collection rate supplies domestic converters, while China subsidizes chemical recycling hubs to beat ambitious recycled-content goals. India's EPR roadmap intensifies demand for bottle-grade rPET, positioning the region as a bellwether for circular-economy scale-up.
The Middle East posts the highest 7.1% CAGR to 2030 as Saudi Arabia and the UAE fast-track local can-sheet rolling lines and beverage plants in pursuit of food-security agendas. Youthful demographics gravitate to energy drinks packaged in sleek cans, reinforcing metal demand despite global aluminium price swings. Government incentives for sustainable industry clusters further spur adoption of rPET preforms in Gulf Cooperation Council filling lines.
North America wrestles with EPR-induced cost headwinds and aluminium sheet tightness, yet benefits from first-mover commercial trials of AI-driven design software that cuts new-SKU timelines. Europe continues to set the regulatory pace: the PPWR's recyclability mandates catalyze investment in mono-material flexible films and advanced depolymerization. South America secures steady gains through Brazil's new ALPLA HDPE recycling plant and rising consumption of functional drinks among urban millennials. Africa, still nascent, observes double-digit volume growth on the back of urban sprawl and expanding cold-chain logistics, though inadequate collection infrastructure tempers rPET uptake.
- Amcor PLC
- Ball Corporation
- Tetra Pak International SA
- Crown Holdings Inc.
- Toyo Seikan Group Holdings Ltd
- Owens-Illinois Inc.
- Graham Packaging Company
- Ardagh Group SA
- CAN-PACK SA
- Refresco Group NV
- CKS Packaging Inc.
- Pacific Can China Holdings
- Berry Global Group Inc.
- Silgan Holdings Inc.
- Huhtamaki Oyj
- Mondi plc
- WestRock Company
- Plastipak Holdings Inc.
- UFlex Ltd.
- Nihon Yamamura Glass Co. Ltd
- Vetropack Holding AG
- Visy Industries
Additional Benefits:
- The market estimate (ME) sheet in Excel format
- 3 months of analyst support
TABLE OF CONTENTS
1 INTRODUCTION
- 1.1 Study Assumptions and Market Definition
- 1.2 Scope of the Study
2 RESEARCH METHODOLOGY
3 EXECUTIVE SUMMARY
4 MARKET LANDSCAPE
- 4.1 Market Overview
- 4.2 Market Drivers
- 4.2.1 Surge in PET bottle lightweighting and rPET integration
- 4.2.2 Growth of "functional soda" SKUs demanding premium packs
- 4.2.3 On-the-go slim-can demand from Gen-Z consumers
- 4.2.4 Bottle-to-bottle chemical recycling capacity build-out
- 4.2.5 AI-enabled design platforms cutting packaging development lead-times
- 4.2.6 Carbon-negative PEF and PHA pilots reaching commercial scale
- 4.3 Market Restraints
- 4.3.1 Extended Producer-Responsibility (EPR) fees squeezing margins
- 4.3.2 Volatile aluminium premiums and supply bottlenecks
- 4.3.3 PFAS phase-outs disrupting barrier-coated paperboard
- 4.3.4 Retailer bans on single-use secondary plastics
- 4.4 Regulatory Landscape
- 4.5 Technological Outlook
- 4.6 Porter's Five Forces Analysis
- 4.6.1 Threat of New Entrants
- 4.6.2 Bargaining Power of Suppliers
- 4.6.3 Bargaining Power of Buyers
- 4.6.4 Threat of Substitutes
- 4.6.5 Competitive Rivalry
- 4.7 Investment Analysis (CapEx and MandA Trends)
5 MARKET SIZE AND GROWTH FORECASTS (VALUES)
- 5.1 By Material
- 5.1.1 Plastic (PET, rPET, HDPE, Bioplastics)
- 5.1.2 Metal (Aluminium, Steel)
- 5.1.3 Glass
- 5.1.4 Paper and Paperboard
- 5.1.5 Flexible and Compostable Films
- 5.2 By Product Type
- 5.2.1 Bottles
- 5.2.2 Cans
- 5.2.3 Cartons and Aseptic Bricks
- 5.2.4 Pouches and Sachets
- 5.2.5 Bag-in-Box / Dispense Packs
- 5.3 By Capacity
- 5.3.1 Less Than 250 ml
- 5.3.2 251-600 ml
- 5.3.3 601-1 L
- 5.3.4 More Than 1 L Family Packs
- 5.4 By Closure Type
- 5.4.1 Screw and Sports Caps
- 5.4.2 Crown and Pull-tab
- 5.4.3 Snap-on / Press-fit
- 5.4.4 Smart / Connected Closures
- 5.5 By Soft-Drink Category
- 5.5.1 Carbonated Soft Drinks
- 5.5.2 Juices and Nectars
- 5.5.3 Energy and Functional Drinks
- 5.5.4 RTD Tea and Coffee
- 5.5.5 Flavoured and Sparkling Water
- 5.6 By Geography
- 5.6.1 North America
- 5.6.1.1 United States
- 5.6.1.2 Canada
- 5.6.1.3 Mexico
- 5.6.2 South America
- 5.6.2.1 Brazil
- 5.6.2.2 Argentina
- 5.6.2.3 Rest of South America
- 5.6.3 Europe
- 5.6.3.1 Germany
- 5.6.3.2 United Kingdom
- 5.6.3.3 France
- 5.6.3.4 Italy
- 5.6.3.5 Spain
- 5.6.3.6 Rest of Europe
- 5.6.4 Asia-Pacific
- 5.6.4.1 China
- 5.6.4.2 Japan
- 5.6.4.3 India
- 5.6.4.4 South Korea
- 5.6.4.5 Australia
- 5.6.4.6 Rest of Asia-Pacific
- 5.6.5 Middle East
- 5.6.5.1 Israel
- 5.6.5.2 Saudi Arabia
- 5.6.5.3 United Arab Emirates
- 5.6.5.4 Turkey
- 5.6.5.5 Rest of Middle East
- 5.6.6 Africa
- 5.6.6.1 South Africa
- 5.6.6.2 Egypt
- 5.6.6.3 Rest of Africa
- 5.6.1 North America
6 COMPETITIVE LANDSCAPE
- 6.1 Market Concentration
- 6.2 Strategic Moves
- 6.3 Market Share Analysis
- 6.4 Company Profiles (includes Global level Overview, Market level Overview, Core Segments, Financials as available, Strategic Information, Market Rank/Share, Products and Services, Recent Developments)
- 6.4.1 Amcor PLC
- 6.4.2 Ball Corporation
- 6.4.3 Tetra Pak International SA
- 6.4.4 Crown Holdings Inc.
- 6.4.5 Toyo Seikan Group Holdings Ltd
- 6.4.6 Owens-Illinois Inc.
- 6.4.7 Graham Packaging Company
- 6.4.8 Ardagh Group SA
- 6.4.9 CAN-PACK SA
- 6.4.10 Refresco Group NV
- 6.4.11 CKS Packaging Inc.
- 6.4.12 Pacific Can China Holdings
- 6.4.13 Berry Global Group Inc.
- 6.4.14 Silgan Holdings Inc.
- 6.4.15 Huhtamaki Oyj
- 6.4.16 Mondi plc
- 6.4.17 WestRock Company
- 6.4.18 Plastipak Holdings Inc.
- 6.4.19 UFlex Ltd.
- 6.4.20 Nihon Yamamura Glass Co. Ltd
- 6.4.21 Vetropack Holding AG
- 6.4.22 Visy Industries
7 MARKET OPPORTUNITIES AND FUTURE OUTLOOK
- 7.1 White-space and Unmet-Need Assessment
