


|
시장보고서
상품코드
1850192
데이터센터 랙 시장 : 점유율 분석, 산업 동향, 통계, 성장 예측(2025-2030년)Data Center Rack - Market Share Analysis, Industry Trends & Statistics, Growth Forecasts (2025 - 2030) |
||||||
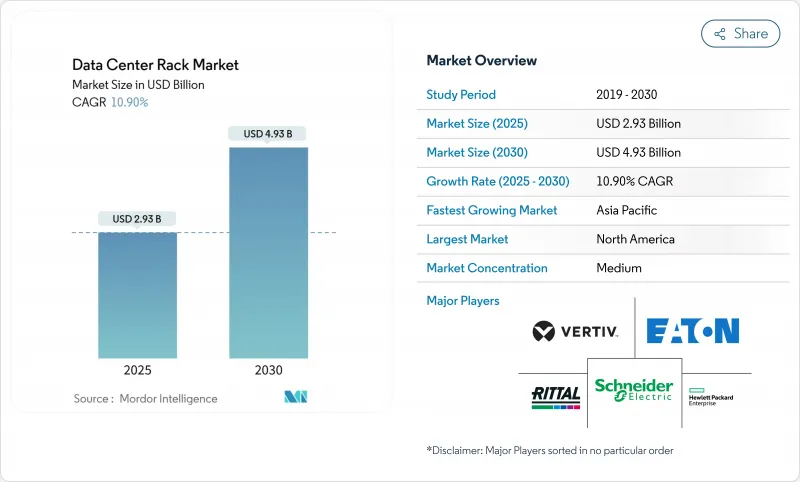
데이터센터 랙 세계 시장 규모는 2025년 29억 3,000만 달러, 2030년에는 49억 3,000만 달러에 이르고, CAGR은 10.9%를 나타낼 전망입니다.
데이터센터 랙 시장이 확대되고 있는 이유는 하이퍼스케일 운영자, 클라우드 서비스 제공업체, 에지 배치가 40kW 이상의 부하를 지원하는 랙 레벨 액체 냉각 및 전력 공급 시스템을 표준화하고 있기 때문입니다. 운영자는 랙 인프라를 인공지능(AI) 워크로드, 고성능 컴퓨팅 클러스터 및 대기 시간에 민감한 에지 노드의 물리적 기반으로 간주합니다. 기업이 열 관리를 개선하면서 컴퓨팅 밀도를 극대화하려고 하기 때문에 키가 큰 48U 구성, 캐비닛 스타일의 저장, 액체 대응 구조 설계가 주류가 되고 있습니다. 소블린 AI, 신재생에너지 설비, 에너지 효율 규제 강화를 위한 지역 전체의 전환은 규제, 지속가능성, 보수성 목표를 충족할 수 있는 고급 랙 솔루션에 대한 수요를 더욱 강화하고 있습니다.
세계 데이터센터 랙 시장 동향 및 통찰
하이퍼스케일과 코로케이션 구축의 급증
2025년 미국의 하이퍼스케일 설비 투자액은 270억 달러를 넘어 전년 대비 69% 증가하여 데이터센터 건설이 가장 급속히 확대되고 있는 비주택 분야임을 뒷받침하고 있습니다. 개별 GPU 클러스터는 현재 랙당 10-140kW를 요구하고 있으며, 사업자는 기존의 에어 핸들링이 아니라 액체 매니폴드를 중심으로 화이트 스페이스 레이아웃을 재설계할 필요가 있습니다. 디지털 리얼티와 같은 코로케이션 리더는 캐비닛당 70kW를 유지하는 AI 지원 스위트를 도입하여 프리미엄 랙 인프라가 경쟁적 차별화 요인임을 보여줍니다. 공냉 홀의 리노베이션 비용은 신설 예산을 능가할 수 있기 때문에 이러한 확장은 캐비닛 클래스 랙에 대한 다년간의 주문 사이클을 촉진합니다. 이 동향은 또한 하이퍼스케일러가 교육 및 추론 환경의 관리를 유지하기 위해 시설을 소유하는 방향으로 이동하고 있음을 보여줍니다.
클라우드와 에지 보급이 랙 수요를 끌어올립니다.
기업은 공장, 창고 및 소매점 옆에 컴퓨팅 노드를 설치하고 있으며 공급업체는 견고한 랙을 설계해야 합니다. 페덱스는 Dell과 스위치의 협업을 통해 내진동 인클로저와 원격 관리 PDU가 필요한 물류 허브에 에지 모듈을 배치했습니다. Etisalat과 같은 통신 사업자는 거리 가구에 설치된 밀폐 캐비닛에 장착되는 컴팩트한 에지 서버를 배포하고 있으며 5G가 기존 데이터 플로어를 넘어 랙의 폼 팩터를 끌어 올린다는 것을 보여줍니다. 3M과 같은 제조업은 Azure SQL Edge를 산업층에서 활용하여 먼지와 온도 변화를 견디는 NEMA 규격의 랙을 요구하고 있습니다. 결과적으로 데이터센터 랙 시장은 수천 개의 분산 사이트에 적합한 사전 통합형 모듈식 솔루션을 제공하는 부문으로 가속화되고 있습니다.
에너지 효율 규제(EU 행동규범/ASHRAE)
EU의 에너지 효율 지령 개정으로 100kW를 초과하는 IT 부하는 시설에 대해 연간 보고가 의무화되었으며, PUE가 1.03으로 낮은 액냉에 대한 인센티브가 갖추어졌습니다. ASHRAE는 허용 흡기 온도를 확장하고 랙이 기류 밀폐를 유지할 때 냉각기를 사용하지 않는 이코노마이저 모드를 허용했습니다. 독일의 에너지 효율화 방법은 데이터센터에 폐열 재사용을 의무화하고 있으며 고품질의 열 에너지를 지역 난방 루프로 전달할 수 있는 리어 도어식 액체 냉각기를 권장합니다. 적합성 랙을 통합하는 공급업체는 운영자가 정보 공개 마감일에 맞추려고 경쟁하는 동안 조달 주기를 가속화합니다.
부문 분석
풀랙은 2024년에 데이터센터 랙 시장의 57.4%를 차지했고, 2030년까지의 CAGR은 12.9%를 나타낼 전망입니다. 이 점유율은 데이터센터 랙 시장 규모의 압도적인 부분에 해당하며, 케이블 배선, 공기 흐름, PDU 표준화를 간소화하는 42U 실적를 하이퍼스케일러가 선호하는 것을 반영합니다. AI 클러스터에서는 PCIe와 NVLink의 상호 연결이 광범위하게 요구되므로 100Gbps 이상의 신호 무결성을 유지하는 깨끗한 케이블 배선에는 전체 랙이 필수적입니다. 레트로 핏 홀에서 기존의 콜드 아일 형상에 맞추면 더 큰 프레임이 바닥 타일 재구성 비용을 최소화합니다.
액체 냉각은 키가 큰 수직 공간이 냉각수 공급과 환류 분리를 용이하게 하기 때문에 풀 랙의 장점을 확장합니다. 슈나이더 일렉트릭의 GB200 NVL72 설계도는 42U 서버 영역 아래에 위치한 맞춤형 매니폴드로 전체 랙당 132kW를 달성합니다. 이와 같이 데이터센터 랙 시장에서는 공장에서 통합된 냉각수 루프, 리던던트 펌프, 퀵 디스커넥트 커플링을 전체 높이 캐비닛에 미리 통합한 벤더가 평가되고 있습니다. 하프랙과 쿼터 랙은 여전히 에지 옷장과 네트워크 룸에서 사용되고 있지만, 이러한 환경에서는 고급 GPU 클러스터가 필요하지 않기 때문에 CAGR이 저하되고 있습니다.
2024년 매출 점유율은 42U 프레임이 53.7%를 차지했지만, 48U 모델은 2030년까지 CAGR 12.1%로 가장 급성장할 전망입니다. 사업자는 서버 슬롯을 희생하지 않고 액체 매니폴드, 버스웨이, 탑 오브 랙 스위치 등을 수용할 수 있는 6U의 여유를 평가했습니다. 높이가 늘어나 통로 수가 줄어들어 대규모 홀에서는 최대 12%의 바닥 면적 삭감이 가능합니다. 또한 키가 큰 프레임은 캐스터의 무게 배분의 균형을 맞출 수 있으며 냉각수가 추가되면 캐비닛이 1,500kg을 초과 할 때 중요합니다.
리탈의 VX IT 라인은 42U 및 48U 프레임을 공통 레일에 혼합할 수 있어 예산 주기에 맞는 단계적 전환을 용이하게 합니다. 52U와 54U의 사용자 정의 모델은 수직 공간에 여유있는 천장이 높은 창고에 설치되어 있지만 채택은 여전히 틈새 시장입니다. 액체 냉각이 밀도의 상한을 밀어 올리는 동안, 데이터센터 랙 시장은 48U를 레거시와의 호환성과 미래를 바라본 용량의 스위트 스폿으로 간주하고 있습니다.
데이터센터 랙 시장은 랙 크기(쿼토리 랙, 하프랙, 풀 랙), 랙 높이(42U, 45U, 기타), 랙 유형(캐비닛(닫힌) 랙, 오픈 프레임 랙, 벽 장착 랙 c), 데이터센터 유형(코로케이션 시설, 하이퍼스케일 및 클라우드 서비스 제공업체의 DC, 엔터프라이즈 및 에지), 소재(스틸, 알루미늄, 기타 합금 및 복합재), 지역별로 분류됩니다. 시장 예측은 금액(달러)으로 제공됩니다.
지역별 분석
북미는 깊은 하이퍼스케일 생태계, 확립된 공급망, 명확한 규제로 2024년 매출의 32.6%를 차지했습니다. 미국에서는 2025년에 데이터센터의 설비 투자가 270억 달러를 넘었지만 버지니아 북부와 실리콘 밸리에서는 유틸리티 혼잡이 성장을 억제하고 있습니다. 캐나다에서는 수력 발전을 활용한 지속가능성 중시의 구축이 가속화되고, 멕시코에서는 미국의 레이턴시 목표를 지원하는 니어쇼어링 엣지 노드가 유치됩니다. 슈나이더 일렉트릭의 1억 4,000만 달러를 투자한 테네시의 개폐장치 공장 등 현지 제조업의 확장은 공급업체가 관세의 역풍을 피하는 데 도움이 됩니다.
아시아태평양은 CAGR 13.2%로 데이터센터 랙 시장에서 가장 빠릅니다. 중국은 정부계 AI 펀드를 대규모 GPU 기지에 투입하고, 인도는 디지털 서비스 붐으로 Tier2 도시에 5-20MW 캠퍼스를 건설하고, 일본은 공장 자동화를 위해 엣지 클러스터를 지원하고 있습니다. 지역 제조 허브는 랙의 물류 리드 타임을 단축하지만 구리 부족은 비용 변동에 영향을 미칩니다. Vertiv이 장착한 iGenius AI 센터와 같은 프로젝트는 국내 공급 생태계가 지역별 컴퓨팅 수요에 부응하는 방법을 보여줍니다.
기타 혜택 :
- 엑셀 형식 시장 예측(ME) 시트
- 3개월간의 애널리스트 서포트
목차
제1장 서론
- 조사의 전제조건과 시장의 정의
- 조사 범위
제2장 조사 방법
제3장 주요 요약
제4장 시장 상황
- 시장 개요
- 시장 성장 촉진요인
- 하이퍼스케일과 코로케이션의 구축이 급증
- 클라우드와 엣지의 도입 증가에 의해 랙 수요 증가
- 고밀도 서버 전개(랙당 40kW 이상)
- 에너지 효율 규제(EU 행동규범/ASHRAE)
- AI에 최적화된 액냉 랙 아키텍처
- 국내 랙 제조에 대한 국가의 인센티브
- 시장 성장 억제요인
- 고급 캐비닛에는 높은 선불 설비 투자
- 블레이드/서버 온칩 모듈의 이용 증가
- 주요 도시권에 있어서의 전력과 스페이스의 부족
- 특수강과 알루미늄공급변동
- 공급망 분석
- 규제 상황
- 기술의 전망
- Porter's Five Forces
- 공급기업의 협상력
- 구매자의 협상력
- 신규 참가업체의 위협
- 라이벌 관계의 격렬
- 대체품의 위협
- 시장의 거시 경제 요인 평가
제5장 시장 규모와 성장 예측
- 랙 사이즈별
- 쿼터 랙
- 하프락
- 풀 랙
- 랙 높이별
- 42U
- 45U
- 48U
- 기타 높이(52U 및 맞춤)
- 랙 유형별
- 캐비닛(밀폐형) 랙
- 오픈 프레임 랙
- 벽걸이 랙
- 데이터센터유형별
- 코로케이션 시설
- 하이퍼스케일 및 클라우드 서비스 제공업체의 DC
- 엔터프라이즈와 엣지
- 소재별
- 강철
- 알루미늄
- 기타 합금 및 복합재료
- 지역별
- 북미
- 미국
- 캐나다
- 멕시코
- 남미
- 브라질
- 아르헨티나
- 기타 남미
- 유럽
- 독일
- 영국
- 프랑스
- 이탈리아
- 스페인
- 러시아
- 기타 유럽
- 아시아태평양
- 중국
- 일본
- 인도
- 한국
- 호주 및 뉴질랜드
- 기타 아시아태평양
- 중동 및 아프리카
- 중동
- 사우디아라비아
- 아랍에미리트(UAE)
- 튀르키예
- 기타 중동
- 아프리카
- 남아프리카
- 나이지리아
- 기타 아프리카
- 북미
제6장 경쟁 구도
- 시장 집중도
- 전략적 동향
- 시장 점유율 분석
- 기업 프로파일
- Schneider Electric SE
- Vertiv Group Corp.
- Eaton Corp. plc
- Rittal GmbH and Co. KG
- Hewlett Packard Enterprise
- Dell Technologies Inc.
- Legrand SA
- IBM Corp.
- Chatsworth Products Inc.
- Panduit Corp.
- APC(by Schneider Electric)
- Tripp Lite(Eaton)
- Great Lakes Case and Cabinet
- Belkin International Inc.
- Kendall Howard LLC
- Martin International Enclosures
- Black Box Corp.
- Fujitsu Ltd.
- Oracle Corp.
- Cisco Systems Inc.
제7장 시장 기회와 장래의 전망
SHW 25.11.07The global data center rack market size is expected to reach USD 2.93 billion in 2025 and is forecast to climb to USD 4.93 billion by 2030, advancing at a robust 10.9% CAGR.
The data center rack market is expanding because hyperscale operators, cloud service providers, and edge deployments are standardizing on rack-level liquid cooling and power delivery systems that support loads above 40 kW. Operators view rack infrastructure as the physical foundation for artificial intelligence (AI) workloads, high-performance computing clusters, and latency-sensitive edge nodes. Taller 48U configurations, cabinet-style containment, and liquid-ready structural designs are becoming mainstream as companies seek to maximize compute density while improving thermal management. The region-wide pivot toward sovereign AI, renewable-powered facilities, and stricter energy-efficiency rules further intensifies demand for advanced rack solutions capable of meeting regulatory, sustainability, and serviceability targets.
Global Data Center Rack Market Trends and Insights
Hyperscale and Colocation Build-outs Surge
Hyperscale capital spending topped USD 27 billion in the United States during 2025, reflecting 69% year-over-year growth that cements data-center construction as the fastest-expanding non-residential segment. Individual GPU clusters now demand 10-140 kW per rack, pushing operators to redesign white-space layouts around liquid manifolds versus legacy air handling. Colocation leaders such as Digital Realty introduced AI-ready suites that sustain 70 kW per cabinet, signalling that premium rack infrastructure is a competitive differentiator. Because retrofit costs for air-cooled halls can eclipse new-build budgets, these expansions fuel multiyear ordering cycles for cabinet-class racks. The trend also illustrates hyperscalers' shift toward owning facilities to preserve control of training and inference environments.
Rising Cloud and Edge Adoption Boosts Rack Demand
Enterprises are placing compute nodes next to factories, warehouses, and retail stores, compelling vendors to engineer ruggedized racks. FedEx deployed edge modules inside logistics hubs through a Dell-Switch collaboration that requires vibration-resistant enclosures and remote-management PDUs. Telecom operators like Etisalat are rolling out compact edge servers that mount in sealed cabinets installed on street furniture, illustrating how 5G pushes rack form factors beyond traditional data floors. Manufacturers such as 3M leverage Azure SQL Edge on industrial shop floors, demanding NEMA-rated racks that tolerate dust and temperature swings. Consequently, the data center rack market accelerates in segments that supply pre-integrated, modular solutions suitable for thousands of distributed sites.
Energy-Efficiency Regulations (EU Code of Conduct / ASHRAE)
The European Union's revised Energy Efficiency Directive mandates yearly reporting for facilities over 100 kW IT load, aligning incentives toward liquid cooling that can achieve PUE as low as 1.03. ASHRAE widened allowable inlet temperatures, enabling chiller-less economiser modes when racks maintain tight airflow containment. Germany's Energy Efficiency Act compels data centers to reuse waste heat, favouring rear-door liquid coolers that can transfer high-grade thermal energy to district-heating loops. Vendors integrating compliant racks enjoy accelerated procurement cycles as operators race to meet disclosure deadlines.
Other drivers and restraints analyzed in the detailed report include:
- High-Density Server Deployment (Greater Than 40 kW/rack)
- High Upfront Capex for Advanced Cabinets
- Power and Space Scarcity in Tier-1 Metros
For complete list of drivers and restraints, kindly check the Table Of Contents.
Segment Analysis
Full racks delivered 57.4% of the data center rack market in 2024 and will outpace other sizes with a 12.9% CAGR to 2030. That share equates to a commanding portion of the data center rack market size and reflects hyperscalers' preference for 42U footprints that streamline cabling, airflow, and PDU standardisation. AI clusters demand sprawling PCIe and NVLink interconnects, making full racks indispensable for clean cable routing that sustains signal integrity at 100 Gbps and higher. In retrofit halls, larger frames also minimise floor-tile reconfiguration costs by aligning with existing cold-aisle geometry.
Liquid cooling magnifies full-rack advantages because taller vertical spaces facilitate segregated supply-and-return coolant channels. Schneider Electric's GB200 NVL72 blueprint achieves 132 kW per full rack through bespoke manifolds positioned below a 42U server zone. The data center rack market thus rewards vendors that deliver factory-integrated coolant loops, redundant pumps, and quick-disconnect couplings pre-installed within full-height cabinets. Half- and quarter-rack formats still serve edge closets and network rooms, yet their CAGR trails because these environments seldom require lavish GPU clusters.
Although 42U frames dominated 2024 with 53.7% revenue share, 48U variants are the fastest-growing height, posting 12.1% CAGR through 2030. Operators value the extra 6U for housing liquid manifolds, busways, or top-of-rack switches without sacrificing server slots. The incremental height reduces aisle count, yielding up to 12% floor-space savings in large halls. Taller frames also balance weight distribution across casters, vital when cabinets surpass 1,500 kilograms once coolant is added.
Rittal's VX IT line lets technicians mix 42U and 48U frames on common rails, easing phased migrations that align with budget cycles. Custom 52U or 54U models appear in high-ceiling warehouses where vertical clearance is plentiful, but adoption remains niche. With liquid cooling pushing density ceilings higher, the data center rack market regards 48U as the sweet spot between legacy compatibility and forward-looking capacity.
Data Center Rack Market is Segmented by Rack Size(Quartely Rack, Half Rack, Full Rack), Rack Height (42U, 45U and More), Rack Type(Cabinet (Closed) Racks, Open-Frame Racks, Wall-Mount Racks), Data Center Type(Colocation Facilities, Hyperscale and Cloud Service Provider DCs, Enterprise and Edge), Material(steel, Aluminum, Other Alloys and Composites) and by Geography. The Market Forecasts are Provided in Terms of Value (USD).
Geography Analysis
North America commanded 32.6% of 2024 revenue thanks to deep hyperscale ecosystems, well-established supply chains, and regulatory clarity. Data-center capital expenditure surpassed USD 27 billion in the United States during 2025, though utility congestion in Northern Virginia and Silicon Valley tempers growth. Canada accelerates sustainability-centric builds that leverage hydro generation, while Mexico attracts near-shoring edge nodes supporting U.S. latency targets. Local manufacturing expansions, such as Schneider Electric's USD 140 million Tennessee plant for switchgear, help suppliers dodge tariff headwinds.
Asia-Pacific is advancing at a 13.2% CAGR, the fastest regional clip in the data center rack market. China channels sovereign AI funds into massive GPU bases, India's digital-services boom propels 5- to 20-MW campuses across tier-2 cities, and Japan backs edge clusters to automate factories. Regional fabrication hubs slash logistics lead times for racks, yet copper deficits could add cost volatility. Projects such as Vertiv-equipped iGenius AI centers illustrate how domestic supply ecosystems are rising to meet localised compute mandates.
- Schneider Electric SE
- Vertiv Group Corp.
- Eaton Corp. plc
- Rittal GmbH and Co. KG
- Hewlett Packard Enterprise
- Dell Technologies Inc.
- Legrand SA
- IBM Corp.
- Chatsworth Products Inc.
- Panduit Corp.
- APC (by Schneider Electric)
- Tripp Lite (Eaton)
- Great Lakes Case and Cabinet
- Belkin International Inc.
- Kendall Howard LLC
- Martin International Enclosures
- Black Box Corp.
- Fujitsu Ltd.
- Oracle Corp.
- Cisco Systems Inc.
Additional Benefits:
- The market estimate (ME) sheet in Excel format
- 3 months of analyst support
TABLE OF CONTENTS
1 INTRODUCTION
- 1.1 Study Assumptions and Market Definition
- 1.2 Scope of the Study
2 RESEARCH METHODOLOGY
3 EXECUTIVE SUMMARY
4 MARKET LANDSCAPE
- 4.1 Market Overview
- 4.2 Market Drivers
- 4.2.1 Hyperscale and colocation build-outs surge
- 4.2.2 Rising cloud and edge adoption boosts rack demand
- 4.2.3 High-density server deployment (greater than 40 kW/rack)
- 4.2.4 Energy-efficiency regulations (EU Code of Conduct / ASHRAE)
- 4.2.5 AI-optimised liquid-cooled rack architectures
- 4.2.6 National incentives for local rack manufacturing
- 4.3 Market Restraints
- 4.3.1 High upfront capex for advanced cabinets
- 4.3.2 Growing use of blade/server-on-chip modules
- 4.3.3 Power and space scarcity in tier-1 metros
- 4.3.4 Specialty steel and aluminium supply volatility
- 4.4 Supply-Chain Analysis
- 4.5 Regulatory Landscape
- 4.6 Technological Outlook
- 4.7 Porter's Five Forces
- 4.7.1 Bargaining Power of Suppliers
- 4.7.2 Bargaining Power of Buyers
- 4.7.3 Threat of New Entrants
- 4.7.4 Intensity of Rivalry
- 4.7.5 Threat of Substitutes
- 4.8 Assessment of Macroeconomic Factors on the Market
5 MARKET SIZE and GROWTH FORECASTS (VALUE)
- 5.1 By Rack Size
- 5.1.1 Quarter Rack
- 5.1.2 Half Rack
- 5.1.3 Full Rack
- 5.2 By Rack Height
- 5.2.1 42U
- 5.2.2 45U
- 5.2.3 48U
- 5.2.4 Other Heights (52U and Custom)
- 5.3 By Rack Type
- 5.3.1 Cabinet (Closed) Racks
- 5.3.2 Open-Frame Racks
- 5.3.3 Wall-Mount Racks
- 5.4 By Data Center Type
- 5.4.1 Colocation Facilities
- 5.4.2 Hyperscale and Cloud Service Provider DCs
- 5.4.3 Enterprise and Edge
- 5.5 By Material
- 5.5.1 Steel
- 5.5.2 Aluminum
- 5.5.3 Other Alloys and Composites
- 5.6 By Geography
- 5.6.1 North America
- 5.6.1.1 United States
- 5.6.1.2 Canada
- 5.6.1.3 Mexico
- 5.6.2 South America
- 5.6.2.1 Brazil
- 5.6.2.2 Argentina
- 5.6.2.3 Rest of South America
- 5.6.3 Europe
- 5.6.3.1 Germany
- 5.6.3.2 United Kingdom
- 5.6.3.3 France
- 5.6.3.4 Italy
- 5.6.3.5 Spain
- 5.6.3.6 Russia
- 5.6.3.7 Rest of Europe
- 5.6.4 Asia-Pacific
- 5.6.4.1 China
- 5.6.4.2 Japan
- 5.6.4.3 India
- 5.6.4.4 South Korea
- 5.6.4.5 Australia and New Zealand
- 5.6.4.6 Rest of Asia-Pacific
- 5.6.5 Middle East and Africa
- 5.6.5.1 Middle East
- 5.6.5.1.1 Saudi Arabia
- 5.6.5.1.2 United Arab Emirates
- 5.6.5.1.3 Turkey
- 5.6.5.1.4 Rest of Middle East
- 5.6.5.2 Africa
- 5.6.5.2.1 South Africa
- 5.6.5.2.2 Nigeria
- 5.6.5.2.3 Rest of Africa
- 5.6.1 North America
6 COMPETITIVE LANDSCAPE
- 6.1 Market Concentration
- 6.2 Strategic Moves
- 6.3 Market Share Analysis
- 6.4 Company Profiles (includes Global level Overview, Market level overview, Core Segments, Financials as available, Strategic Information, Market Rank/Share for key companies, Products and Services, and Recent Developments)
- 6.4.1 Schneider Electric SE
- 6.4.2 Vertiv Group Corp.
- 6.4.3 Eaton Corp. plc
- 6.4.4 Rittal GmbH and Co. KG
- 6.4.5 Hewlett Packard Enterprise
- 6.4.6 Dell Technologies Inc.
- 6.4.7 Legrand SA
- 6.4.8 IBM Corp.
- 6.4.9 Chatsworth Products Inc.
- 6.4.10 Panduit Corp.
- 6.4.11 APC (by Schneider Electric)
- 6.4.12 Tripp Lite (Eaton)
- 6.4.13 Great Lakes Case and Cabinet
- 6.4.14 Belkin International Inc.
- 6.4.15 Kendall Howard LLC
- 6.4.16 Martin International Enclosures
- 6.4.17 Black Box Corp.
- 6.4.18 Fujitsu Ltd.
- 6.4.19 Oracle Corp.
- 6.4.20 Cisco Systems Inc.
7 MARKET OPPORTUNITIES and FUTURE OUTLOOK
- 7.1 White-space and Unmet-need Assessment
