|
시장보고서
상품코드
1850210
원료의약품(API) 시장 : 점유율 분석, 산업 동향, 통계, 성장 예측(2025-2030년)Active Pharmaceutical Ingredients (API) - Market Share Analysis, Industry Trends & Statistics, Growth Forecasts (2025 - 2030) |
||||||
원료의약품 시장 규모는 2025년에 2,321억 3,000만 달러, 예측 기간(2025-2030년)의 CAGR은 7.22%를 나타내고, 2030년에는 3,289억 4,000만 달러에 달할 것으로 예측됩니다.

지속적인 성장은 제약 부문이 전문적이고 가치있는 분자로 전환, 표적 치료에 대한 수요가 증가하고 아웃소싱에 대한 의존도가 높아지고 있기 때문입니다. 북미는 엄격한 규제 감독과 확립된 제조거점을 배경으로 주도적 지위를 유지하고 있으며, 아시아는 비용 경쟁력과 기술적으로 정교한 생산 능력을 제공함으로써 증가하는 생산량을 획득하고 있습니다. 미국과 유럽의 전략적 재조달, 지속적인 제조 채택 확대, mRNA 플랫폼의 개발 가속화가 경쟁 역학을 재구성하고 있습니다. 고역가 및 생물학적 제제의 원료의약품에의 자금 유입은 공급 체인의 강인성 중시의 높아짐과 함께 품질 시스템과 첨단 프로세스 노하우를 겸비한 기업에 더욱 확대의 기회를 가져오고 있습니다.
세계의약품원료의약품(API) 시장 동향과 통찰
고역가 API(HPAPI) 수요 급증
Precision On Colology(정밀 종양학)에 대한 관심 증가로 HPAPI에 대한 요구가 급증하고 있으며, HPAPI는 이미 연구 파이프라인의 30% 이상을 차지하고 있습니다. HPAPI는 저용량이면서도 뛰어난 치료 효과를 가져오기 때문에 제조업체는 고밀도 설비에 대한 투자를 강요하고 있습니다. 론자사만으로도 지난 15년간 50개 이상의 HPAPI 화합물을 개발해 FDA와 ANVISA의 기준을 충족하면서 비스프와 남사에서 전용 라인을 가동시키고 있다(1) Lonza AG, "HPAPI Handling and Development", lonza.com. 이러한 전문화된 인프라는 강력한 진입 장벽을 만들어 기존 기업이 프리미엄 가격과 장기 공급 계약을 확보할 수 있도록 합니다. 강력한 화합물 프로그램 증가는 자본 배분을 재구성하고 혁신자와 CDMO 모두에 아이솔레이터 기반 제품군과 고급 분석 능력의 확대를 촉진합니다. 암 영역의 파이프라인이 성숙함에 따라 HPAPI의 생산량은 증가의 길을 따라가고, 원료의약품 시장의 핵심 밸류드라이버로서의 역할이 강화될 것입니다.
개발·제조 수탁기관(CDMO)의 급속한 확대
제약회사는 자본배포의 최적화와 상시시기의 전복을 위해 API 개발과 상업생산의 CDMO에 아웃소싱을 추진하고 있습니다. 상용 API의 생산량은 2030년까지 연평균 복합 성장률(CAGR) 8.07%로 성장하여 자사 생산을 웃도는 것으로 예측되고 있습니다. CDMO는 현재 루트 스카우트, 스케일 업, 분석 개발 및 규제 문서화를 포함한 통합 솔루션을 제공하여 고객의 위험과 인프라 부담을 완화하고 있습니다. 투자의 기세는 틈새 전문 지식이 요구되는 높은 역가, 무균, 복잡한 합성 공정의 능력에서 가장 두드러집니다. CDMO 간의 경쟁은 순수한 비용 우위에서 품질 시스템 및 엔드 투 엔드 기술 지원을 기반으로 차별화로 전환하고 있으며, 이러한 추세는 원료 시장 전체의 가치 창출을 재정의하고 있습니다.
중국과 인도에서 주요 출발 원료 공급의 불안정성
USP의 데이터에 따르면, 2023년 미국 의약품 마스터 파일 중 국내 제조를 들고 있는 것은 불과 4%인 반면 인도와 중국은 모두 80% 이상을 차지하고 있습니다. 허브 중 하나에서 혼란이 발생하면 세계 공급망을 파괴하여 스팟 공급 부족과 비용 상승을 초래할 수 있습니다. 또한 단일 지역공급원에 대한 의존은 규제 당국의 검사를 복잡하게 하고 지정학적 위험을 증가시킵니다. 따라서 제조업체는 이중 조달 전략을 평가하고 공급망 시각화 도구에 투자하며 중요한 출발 원료를 현지 조달하는 인센티브를 얻기 위해 로비 활동을 수행합니다. 이러한 대책은 컴플라이언스 비용을 증대시키고 개발 기간을 장기화시키기 위해 원료의약품 시장의 성장을 억제하게 됩니다.
부문 분석
2024년 매출의 48.91%를 상인 공급업체가 차지했고, 캡티브 오퍼레이션은 51.09%와 약간 차이로 과반수를 유지했습니다. 머천트 부문의 예상 CAGR이 8.07%인 것은 엄격한 품질 요구에 따라 스케일 업을 해내는 외부 파트너에 대한 신뢰가 높아지고 있음을 나타냅니다. 제약회사는 독자적인 고가치분자에는 사내 생산능력을 확보하고 있지만 라이프사이클의 후기와 제네릭 원료의약품을 CDMO로 이관하여 자산의 최대 활용을 도모하고 있습니다. 복잡한 합성 경로와 역가 요건이 전문업체에게 유리하게 작용하기 때문에 원료의약품의 외부 위탁 생산 시장 규모는 더욱 가속될 것으로 예측됩니다.
봉쇄 장비, 연속 처리 라인 및 고급 분석 실험실에 대한 투자 흐름은 CDMO에 유리한 구조 전환을 강조합니다. 그 때문에 원료의약품 시장에서는 특히 유연한 소량 생산을 필요로 하는 암이나 희귀질환의 프로그램에 있어서, 엔드 투 엔드의 개발 서비스와 입증된 약사 규제를 조합한 공급자가 편리하게 되고 있습니다.
2024년 출하량의 65.35%는 여전히 합성경로에 지지되고 있지만, 바이오의약품원료의약품은 2030년까지 9.07%의 성장을 이루었고, 그 차이는 줄어들 전망입니다. 세포주 엔지니어링, 발현 최적화 및 다운스트림 정제의 최근 발전은 단가를 낮추고 복잡한 생물학적 제제를 보다 광범위한 치료 카테고리에 접근할 수 있도록 하고 있습니다. 바이오 의약품 루트의 원료 시장 규모는 단일클론항체, 펩티드, 핵산 기반 치료제로 가장 빠르게 확대되고 있습니다.
한편, 합성 제조업체는 공정 수를 단축하고 수율을 향상시키기 위해 생체 촉매와 화학 효소 캐스케이드를 통합하고 있습니다. 이 수렴은 역사적인 구별을 모호하게 하고, 위험을 분산시키고, 두 합성 양식을 하나의 보다 탄력적인 공급 아키텍처에 고정시키는 것입니다. 가까운 미래에, 합성 원료는 성숙하고 확장 가능한 화학적 접근법의 혜택을 받는 저분자 화합물에 필수적인 존재인 것으로 보입니다.
지역 분석
북미는 견고한 R&D 생태계, 프리미엄 가격, 지적 재산권의 틀을 배경으로 2024년에는 41%의 매출 점유율을 유지합니다. 워싱턴이 2025년5 월에 발표 한 시설 승인의 합리화에 대한 대통령령으로 국내 생산 능력 증진이 가속 될 것으로 예상되며, 엘리 릴리는 인디애나의 새로운 API 컴플렉스에 53억 달러를 충당합니다.
. 이러한 개발은 중요한 의약품의 현지 생산을 재설정하여 집중 위험을 줄이기 위한 것입니다.
아시아태평양은 가장 강력한 성장 엔진이며 2030년까지 연평균 복합 성장률(CAGR)은 7.70%를 나타낼 전망입니다. 인도와 중국은 FDA의 DMF의 82%를 제출했으며 비용에 민감한 부문에서 우위를 차지하고 있습니다. 베이징의 항생제와 진통제 생산량은 대규모이며 규모의 우위성을 뒷받침하고 있으며, 인도의 생산 연동 장려금 제도는 발효와 복잡한 합성을 위한 그린필드 유닛에 자금을 공급하고 있습니다. 급성장하는 생물학적 제제와 HPAPI 파이프라인은 다국적 기업과의 제휴를 더욱 유치하고, 원료 시장에서 아시아의 중심적인 역할을 확고하게 하고 있습니다.
유럽은 엄격한 품질 기준과 깊은 과학적 재능으로 복잡하고 고가치의 원료에 특필해야 할 지위를 유지하고 있습니다. 세계적인 점유율은 감소하는 경향이 있지만, 이 지역은 지속적인 제조, 그린 케미컬 및 역가 억제에 계속해서 주도하고 있습니다. 유럽 기업은 규제 약물과 소량 생산의 생물 제제에 관한 전문 지식으로 차별화를 도모해, 보다 광범위한 원료의약품 시장 중에서 탄력적인 틈새를 육성하고 있습니다.
기타 혜택 :
- 엑셀 형식 시장 예측(ME) 시트
- 3개월간의 애널리스트 서포트
목차
제1장 A. 타이틀과 목차- 원료의약품(API) 시장
제2장 소개
- 조사의 전제조건과 시장의 정의
- 조사 범위
제3장 조사 방법
제4장 주요 요약
제5장 시장 상황
- 시장 개요
- 시장 성장 촉진요인
- 고효력 API(HPAPI) 수요의 급증
- 중소규모의 제약 기업을 지원하는 위탁 개발 제조 조직(CDMO)의 급속한 확대
- COVID-19 후의 백신 및 mRNA 플랫폼의 상업화의 가속
- 상용 생산으로의 이행에 의한 생산 효율의 향상
- 주요 원재료의 중국 의존을 줄이기 위한 미국과 EU의 리쇼어링 이니셔티브
- ESG 규제에 의한 지속 가능한 「그린 케미스트리」루트에 대한 수요 증가
- 시장 성장 억제요인
- 중국과 인도의 주요 원료 공급 불안정화
- 생산 능력의 세분화에 의해 제네릭 소분자의 가격 압력이 강해진다
- 인플레이션에 따른 에너지 및 용매 비용의 상승이 이익률에 영향
- 바이오테크놀러지 API에 관한 복잡한 국제규제의 조화
- 공급망 분석
- 기술의 전망
- Porter's Five Forces
- 신규 참가업체의 위협
- 구매자의 협상력
- 공급기업의 협상력
- 대체품의 위협
- 경쟁 기업간 경쟁 관계
제6장 시장 규모와 성장 예측
- 비즈니스 모델별
- 캡티브 API
- 판매자/계약 API
- 합성 유형별
- 합성 API
- 생명공학 API
- 분자의 크기별
- 소분자
- 거대분자/생물제제
- 효력별
- 고효력 API
- 저/중효력 API
- 치유 영역별
- 종양학
- 심혈관계
- 감염증
- 대사 장애
- 중추신경계 및 신경학
- 호흡기
- 안과
- 기타
- 지역
- 북미
- 미국
- 캐나다
- 멕시코
- 유럽
- 독일
- 영국
- 프랑스
- 이탈리아
- 스페인
- 기타 유럽
- 아시아태평양
- 중국
- 일본
- 인도
- 한국
- 호주
- 기타 아시아
- 중동 및 아프리카
- GCC
- 남아프리카
- 기타 중동?아프리카
- 남미
- 브라질
- 아르헨티나
- 기타 남미
- 북미
제7장 경쟁 구도
- 시장 집중도
- 시장 점유율 분석
- 기업 프로파일
- Teva Pharmaceutical Industries Ltd
- Novartis AG
- Pfizer Inc
- Aurobindo Pharma Ltd
- Sun Pharmaceutical Industries Ltd
- Dr. Reddy's Laboratories Ltd
- Viatris Inc
- BASF SE
- Merck KGaA
- Lupin Ltd
- Cipla Ltd
- Lonza Group AG
- Catalent Inc
- Cambrex Corp
- Thermo Fisher Scientific(Patheon)
- Boehringer Ingelheim
- Sanofi SA
- GSK plc
- Corden Pharma
- Samsung Biologics
- WuXi AppTec
- AbbVie Inc
제8장 시장 기회와 장래의 전망
- 화이트 스페이스와 미충족 요구의 평가
The Active Pharmaceutical Ingredients Market size is estimated at USD 232.13 billion in 2025, and is expected to reach USD 328.94 billion by 2030, at a CAGR of 7.22% during the forecast period (2025-2030).
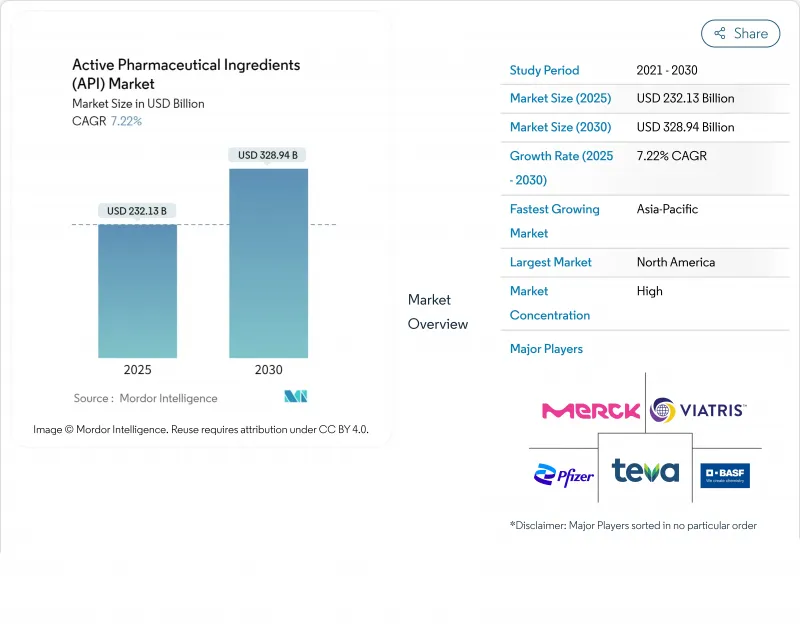
Sustained growth stems from the pharmaceutical sector's pivot toward specialized, higher-value molecules, rising demand for targeted therapies, and greater reliance on outsourcing. North America retains leadership on account of stringent regulatory oversight and an established manufacturing base, while Asia is capturing incremental volumes by offering cost-competitive, technologically sophisticated capacity. Strategic reshoring in the United States and Europe, growing adoption of continuous manufacturing, and accelerated development of mRNA platforms are reshaping competitive dynamics. Capital inflows into high-potency and biologic APIs, together with heightened emphasis on supply-chain resilience, are creating further expansion opportunities for companies that combine quality systems with advanced process know-how.
Global Active Pharmaceutical Ingredients (API) Market Trends and Insights
Surging Demand for High-Potency APIs (HPAPIs)
Heightened focus on precision oncology is driving a sharp uptick in HPAPI requirements, with these molecules already comprising more than 30% of the research pipeline. HPAPIs allow lower dosages yet deliver superior therapeutic outcomes, compelling manufacturers to invest in highly contained facilities. Lonza alone has developed over 50 HPAPI compounds during the past 15 years, operating dedicated lines in Visp and Nansha while meeting FDA and ANVISA standards [1]Lonza AG, "HPAPI Handling and Development," lonza.com. Such specialised infrastructure creates formidable entry barriers, enabling established firms to secure premium pricing and long-term supply agreements. The swell in potent-compound programs is reshaping capital allocation, prompting both innovators and CDMOs to expand isolator-based suites and advanced analytics capabilities. As oncology pipelines mature, HPAPI volumes are likely to keep rising, reinforcing the segment's role as a core value driver in the active pharmaceutical ingredients market.
Rapid Expansion of Contract Development & Manufacturing Organizations (CDMOs)
Pharmaceutical companies are increasingly outsourcing API development and commercial manufacturing to CDMOs to optimise capital deployment and accelerate launch timelines. Merchant API output is projected to grow at an 8.07% CAGR through 2030, outpacing captive production. CDMOs now deliver integrated solutions that encompass route scouting, scale-up, analytical development, and regulatory documentation, thereby reducing clients' risk and infrastructure burden. Investment momentum is most visible in capabilities for high-potency, sterile, and complex synthetic processes that demand niche expertise. Competition among CDMOs is shifting from pure cost advantages toward differentiation based on quality systems and end-to-end technical support, a trend that is redefining value creation across the active pharmaceutical ingredients market.
Volatility in Supply of Key Starting Materials from China & India
USP data show that only 4% of 2023 US drug master files cited domestic manufacturing, whereas India and China together accounted for more than 80%. Disruptions in either hub can ripple through global supply chains, triggering spot shortages and cost spikes. Reliance on single-region sources also complicates regulatory inspections and heightens geopolitical risk. Manufacturers are therefore assessing dual-sourcing strategies, investing in supply-chain visibility tools, and lobbying for incentives to localise critical starting materials. These measures increase compliance costs and elongate development timelines, tempering headline growth in the active pharmaceutical ingredients market.
Other drivers and restraints analyzed in the detailed report include:
- Accelerated Vaccine & mRNA Platform Commercialisation Post-COVID-19
- Shift Toward Continuous Manufacturing Boosting Output Efficiency
- Capacity Fragmentation Intensifying Price Pressure in Generic Small Molecules
For complete list of drivers and restraints, kindly check the Table Of Contents.
Segment Analysis
Merchant suppliers generated 48.91% of 2024 revenue, while captive operations retained a narrow majority at 51.09%. The merchant segment's 8.07% projected CAGR indicates rising confidence in external partners to handle scale-up under stringent quality expectations. Pharmaceutical companies are reserving in-house capacity for proprietary, high-value molecules yet are transferring late-life-cycle and generic APIs to CDMOs to maximise asset utilisation. The active pharmaceutical ingredients market size for outsourced production is forecast to accelerate further as complex synthetic routes and potency requirements favour specialist providers.
Investment flows into containment suites, continuous processing lines, and advanced analytical laboratories underscore the structural shift in favour of CDMOs. The active pharmaceutical ingredients market therefore rewards suppliers that combine end-to-end development services with proven regulatory track records, particularly for oncology and rare-disease programs that necessitate flexible, small-batch production.
Synthetic pathways still underpin 65.35% of 2024 shipments, yet biotech APIs are set to grow at 9.07% through 2030, narrowing the gap. Recent progress in cell-line engineering, expression optimisation, and downstream purification is lowering unit costs, bringing complex biologics within reach of broader therapeutic categories. The active pharmaceutical ingredients market size for biotech routes is expanding fastest in monoclonal antibodies, peptides, and nucleic-acid-based therapeutics.
Meanwhile, synthetic manufacturers are integrating biocatalysis and chemoenzymatic cascades to shorten step counts and improve yields. This convergence blurs historical distinctions and diversifies risk, anchoring both synthesis modes within a single, more resilient supply architecture. In the near term, synthetic APIs will remain indispensable for small molecules that benefit from mature, scalable chemistries, yet the growth trajectory clearly favours biotech processes.
The Active Pharmaceutical Ingredients (API) Market Report Segments Into by Business Mode (Captive API, Merchant API), by Synthesis Type (Synthetic APIs, Biotech APIs), by Molecule Size (Small Molecule, Large Molecule), by Potency (High Potency, Low/Medium Potency), by Application (Oncology, Cardiovascular, and More), and Geography ( North America, Europe and More). The Market Forecasts are Provided in Terms of Value (USD).
Geography Analysis
North America retained a 41% revenue share in 2024 on the back of a robust R&D ecosystem, premium pricing, and supportive intellectual-property frameworks. Washington's May 2025 executive order to streamline facility approvals is expected to accelerate domestic capacity additions, with Eli Lilly allocating USD 5.3 billion to a new Indiana API complex [2] Eli Lilly & Co., "Lilly to Invest USD 5.3 Billion in Indiana Facilities," lilly.com
. These developments aim to mitigate concentration risk by re-establishing local production for critical medicines.
Asia-Pacific represents the strongest growth engine, posting a projected 7.70% CAGR through 2030. India and China file 82% of FDA DMFs, anchoring their dominance in cost-sensitive segments. Beijing's sizeable antibiotic and analgesic output underscores substantial scale advantages, while India's Production Linked Incentive scheme is funding greenfield units for fermentation and complex synthesis. Fast-growing biologic and HPAPI pipelines are further attracting multinational partnerships, cementing Asia's central role in the active pharmaceutical ingredients market.
Europe maintains a notable position in complex, high-value APIs owing to stringent quality standards and deep scientific talent. Although its global share is edging downward, the region continues to lead in continuous manufacturing, green chemistry, and potency containment. European firms are differentiating with expertise in controlled substances and low-volume biologics, fostering resilient niches within the broader active pharmaceutical ingredients market.
List of Companies Covered in this Report:
- Teva Pharmaceutical Industries
- Novartis
- Pfizer
- Aurobindo Pharma
- Sun Pharmaceuticals Industries
- Dr. Reddy's Laboratories Ltd
- Viatris
- BASF
- Merck
- Lupin
- Cipla
- Lonza Group
- Catalent
- Cambrex Corp
- Thermo Fisher Scientific (Patheon)
- Boehringer Ingelheim
- Sanofi
- GlaxoSmithKline
- Corden Pharma
- Samsung Group
- WuXi App Tec
- Abbvie
Additional Benefits:
- The market estimate (ME) sheet in Excel format
- 3 months of analyst support
TABLE OF CONTENTS
1 A. Title and Table of Contents - Active Pharmaceutical Ingredients (API) Market
2 Introduction
- 2.1 Study Assumptions & Market Definition
- 2.2 Scope of the Study
3 Research Methodology
4 Executive Summary
5 Market Landscape
- 5.1 Market Overview
- 5.2 Market Drivers
- 5.2.1 Surging Demand for High-Potency APIs (HPAPIs)
- 5.2.2 Rapid Expansion of Contract Development & Manufacturing Organizations (CDMOs) Supporting Small/Mid-Sized Pharma
- 5.2.3 Accelerated Vaccine & mRNA Platform Commercialization Post-COVID-19
- 5.2.4 Shift Toward Continuous Manufacturing Boosting Output Efficiency
- 5.2.5 Re-shoring Initiatives in US & EU to Reduce China Dependency for Key Starting Materials
- 5.2.6 Growing Demand for Sustainable "Green Chemistry" Routes Driven by ESG Mandates
- 5.3 Market Restraints
- 5.3.1 Volatility in Supply of Key Starting Materials From China & India
- 5.3.2 Capacity Fragmentation Intensifying Price Pressure in Generic Small Molecules
- 5.3.3 Inflation-Linked Escalation in Energy & Solvent Costs Impacting Margins
- 5.3.4 Complex Global Regulatory Harmonization for Biotech APIs
- 5.4 Supply-Chain Analysis
- 5.5 Technological Outlook
- 5.6 Porter's Five Forces
- 5.6.1 Threat of New Entrants
- 5.6.2 Bargaining Power of Buyers
- 5.6.3 Bargaining Power of Suppliers
- 5.6.4 Threat of Substitutes
- 5.6.5 Intensity of Competitive Rivalry
6 Market Size & Growth Forecasts (Value, USD)
- 6.1 By Business Model
- 6.1.1 Captive API
- 6.1.2 Merchant / Contract API
- 6.2 By Synthesis Type
- 6.2.1 Synthetic APIs
- 6.2.2 Biotech APIs
- 6.3 By Molecule Size
- 6.3.1 Small Molecule
- 6.3.2 Large Molecule / Biologics
- 6.4 By Potency
- 6.4.1 High-Potency APIs
- 6.4.2 Low-/Medium-Potency APIs
- 6.5 By Therapeutic Area
- 6.5.1 Oncology
- 6.5.2 Cardiovascular
- 6.5.3 Infectious Diseases
- 6.5.4 Metabolic Disorders
- 6.5.5 CNS & Neurology
- 6.5.6 Respiratory
- 6.5.7 Ophthalmology
- 6.5.8 Others
- 6.6 Geography
- 6.6.1 North America
- 6.6.1.1 United States
- 6.6.1.2 Canada
- 6.6.1.3 Mexico
- 6.6.2 Europe
- 6.6.2.1 Germany
- 6.6.2.2 United Kingdom
- 6.6.2.3 France
- 6.6.2.4 Italy
- 6.6.2.5 Spain
- 6.6.2.6 Rest of Europe
- 6.6.3 Asia-Pacific
- 6.6.3.1 China
- 6.6.3.2 Japan
- 6.6.3.3 India
- 6.6.3.4 South Korea
- 6.6.3.5 Australia
- 6.6.3.6 Rest of Asia
- 6.6.4 Middle East and Africa
- 6.6.4.1 GCC
- 6.6.4.2 South Africa
- 6.6.4.3 Rest of Middle East and Africa
- 6.6.5 South America
- 6.6.5.1 Brazil
- 6.6.5.2 Argentina
- 6.6.5.3 Rest of South America
- 6.6.1 North America
7 Competitive Landscape
- 7.1 Market Concentration
- 7.2 Market Share Analysis
- 7.3 Company Profiles (includes Global level Overview, Market level overview, Core Business Segments, Financials, Headcount, Key Information, Market Rank, Market Share, Products and Services, and analysis of Recent Developments))
- 7.3.1 Teva Pharmaceutical Industries Ltd
- 7.3.2 Novartis AG
- 7.3.3 Pfizer Inc
- 7.3.4 Aurobindo Pharma Ltd
- 7.3.5 Sun Pharmaceutical Industries Ltd
- 7.3.6 Dr. Reddy's Laboratories Ltd
- 7.3.7 Viatris Inc
- 7.3.8 BASF SE
- 7.3.9 Merck KGaA
- 7.3.10 Lupin Ltd
- 7.3.11 Cipla Ltd
- 7.3.12 Lonza Group AG
- 7.3.13 Catalent Inc
- 7.3.14 Cambrex Corp
- 7.3.15 Thermo Fisher Scientific (Patheon)
- 7.3.16 Boehringer Ingelheim
- 7.3.17 Sanofi SA
- 7.3.18 GSK plc
- 7.3.19 Corden Pharma
- 7.3.20 Samsung Biologics
- 7.3.21 WuXi AppTec
- 7.3.22 AbbVie Inc
8 Market Opportunities & Future Outlook
- 8.1 White-Space & Unmet-Need Assessment