


|
시장보고서
상품코드
1851072
대형 트럭 시장 : 시장 점유율 분석, 산업 동향, 통계, 성장 예측(2025-2030년)Heavy Duty Trucks - Market Share Analysis, Industry Trends & Statistics, Growth Forecasts (2025 - 2030) |
||||||
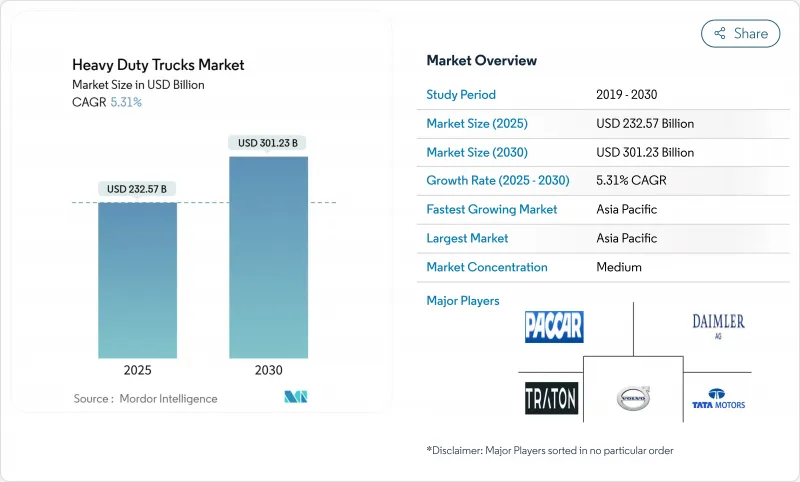
대형 트럭 시장의 2025년 시장 규모는 2,325억 7,000만 달러로 예상되고, 2030년에는 3,012억 3,000만 달러에 이를 것으로 예측되며, CAGR은 5.31%를 기록할 전망입니다.
플릿이 강화된 배출가스 규제에 대한 즉각적인 대응과 장기적인 전동화 계획에 중점을 두면서 수요는 신중한 성장 경로를 따를 전망입니다. 세계 규제 강화, 전례없는 인프라 지출, 배터리 및 수소 기술의 급속한 진보가 결합되어 구매 의사 결정과 자본 배분 전략이 재구성됩니다. 기존 제조업체가 새로운 플랫폼에 투자하는 한편, 소프트웨어 전문가와 배터리 공급업체가 에코시스템에 진출하여 엔진 설계와 마찬가지로 운영체제 아키텍처의 제어가 중요한 경쟁 환경을 만들어 내고 있습니다. 정책에 연동한 프리바이 사이클이 당장의 디젤차 대수를 밀어 올리지만, 코스트 평준화의 마일스톤이 가까워짐에 따라 모든 지역의 전망에 제로 배출 차량으로의 신속한 이동이 포함되고 있습니다. 일부 회랑에서는 순환적인 화물 운송의 수요 감소가 나타나고 있지만 아시아태평양에서는 규모의 우위성, 북미에서는 정부 조달 인센티브, 유럽에서는 선진적인 스케줄이 결합되어 시장의 성장 전망은 견고합니다.
세계의 대형 트럭 시장의 동향과 인사이트
전자상거래 화물량 확대
전자상거래 화물의 확대는 라스트 마일 배달의 최적화와 지역 배송 네트워크의 고밀도화를 통해 대형 트럭 수요를 촉진합니다. 온라인 소매의 급증은 제로 배출 의무화에 의해 디젤 사업이 점점 제한되는 도시 환경에서 중형 전기 트럭에 대한 수요를 창출합니다. 플릿 운영자는 예측 가능한 경로로 매일 여러 운송 주기를 수행할 수 있는 차량을 선호하며, 배터리 전기 트럭은 초기 비용이 높음에도 불구하고 경제적으로 실현 가능합니다. 이 시프트는 운행 패턴이 현재 배터리 기술의 한계에 부합하는 클래스 7 부문에 특히 이점을 제공합니다. 지자체가 제로 배출 영역을 도입하고 소비자가 더 빠르고 지속 가능한 배송 옵션을 추구함에 따라 이러한 추세는 가속화됩니다. 아마존의 100,000대의 전기 배달 차량에 대한 헌신과 UPS의 재생 가능 천연 가스 트럭의 채택은 물류 대기업이 조달 전략을 어떻게 재구성하는지 보여줍니다.
차량 교체를 촉진하는 세계적인 배출 규제 강화
EPA의 3단계 기준에 의하면 2032년까지 상용 차량의 50%를 제로 배출 차량으로 교체해야 합니다. EU의 CO2 기준 개정은 2040년까지 90%의 배출 감축을 의무화하고, 캘리포니아의 선진 클린 플릿 규칙은 2036년부터 100%의 제로 배출 차량 판매를 의무화하고 있습니다. 애널리스트는 2027년 시행에 앞서 2025년부터 2026년까지 주문이 크게 증가할 것으로 예측하고 있습니디ㅏ. 규제의 캐스케이드 효과는 수출 의존형 제조업체가 가장 엄격한 요구 사항을 중심으로 생산을 표준화하기 때문에 기존 시장 이외로도 확대됩니다. 세계의 전기 트럭 판매 대수의 80% 이상을 차지하는 중국의 제로 배출 대형차의 급속한 보급은 정책이 시장 변혁을 가속화하는 방법을 실증하고 있습니다.
제로 배출 대형 트럭의 높은 초기 비용
제로 배출 트럭은 동급 디젤 차보다 2-3배 높은 구매 비용을 수반합니다. 차량 가격의 30-40%를 차지하는 배터리 팩의 비용은 리튬 이온 가격 하락에도 불구하고 여전히 주요 비용 드라이버입니다. 플릿 운영자는 충전 설비 및 송전망 업그레이드를 위한 추가 인프라 투자에 직면하고 있으며 2035년까지 미국 충전 인프라에 300억 달러가 필요할 것으로 추정됩니다. 총 소유 비용을 계산할 때 사용률이 높고 경로가 예측 가능한 특정 듀티 사이클에서만 전기 트럭이 유리하며 채택은 특수 용도로 제한됩니다. 비용 차이는 선행 투자에 대한 자본이 부족한 중소규모의 플릿에 영향을 미치고, 대규모 사업자가 조기 전기화를 통해 경쟁 우위를 확보함으로써 업계 통합을 가속화할 수 있습니다.
부문 분석
15톤 이상의 트럭의 2024년 시장 점유율은 61.40%였으며 장거리 화물 운송과 최대 적재량을 요구하는 건설 용도의 이점을 반영합니다. 그러나 10-15톤 부문은 도시배송 최적화와 중형 트럭 전동화의 채용으로 2030년까지 연평균 복합 성장률(CAGR) 9.50%로 가장 빠른 성장을 보일 전망입니다. 이 성장 패턴은 플릿 운영자가 최대 적재 옵션을 기본값으로 설정하는 대신 특정 용도에 적합한 차량 크기로 전략적으로 이동하고 있음을 나타냅니다.
대형 부문의 시장 리더십은 페이로드 퍼 트립의 경제성에 대한 규제 우위와 최대 차량 총 중량을 위해 설계된 확립된 인프라에서 비롯됩니다. 반대로, 더 가벼운 대형 트럭은 더 낮은 전기화 비용과 도시가 제로 배출 지역을 도입할 때 도시 액세스 권한으로 이익을 얻습니다. 배터리의 무게 페널티는 더 무거운 트럭에 불리하게 영향을 미치기 때문에 적재량이 운전의 유연성보다 중요하지 않은 10-15톤 부문은 초기의 전동화 채용에 보다 매력적입니다.
클래스 8 차량은 장거리 화물 운송과 중공업 용도에서 중요한 역할을 반영하며 2024년 70.80%의 점유율로 압도적인 시장 리더십을 유지했습니다. 그러나 클래스 7 트럭은 2030년까지 연평균 복합 성장률(CAGR) 8.30%와 가장 강한 성장 궤도를 보일 전망이며, 적재 능력과 전동화의 경제성의 최적의 타협점으로 자리매김하고 있습니다. 이 괴리는 규제 압력과 기술적 제약이 어떻게 기존의 크기 선호를 재형성하는가를 돋보이게 합니다.
클래스 8의 이점은 적재량 극대화가 마일당 경제성에 직접 영향을 미치는 장거리 화물 운송에서 최대 효율에 최적화된 확립된 공급망을 반영합니다. 그러나 클래스 7의 성장 가속은 최대 용량 요구 사항보다 운영 유연성이 우선시되는 도시 배송 용도와 지역 배송 네트워크에서 발생합니다. 이 부문은 대부분의 상업적 용도에 충분한 적재량을 유지하면서 전동화를 위한 배터리 비용의 감소로 이익을 얻고 있습니다. 클래스 5와 클래스 6은 지자체 및 유틸리티 용도의 특수한 틈새 시장을 지원하며, 예측 가능한 듀티 사이클은 단가가 높음에도 불구하고 조기 전기화를 가능하게 합니다.
지역 분석
아시아태평양은 2024년 수익의 47.21%를 차지하였으며 2030년까지 연평균 복합 성장률(CAGR) 9.30%로 확대될 것으로 예측됩니다. 중국의 OEM은 구매 가격을 세계 평균 이하로 낮추는 스케일 메리트를 제공하고 국내 배터리 공급업체는 재료 비용의 변동을 억제하는 LFP 화학을 공급합니다. 인도의 화물 회랑은 Bharatmala 프로그램과 수소 파일럿을 통해 정부의 지원을 받고 있으며 수요를 배터리 및 연료전지 플랫폼으로 유도합니다. 일본은 연료전지 시스템으로 선도하고 있으며, 실증 실험에서는 탱크에서 휠까지의 에너지 손실이 구세대보다 30% 감소한 것으로 나타났습니다. 동남아시아 국가들은 자유무역협정을 활용하여 ASEAN 수요에 대응하는 최종 조립 허브를 설립하고, 호주는 광업의 전기화 시험에서 가혹한 환경 하에서의 메가팩 배터리 시스템을 검증하고 있습니다.
북미는 화물집약형 경제와 확립된 8등급 문화에 견인되어 금액으로 2위를 차지하고 있습니다. 2027년에 시행되는 EPA 3단계 기준이 2025년부터 구매 전 활동에 박차를 가하고 제로 배출 모델로의 전환이 가속화되기 전에 디젤 차량의 생산량을 일시적으로 끌어올립니다. 제조 실적은 오대호에서 멕시코의 누에보 레온 클러스터까지 퍼져 있으며 공급망의 재공유와 무역협정의 이점을 반영합니다. IIJA가 2만 5,000km에 이르는 고속도로 재포장에 자금을 제공하고 덤프와 콘크리트 믹서의 차체 교환 수요가 간접적으로 높아짐에 따라 공공 인프라 계약과 관련된 대형 트럭 시장 규모가 급증합니다. 캐나다는 CleanBC와 CEPA 보조금을 통해 항구 주변의 전기 인프라를 홍보하고 멕시코는 미국 시장 접근을 보장하기 위해 수출 등급 규정 준수를 목표로 하고 있습니다. 캘리포니아와 텍사스의 송전망 개선 프로젝트는 수메가와트의 저장소 충전기 용량을 할당하고 i-10과 i-5 회랑을 따라 초기 연료전지 트럭 배치를 지원합니다.
유럽은 가장 야심찬 탈탄소화 계획을 보이고 있으며, 유럽 의회는 2040년까지 신차 트럭의 CO2를 90% 절감하도록 요구하고 있습니다. 독일, 프랑스, 네덜란드는 이미 제로 배출 트럭 1대당 5만-9만 5,000유로의 보조금을 지급하고 있으며, 거시경제의 역풍에도 불구하고 수주를 늘리고 있습니다. 대체 연료 인프라 규정은 충전기의 가용성을 보장하고 최대 1,200km에 이르는 국경을 넘는 레인에서 항속 거리 불안을 완화합니다. 스칸디나비아의 바이오가스 혼합 의무화는 운송 회사가 엔진을 변경하지 않고 라이프 사이클 배출량을 줄일 수 있도록 합니다. 동유럽의 플릿은 비용면에서 장벽에 직면하고 있지만 저탄소 자동차 구매에 공동 출자하는 EU의 결속 기금 프로그램의 혜택을 받고 있습니다. 남미에서는 브라질의 '로타 2030' 정책이 전기 트럭의 현지 생산에 세액 공제를 부여하고, 칠레와 페루가 구리 채굴 회랑에 급속 충전 네트워크를 제공하는 것을 모색하면서 전망이 개선되었습니다. 중동 및 아프리카는 아직 개발 도상지역이지만, 사우디아라비아의 자동차 투자 프로그램과 남아프리카의 재생에너지 경매는 미래의 전기화의 기세를 시사하고 있습니다.
기타 혜택
- 엑셀 형식 시장 예측(ME) 시트
- 3개월간의 애널리스트 서포트
목차
제1장 서론
- 조사의 전제조건과 시장의 정의
- 조사 범위
제2장 조사 방법
제3장 주요 요약
제4장 시장 상황
- 시장 개요
- 시장 성장 촉진요인
- 확대하는 전자상거래 화물량
- 세계의 엄격한 배기가스 규제가 차량 갱신을 촉진
- 인프라 자극책(미국 IIJA, EU 그린딜 등)
- 아시아태평양의 수소 회랑 파일럿 프로그램
- 운행 관리자를 위한 OTA 대응 TCO 최적화
- 남미의 광업 부문의 전기화에 대한 헌신
- 시장 성장 억제요인
- 제로 배출 대형 트럭의 높은 초기 비용
- 불안정한 디젤 가격 환경이 구매 사이클에 영향
- ADAS/EV의 생산을 지연시키는 반도체 부족
- EU의 차축 중량 규제 강화가 페이로드의 경제성을 제한
- 가치/공급망 분석
- 규제 상황
- 기술의 전망
- Porter's Five Forces 분석
- 공급기업의 협상력
- 소비자의 협상력
- 신규 참가업체의 위협
- 대체품의 위협
- 경쟁 기업간 경쟁 관계
제5장 시장 규모와 성장 예측
- 톤수 유형별
- 10-15 T
- 15톤 이상
- 클래스별
- 클래스 7
- 클래스 8
- 추진 유형별
- 디젤
- 배터리, 일렉트릭
- 연료전지차(FCEV)
- 대체연료(CNG, LNG, 바이오디젤)
- 용도별
- 건설 및 광업
- 화물 및 물류
- 지자체 및 유틸리티
- 기타
- 차체 유형별
- 트랙터 및 트레일러
- 리지드 덤프
- 탱크로리
- 기타
- 판매 채널별
- OEM/초회 구입
- 임대
- 애프터마켓 개조
- 지역별
- 북미
- 미국
- 캐나다
- 기타 북미
- 남미
- 브라질
- 아르헨티나
- 기타 남미
- 유럽
- 독일
- 영국
- 프랑스
- 이탈리아
- 러시아
- 기타 유럽
- 아시아태평양
- 중국
- 인도
- 일본
- 한국
- 호주 및 뉴질랜드
- 기타 아시아태평양
- 중동 및 아프리카
- 사우디아라비아
- 아랍에미리트(UAE)
- 이집트
- 튀르키예
- 남아프리카
- 기타 중동 및 아프리카
- 북미
제6장 경쟁 구도
- 시장 집중도
- 전략적 동향
- 시장 점유율 분석
- 기업 프로파일
- Daimler Truck Holding AG
- Traton SE
- Volvo Group
- PACCAR Inc.
- Dongfeng Motor Corporation
- Tata Motors Ltd
- FAW Group Corp.
- CNHTC(Sinotruk)
- Ashok Leyland Ltd
- Isuzu Motors Ltd
- Hino Motors Ltd
- Navistar International
- Iveco Group NV
- Hyundai Motor Co.
- Nikola Corporation
- JAC Motors
- Kamaz PJSC
- Foton Motor Co. Ltd
제7장 시장 기회와 미래 전망
CSM 25.11.20The heavy duty trucks market is valued at USD 232.57 billion in 2025 and is forecast to reach USD 301.23 billion by 2030, registering a 5.31% CAGR.
Demand follows a measured growth path as fleets weigh immediate compliance with tightening emission rules against long-term electrification plans. Stricter global regulations, unprecedented infrastructure spending, and rapid advances in battery and hydrogen technologies work together to reshape purchase decisions and capital-allocation strategies. Established manufacturers invest in new platforms while software specialists and battery suppliers enter the ecosystem, creating a competitive environment where control of operating-system architecture matters as much as engine design. Policy-linked pre-buy cycles boost near-term diesel volumes, yet every regional outlook incorporates a rapid pivot toward zero-emission vehicles as cost parity milestones draw closer. Scale advantages in Asia Pacific, government procurement incentives in North America, and progressive timelines in Europe combine to keep the market's growth outlook resilient despite cyclical freight softness in some corridors.
Global Heavy Duty Trucks Market Trends and Insights
Expanding E-commerce Freight Volumes
E-commerce freight expansion drives heavy-duty truck demand through last-mile delivery optimization and regional distribution network densification. The surge in online retail creates demand for medium-duty electric trucks in urban environments, where zero-emission mandates increasingly restrict diesel operations. Fleet operators prioritize vehicles capable of multiple daily delivery cycles with predictable routes, making battery-electric trucks economically viable despite higher upfront costs. This shift particularly benefits Class 7 segments, where operational patterns align with current battery technology limitations. The trend accelerates as municipalities implement zero-emission zones and consumers demand faster, more sustainable delivery options. Amazon's commitment to 100,000 electric delivery vehicles and UPS's adoption of renewable natural gas trucks demonstrate how logistics giants reshape procurement strategies.
Strict Global Emission Mandates Driving Fleet Renewal
Regulatory frameworks across major markets create unprecedented pressure for fleet electrification, with the EPA's Phase 3 standards requiring 50% of vocational vehicles to be zero-emission by 2032. The EU's revised CO2 standards mandate 90% emission reductions by 2040, while California's Advanced Clean Fleet rule requires 100% zero-emission vehicle sales starting in 2036. These regulations create artificial demand spikes as fleets engage in pre-buy strategies to avoid compliance costs, with analysts predicting significant order increases in 2025-2026 ahead of 2027 implementation. The regulatory cascade effect extends beyond initial markets, as export-dependent manufacturers standardize production around the most stringent requirements. China's rapid adoption of zero-emission heavy-duty vehicles, with over 80% of global electric truck sales, demonstrates how policy can accelerate market transformation.
High Upfront Cost of Zero-emission Heavy Trucks
Zero-emission trucks carry acquisition costs 2-3 times higher than diesel equivalents. Battery pack costs, representing 30-40% of vehicle price, remain the primary cost driver despite declining lithium-ion prices. Fleet operators face additional infrastructure investments for charging equipment and grid upgrades, with estimates suggesting USD 30 billion needed for U.S. charging infrastructure by 2035. Total cost of ownership calculations favor electric trucks only in specific duty cycles with high utilization and predictable routes, limiting adoption to specialized applications. The cost differential impacts small and medium-sized fleets lacking capital for upfront investments, potentially accelerating industry consolidation as larger operators gain competitive advantages through early electrification.
Other drivers and restraints analyzed in the detailed report include:
- Infrastructure Stimulus Packages
- Hydrogen Corridor Pilot Programs in Asia Pacific
- Volatile Diesel Price Environment Impacting Purchase Cycles
For complete list of drivers and restraints, kindly check the Table Of Contents.
Segment Analysis
More than 15-ton trucks commanded 61.40% market share in 2024, reflecting the dominance of long-haul freight operations and construction applications requiring maximum payload capacity. However, the 10-15-ton segment exhibits the fastest growth at 9.50% CAGR through 2030, driven by urban delivery optimization and medium-duty electrification adoption. This growth pattern indicates fleet operators' strategic shift toward right-sizing vehicles for specific applications rather than defaulting to maximum capacity options.
The heavier segment's market leadership stems from regulatory advantages in payload-per-trip economics and established infrastructure designed for maximum gross vehicle weights. Conversely, lighter heavy trucks benefit from lower electrification costs and urban access privileges as cities implement zero-emission zones. Battery weight penalties affect heavier trucks disproportionately, making the 10-15-ton segment more attractive for early electric adoption where payload sensitivity matters less than operational flexibility.
Class 8 vehicles maintain overwhelming market leadership with 70.80% share in 2024, reflecting their essential role in long-haul freight and heavy construction applications. Yet Class 7 trucks demonstrate the strongest growth trajectory at 8.30% CAGR through 2030, positioning themselves as the optimal compromise between payload capacity and electrification economics. This divergence highlights how regulatory pressures and technological constraints reshape traditional size preferences.
Class 8 dominance reflects established supply chains optimized for maximum efficiency in long-distance freight movement, where payload maximization directly impacts per-mile economics. However, Class 7 growth acceleration stems from urban delivery applications and regional distribution networks where operational flexibility outweighs maximum capacity requirements. The segment benefits from lower battery costs for electrification while maintaining sufficient payload for most commercial applications. Classes 5 and 6 serve specialized niches in municipal and utility applications, where predictable duty cycles enable early electric adoption despite higher per-unit costs.
The Heavy Duty Trucks Market Report is Segmented by Tonnage Type (10 To 15 T and More Than 15 T), Class (Class 7 and Class 8), Propulsion Type (Diesel, Battery-Electric, and More), Application (Construction and Mining, and More), Truck Body Type (Tractor-Trailer, and More), Sales Channel (OEM, and More), and Geography (North America, and More). The Market Forecasts are Provided in Terms of Value (USD) and Volume (Units).
Geography Analysis
Asia Pacific commanded 47.21% of 2024 revenue and is forecast to expand at 9.30% CAGR through 2030, underpinned by China's policy-backed electric-truck ecosystem. Chinese OEMs deliver scale economies that push purchase prices below global averages, and domestic battery suppliers supply LFP chemistries that reduce material cost volatility. India's freight corridors gain government backing through the Bharatmala program and hydrogen pilots, channeling demand into battery and fuel-cell platforms. Japan leads in fuel-cell systems, with demonstrations achieving 30% lower tank-to-wheel energy loss than earlier generations. South-East Asian nations leverage free-trade agreements to establish final-assembly hubs feeding ASEAN demand, while Australia's mining electrification trials validate mega-pack battery systems in extreme environments.
North America ranks second in value, driven by a freight-intensive economy and a well-established Class 8 culture. EPA Phase 3 standards, effective in 2027, spur pre-buy activity beginning in 2025, temporarily lifting diesel output before an accelerated switch to zero-emission models. Manufacturing footprints stretch from the Great Lakes to Mexico's Nuevo Leon cluster, reflecting supply-chain re-shoring and trade-agreement benefits. The heavy duty trucks market size tied to public-infrastructure contracts spikes as the IIJA funds 25,000 km of highway resurfacing, indirectly lifting replacement demand for dump and concrete-mixer bodies. Canada promotes near-port electrification through CleanBC and CEPA grants, while Mexico targets export-grade compliance to secure U.S. market access. Grid-upgrade projects in California and Texas allocate capacity for multi-megawatt depot chargers, anchoring early fuel-cell truck deployments along I-10 and I-5 corridors.
Europe exhibits the most ambitious decarbonization timetable, with the European Parliament mandating a 90% reduction in new-truck CO2 by 2040. Germany, France, and the Netherlands already subsidize €50,000-95,000 per zero-emission truck, lifting order books despite macroeconomic headwinds. The Alternative Fuel Infrastructure Regulation guarantees charger availability, easing range anxiety in cross-border lanes that span up to 1,200 km. Scandinavia pioneers' biogas blending mandates, ensuring carriers can reduce lifecycle emissions without changing engines. Eastern European fleets face cost barriers but benefit from EU cohesion-fund programs that co-finance low-carbon vehicle purchases. South America's outlook improves as Brazil's Rota 2030 policy grants tax credits for local electric-truck production, while Chile and Peru explore fast-charge networks to serve copper-mining corridors. Middle East and Africa remain nascent; however, Saudi Arabia's automotive investment program and South Africa's renewable-energy auctions signal future electrification momentum.
- Daimler Truck Holding AG
- Traton SE
- Volvo Group
- PACCAR Inc.
- Dongfeng Motor Corporation
- Tata Motors Ltd
- FAW Group Corp.
- CNHTC (Sinotruk)
- Ashok Leyland Ltd
- Isuzu Motors Ltd
- Hino Motors Ltd
- Navistar International
- Iveco Group N.V.
- Hyundai Motor Co.
- Nikola Corporation
- JAC Motors
- Kamaz PJSC
- Foton Motor Co. Ltd
Additional Benefits:
- The market estimate (ME) sheet in Excel format
- 3 months of analyst support
TABLE OF CONTENTS
1 Introduction
- 1.1 Study Assumptions and Market Definition
- 1.2 Scope of the Study
2 Research Methodology
3 Executive Summary
4 Market Landscape
- 4.1 Market Overview
- 4.2 Market Drivers
- 4.2.1 Expanding e-commerce freight volumes
- 4.2.2 Strict global emission mandates driving fleet renewal
- 4.2.3 Infrastructure stimulus packages (e.g., U.S. IIJA, EU Green Deal)
- 4.2.4 Hydrogen corridor pilot programs in Asia Pacific
- 4.2.5 OTA-enabled TCO optimization for fleet managers
- 4.2.6 Mining sector electrification commitments in South America
- 4.3 Market Restraints
- 4.3.1 High upfront cost of zero-emission heavy trucks
- 4.3.2 Volatile diesel price environment impacting purchase cycles
- 4.3.3 Semiconductor shortages delaying ADAS/EV production
- 4.3.4 Stricter EU axle-weight rules limiting payload economics
- 4.4 Value / Supply-Chain Analysis
- 4.5 Regulatory Landscape
- 4.6 Technological Outlook
- 4.7 Porter's Five Forces Analysis
- 4.7.1 Bargaining Power of Suppliers
- 4.7.2 Bargaining Power of Consumers
- 4.7.3 Threat of New Entrants
- 4.7.4 Threat of Substitute Products
- 4.7.5 Intensity of Competitive Rivalry
5 Market Size & Growth Forecasts (Value (USD) and Volume (Units))
- 5.1 By Tonnage Type
- 5.1.1 10 to 15 T
- 5.1.2 More Than 15 T
- 5.2 By Class
- 5.2.1 Class 7
- 5.2.2 Class 8
- 5.3 By Propulsion Type
- 5.3.1 Diesel
- 5.3.2 Battery-Electric
- 5.3.3 Fuel-Cell Electric (FCEV)
- 5.3.4 Alternative Fuels (CNG, LNG, Biodiesel)
- 5.4 By Application
- 5.4.1 Construction and Mining
- 5.4.2 Freight and Logistics
- 5.4.3 Municipal and Utilities
- 5.4.4 Others
- 5.5 By Truck Body Type
- 5.5.1 Tractor-Trailer
- 5.5.2 Rigid Dump
- 5.5.3 Tanker
- 5.5.4 Others
- 5.6 By Sales Channel
- 5.6.1 OEM / First Purchase
- 5.6.2 Lease and Rental
- 5.6.3 After-market Retrofit
- 5.7 By Geography
- 5.7.1 North America
- 5.7.1.1 United States
- 5.7.1.2 Canada
- 5.7.1.3 Rest of North America
- 5.7.2 South America
- 5.7.2.1 Brazil
- 5.7.2.2 Argentina
- 5.7.2.3 Rest of South America
- 5.7.3 Europe
- 5.7.3.1 Germany
- 5.7.3.2 United Kingdom
- 5.7.3.3 France
- 5.7.3.4 Italy
- 5.7.3.5 Russia
- 5.7.3.6 Rest of Europe
- 5.7.4 Asia-Pacific
- 5.7.4.1 China
- 5.7.4.2 India
- 5.7.4.3 Japan
- 5.7.4.4 South Korea
- 5.7.4.5 Australia and New Zealand
- 5.7.4.6 Rest of Asia-Pacific
- 5.7.5 Middle East and Africa
- 5.7.5.1 Saudi Arabia
- 5.7.5.2 United Arab Emirates
- 5.7.5.3 Egypt
- 5.7.5.4 Turkey
- 5.7.5.5 South Africa
- 5.7.5.6 Rest of Middle East and Africa
- 5.7.1 North America
6 Competitive Landscape
- 6.1 Market Concentration
- 6.2 Strategic Moves
- 6.3 Market Share Analysis
- 6.4 Company Profiles (includes Global level Overview, Market level overview, Core Segments, Financials as available, Strategic Information, Market Rank/Share for key companies, Products and Services, and Recent Developments)
- 6.4.1 Daimler Truck Holding AG
- 6.4.2 Traton SE
- 6.4.3 Volvo Group
- 6.4.4 PACCAR Inc.
- 6.4.5 Dongfeng Motor Corporation
- 6.4.6 Tata Motors Ltd
- 6.4.7 FAW Group Corp.
- 6.4.8 CNHTC (Sinotruk)
- 6.4.9 Ashok Leyland Ltd
- 6.4.10 Isuzu Motors Ltd
- 6.4.11 Hino Motors Ltd
- 6.4.12 Navistar International
- 6.4.13 Iveco Group N.V.
- 6.4.14 Hyundai Motor Co.
- 6.4.15 Nikola Corporation
- 6.4.16 JAC Motors
- 6.4.17 Kamaz PJSC
- 6.4.18 Foton Motor Co. Ltd
7 Market Opportunities and Future Outlook
- 7.1 White-space and Unmet-Need Assessment
