
|
시장보고서
상품코드
1851091
5G 서비스 시장 : 시장 점유율 분석, 산업 동향, 통계, 성장 예측(2025-2030년)5G Services - Market Share Analysis, Industry Trends & Statistics, Growth Forecasts (2025 - 2030) |
||||||
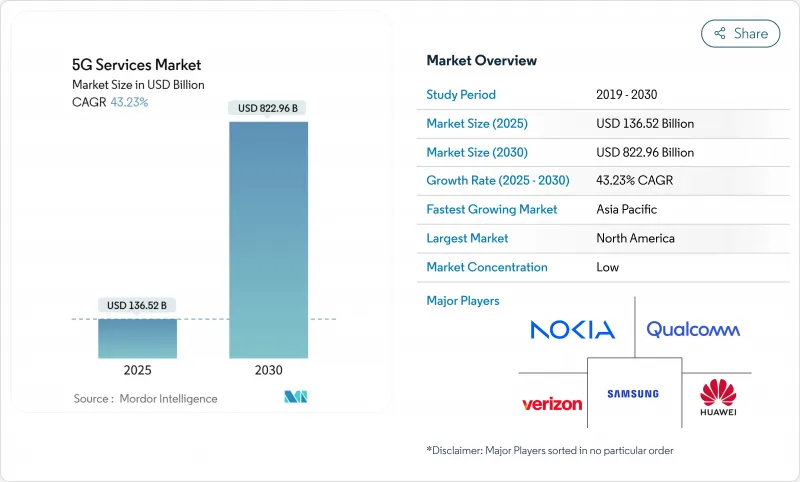
5G 서비스 시장은 2025년에 1,365억 2,000만 달러로 추정되며, 2030년에는 CAGR 43.23%를 반영하여 8,229억 6,000만 달러에 이를 것으로 예측됩니다.
이동통신사는 트래픽 기반 과금에서 지연, 처리량 및 보안 수준에 따라 할증료를 부과하는 경험 기반 과금으로 전환하고 있으며, 산업 분야의 사용자 1인당 평균 수익을 높일 수 있습니다. 제조, 의료, 물류는 실시간 자동화, 예측 유지보수, 원격조작을 지원하기 위해 사설 5G 네트워크를 채택하고 있습니다. 아시아태평양은 적극적인 주파수 대역의 해방과 대규모 5G-Advanced의 전개를 통해 기술적인 리더십을 유지하고 있으며, 북미는 깊은 미드밴드 주파수 대역 풀을 활용해 고정 무선 액세스(FWA)의 채용을 가속화하고 있습니다.
세계의 5G 서비스 시장의 동향과 인사이트
기업의 디지털 변혁 이용 사례
주요 하이라이트
- 모바일 데이터 트래픽은 2024년에 전년 대비 38% 증가하였으며, 2030년에는 8배 증가할 것으로 예상되어 4G 네트워크에 부담을 주어 5G 미드밴드 주파수 대역으로의 이행을 촉진합니다. 동영상 스트리밍은 이미 휴대폰 대역폭의 70% 이상을 소비하고 있으며, 이동통신사는 트래픽을 5G 독립형 코어로 오프로드하도록 촉구하고 있습니다. 5G 서비스 시장은 서비스 제공업체가 기가바이트당 비용을 절감하면서 높은 가격대에서 데이터 무제한 계획을 단계적으로 제공할 수 있기 때문에 이점을 누릴 수 있습니다. 스마트폰의 프로세서와 디스플레이가 개선됨에 따라 4K 모바일 비디오, 클라우드 게임, XR 기반 엔터테인먼트가 트래픽을 증가시켜 예측 CAGR 8.5%의 성장을 뒷받침합니다.
네트워크 슬라이싱 및 SLA 계층을 통한 수익 창출
상용 5G 네트워크 다운로드 속도의 중앙값은 미국에서 225Mbps, 중국에서 405Mbps로 4G 기록을 크게 웃돌고 있습니다. 소비자는 현재 안정적인 4K 스트리밍과 저지연 게임을 기대하고 있으며, 통신사업자는 선진국 시장에서 월별 ARPU에 5-10달러를 추가하는 프리미엄 스피드 티어를 시작하고 있습니다. 휴대단말 벤더는 2024년에 2억 8,000만대의 5G 대응 스마트폰을 출하하여 플래그십 부문의 81%를 차지했으며, 매스 마켓에의 대응을 굳혔습니다. 통신 사업자는 속도 기반 계획과 번들로 제공되는 클라우드 게임 경로를 통해 이러한 의지를 수익화하여 eMBB 수요로 인한 CAGR 6.2% 증가를 창출합니다. 경기장, 콘서트 장소, 교통 허브 등에서는 고밀도 트래픽을 유지하기 위해 5G 스몰셀에 대한 의존도가 높아지고 예측 가능한 처리량에 대한 지불 의향이 조기에 높아지고 있음이 입증되었습니다.
높은 도입 비용과 긴 투자 회수 기간
5G 기지국 1기의 비용은 10만-20만 달러로, mm파 유닛은 그 2배에 육박합니다. 세계 5G 인프라 투자액은 2025년 1조1,000억 달러를 넘어설 전망이나, 손익분기점은 8-10년인 경우가 많아 가격에 민감한 지역에서는 밸런스 시트가 늘어납니다. 일부 사업자는 절전 소프트웨어를 채택한 후에도 전기 요금이 23% 상승했다고 보고합니다. 이러한 압력은 KDDI와 소프트뱅크의 일본 내 공동 네트워크 구축과 같은 비용 공유 거래에 박차를 가하고 있습니다. T-모바일을 통한 UScellular의 44억 달러 인수와 같은 합병은 규모의 경제성 추구를 강화합니다.
부문 분석
강화된 모바일 광대역은 2024년 5G 서비스 시장에 64.20% 기여했습니다. 초고신뢰성 저지연 통신은 밀리초 이하의 지연에 의존하는 제조 자동화 및 원격 수술에 힘입어 CAGR 60.30%로 예측됩니다. Mobile World Live에 따르면 대규모 머신 통신은 스마트 시티 그리드에서 인기를 끌고 있으며, 셀룰러 IoT 링크는 2033년까지 75억에 이를 것으로 예측되고 있습니다.
URLLC는 산업계가 결정적인 성과를 보장하기 위해 대가를 지불하므로 프리미엄 수익화를 촉진합니다. URLLC 용도의 5G 서비스 시장의 규모는 병원 네트워크가 로봇 수술용 링크를 채택함에 따라 2030년까지 한 자릿수 후반의 점유율을 획득할 것으로 예측됩니다. RedCap 및 eRedCap 디바이스의 표준화는 IoT 칩셋 비용을 줄여 간소화된 산업용 센서의 상용화를 가속화하고 있습니다. 네트워크 슬라이싱은 낮은 데이터 속도의 장치에 전용 대역폭을 할당하여 물류 기업의 배터리 수명과 예측 가능성을 향상시킵니다.
지역 분석
아시아태평양은 2024년 세계 매출의 42.00%를 창출했으며, CAGR은 56.42%로 전 지역에서 최고 성장을 기록할 전망입니다. 중국 연통 베이징과 화웨이는 1,000만 명을 커버하는 5G-Advanced 네트워크를 가동시켜 주파수대 액세스, 저비용 하드웨어, 벤더와 오퍼레이터의 긴밀한 협력관계를 융합시킨 에코시스템을 구축하였습니다. 인도의 FWA 시장은 2027년까지 3,000만 명의 사용자를 목표로 하고 있으며, 유선 액세스를 누리고 있는 가구가 불과 11%에 불과한 이 나라에서 충족되지 않은 고정 광대역 수요를 반영하고 있습니다.
북미에서는 풍부한 미드밴드 주파수 대역과 적극적인 FWA 확장으로 2027년 5G 계약 보급률 예측은 이미 90%로 성장을 지속하고 있습니다. T-모바일의 643만 명의 FWA 고객과 Verizon의 430만 명의 FWA 고객은 무선이 광섬유를 대체하는 주류가 되었다는 것을 시사하고 있습니다. 캐나다 로저스는 지역 최초의 네트워크 슬라이싱 시험을 실시해 기업용 보증 서비스에 길을 열었습니다.
유럽은 단독 커버리지로는 후발주자이며 2024년 후반의 SA 가용성은 불과 2%였습니다. 그러나 독일, 영국, 스페인은 전개를 가속화하고 있으며, 보다폰과 Three의 합병(202억 8,000만 달러)에 의해 SA전개를 위한 충실한 자본풀이 전망되고 있습니다. 중동 및 아프리카에서는 이집트가 2025년 서비스 시작을 위해 6억 900만 달러를 투자했고 남아프리카는 1,080만 명의 사용자를 획득하여 인구 커버리지율이 50%를 넘었습니다. 라틴아메리카는 꾸준히 확대되고 있으며, 브라질은 1,300개 도시에서 5G 상용 서비스를 시작했고, 코스타리카는 2025년 2월 4대역에서 주파수를 할당했습니다.
기타 혜택
- 엑셀 형식 시장 예측(ME) 시트
- 3개월간의 애널리스트 서포트
목차
제1장 서론
- 조사의 전제조건과 시장의 정의
- 조사 범위
제2장 조사 방법
제3장 주요 요약
제4장 시장 인사이트
- 시장 개요
- 시장 성장 촉진요인
- 모바일 데이터 트래픽의 폭발적인 증가
- eMBB 서비스에 대한 소비자의 높은 수요
- 기업의 디지털 변혁의 이용 사례
- 정부에 의한 주파수 대역 해방의 대처
- CBRS와 로컬 라이선스 대역에서 개인용 5G의 보급
- 네트워크 슬라이스와 SLA 티어에 의한 수익화
- 시장 성장 억제요인
- 높은 도입 비용과 긴 ROI
- 단편적이고 지연된 주파수 정책
- 신흥 시장에서의 5G 디바이스의 준비 상황이 한정적
제5장 시장 역학
- 밸류체인 분석
- 규제 상황
- 기술의 전망
- Porter's Five Forces 분석
- 신규 참가업체의 위협
- 구매자의 협상력
- 공급기업의 협상력
- 대체품의 위협
- 경쟁 기업간 경쟁 관계
제6장 시장 규모와 성장 예측
- 서비스 유형별
- 고속 대용량(eMBB)
- 초고신뢰 저지연 통신(URLLC)
- 대규모 머신형 통신(mMTC)
- 네트워크 아키텍처별
- 비독립형(NSA) 5G
- 독립형(SA) 5G
- 최종 사용자 업계별
- IT 및 통신
- 미디어 및 엔터테인먼트
- 자동차 및 모빌리티
- 에너지 및 유틸리티
- 항공우주 및 방위
- 제조업
- 의료
- 기타 산업
- 지역별
- 북미
- 미국
- 캐나다
- 멕시코
- 남미
- 브라질
- 아르헨티나
- 기타 남미
- 유럽
- 독일
- 영국
- 프랑스
- 이탈리아
- 러시아
- 기타 유럽
- 아시아태평양
- 중국
- 인도
- 일본
- 한국
- ASEAN
- 기타 아시아태평양
- 중동 및 아프리카
- 중동
- 사우디아라비아
- 아랍에미리트(UAE)
- 튀르키예
- 기타 중동
- 아프리카
- 남아프리카
- 나이지리아
- 기타 아프리카
- 북미
제7장 경쟁 구도
- 시장 집중도
- 전략적 동향
- 시장 점유율 분석
- 기업 프로파일
- China Mobile Ltd.
- Verizon Communications Inc.
- ATandT Inc.
- T-Mobile US Inc.
- China Telecom Corp. Ltd.
- Telefonaktiebolaget LM Ericsson
- Nokia Corp.
- Huawei Technologies Co. Ltd.
- Deutsche Telekom AG
- Vodafone Group Plc
- Orange SA
- Telefonica SA
- BT Group plc
- Swisscom AG
- Telstra Corp. Ltd.
- SK Telecom Co. Ltd.
- KT Corp.
- Rakuten Mobile Inc.
- Reliance Jio Infocomm Ltd.
- Qualcomm Inc.(5G as-a-Service platforms)
- Samsung Electronics Co. Ltd.(5G networks)
제8장 시장 기회와 미래 전망
- 시장 기회와 미래 전망
The 5G services market generated USD 136.52 billion in 2025 and is forecast to reach USD 822.96 billion by 2030, reflecting a 43.23% CAGR.
Standalone 5G rollouts, the commercial debut of network slicing, and a rapid shift from consumer to enterprise use cases underpin this expansion.Operators are moving away from traffic-based billing and toward experience-based pricing that charges premiums for assured latency, throughput, and security levels, boosting average revenue per user in industrial verticals. Manufacturing, healthcare, and logistics are adopting private 5G networks to support real-time automation, predictive maintenance, and remote operations-use cases that cannot be handled by legacy Wi-Fi. Asia Pacific retains technology leadership through aggressive spectrum releases and large-scale 5G-Advanced deployments, while North America leverages a deep mid-band spectrum pool to accelerate fixed wireless access (FWA) adoption.
Global 5G Services Market Trends and Insights
Enterprise Digital-Transformation Use Cases
Key Highlights
- Mobile-data traffic rose 38% year-on-year in 2024 and is tracking toward an eight-fold increase by 2030, straining 4 G networks and driving migration to 5 G mid-band spectrum. Video streaming already consumes more than 70% of cellular bandwidth, encouraging operators to off-load traffic to 5G stand-alone cores where higher spectral efficiency lowers cost per bit. eMBB services now average 38 GB per subscriber each month in South Korea, a figure that would saturate legacy radios. The 5G services market benefits because service providers can tier unlimited-data plans at higher price points while still reducing the cost per gigabyte. As smartphone processors and displays improve, 4K mobile video, cloud gaming, and XR-based entertainment will amplify traffic, reinforcing the 8.5% uplift in forecast CAGR.
Monetization via Network Slicing and SLA Tiers
Commercial 5 G networks deliver median download speeds of 225 Mbps in the United States and 405 Mbps in China, well above 4 G records. Consumers now expect consistent 4K streaming and low-latency gaming, prompting carriers to launch premium-speed tiers that add USD 5-10 to monthly ARPU in developed markets. Handset vendors shipped 280 million 5 G-capable smartphones in 2024, 81% of the flagship segment, cementing mass-market readiness. Operators monetize this appetite with speed-based plans and bundled cloud-gaming passes, producing the 6.2% CAGR lift attributed to eMBB demand. Stadiums, concert venues, and transportation hubs increasingly rely on 5 G small cells to sustain dense traffic, proving early willingness to pay for predictable throughput.
High Deployment Cost and Long ROI Horizons
Operators face steep capital commitments: a single 5G base-station costs USD 100,000-200,000, with millimeter-wave units up to twice as expensive. Global 5G infrastructure spend will top USD 1.1 trillion in 2025, yet breakeven is often eight to ten years, stretching balance sheets in price-sensitive regions. Energy outlays are also rising; some operators report 23% hikes in electricity bills even after adopting power-saving software. These pressures spur cost-sharing deals such as KDDI and SoftBank's joint network build in Japan, which aims to lower expenses by 30-40% through site co-location. Mergers like T-Mobile's USD 4.4 billion acquisition of UScellular reinforce the quest for scale economies.
Other drivers and restraints analyzed in the detailed report include:
- Enterprise Digital-Transformation Use Cases
- Government Spectrum-Release Initiatives
- Limited 5G Device Readiness in Emerging Markets
For complete list of drivers and restraints, kindly check the Table Of Contents.
Segment Analysis
Enhanced mobile broadband contributed 64.20% to the 5G services market in 2024, reflecting its foundational role in consumer video and gaming. Ultra-reliable low-latency communications is forecast to deliver a 60.30% CAGR, buoyed by manufacturing automation and telesurgery, which depend on sub-millisecond latency. Massive machine-type communications is gaining traction in smart-city grids, with cellular IoT links predicted to hit 7.5 billion by 2033, according to Mobile World Live.
URLLC drives premium monetization because industries will pay to ensure deterministic performance. The 5G services market size for URLLC applications is projected to capture a high-single-digit share by 2030 as hospital networks adopt robotic-surgery links. Standardization of RedCap and eRedCap devices keeps IoT chipset costs down, hastening commercial readiness for simplified industrial sensors. Network slicing allocates dedicated bandwidth to low-data-rate devices, improving battery life and predictability for logistics firms.
The 5G Service Market Report is Segmented by Service Type (Enhanced Mobile Broadband (eMBB), Ultra-Reliable Low-Latency Comms (URLLC), and More), Network Architecture (Non-Standalone (NSA) 5G and Standalone (SA) 5G), End-User Industry (IT and Telecom, Media and Entertainment, Automotive and Mobility, and More), and Geography. The Market Forecasts are Provided in Terms of Value (USD).
Geography Analysis
Asia Pacific generated 42.00% of global revenue in 2024 and is on track for a 56.42% CAGR, the fastest among all regions. China Unicom Beijing and Huawei activated a 5G-Advanced network covering 10 million people, highlighting an ecosystem that blends spectrum access, low-cost hardware, and tight vendor-operator collaboration huawei.com. India's FWA market aims for 30 million users by 2027, reflecting unmet fixed-broadband demand in a nation where only 11% of households enjoy wired access.
North America already records 90% 5G subscription penetration forecasts for 2027, driven by abundant mid-band spectrum and aggressive FWA scaling. T-Mobile's 6.43 million FWA customers and Verizon's 4.3 million illustrate how wireless has become a mainstream alternative to fiber. Canada's Rogers performed the region's first network-slicing trial, paving the way for guaranteed service to enterprises.
Europe lags in standalone coverage, with only 2% SA availability in late 2024. Yet Germany, the UK, and Spain accelerate deployment, while the USD 20.28 billion Vodafone-Three merger promises deeper capital pools for SA rollouts. In the Middle East and Africa, Egypt invested USD 609 million to prepare for 2025 launches, and South Africa reaches over 50% population coverage with 10.8 million users. Latin America is steadily expanding, with Brazil's commercial 5G live in 1,300 cities and Costa Rica allocating spectrum across four bands in February 2025.
- China Mobile Ltd.
- Verizon Communications Inc.
- ATandT Inc.
- T-Mobile US Inc.
- China Telecom Corp. Ltd.
- Telefonaktiebolaget LM Ericsson
- Nokia Corp.
- Huawei Technologies Co. Ltd.
- Deutsche Telekom AG
- Vodafone Group Plc
- Orange S.A.
- Telefonica S.A.
- BT Group plc
- Swisscom AG
- Telstra Corp. Ltd.
- SK Telecom Co. Ltd.
- KT Corp.
- Rakuten Mobile Inc.
- Reliance Jio Infocomm Ltd.
- Qualcomm Inc. (5G as-a-Service platforms)
- Samsung Electronics Co. Ltd. (5G networks)
Additional Benefits:
- The market estimate (ME) sheet in Excel format
- 3 months of analyst support
TABLE OF CONTENTS
1 INTRODUCTION
- 1.1 Study Assumptions and Market Definition
- 1.2 Scope of the Study
2 RESEARCH METHODOLOGY
3 EXECUTIVE SUMMARY
4 MARKET INSIGHTS
- 4.1 Market Overview
- 4.2 Market Drivers
- 4.2.1 Exploding mobile data traffic
- 4.2.2 High consumer demand for eMBB services
- 4.2.3 Enterprise digital-transformation use-cases
- 4.2.4 Government spectrum-release initiatives
- 4.2.5 Private-5G uptake in CBRS and local-licence bands
- 4.2.6 Monetisation via network slicing and SLA tiers
- 4.3 Market Restraints
- 4.3.1 High deployment cost and long ROI horizons
- 4.3.2 Fragmented and delayed spectrum policy
- 4.3.3 Limited 5G device readiness in emerging markets
5 MARKET DYNAMICS
- 5.1 Value Chain Analysis
- 5.2 Regulatory Landscape
- 5.3 Technological Outlook
- 5.4 Porter's Five Forces Analysis
- 5.4.1 Threat of New Entrants
- 5.4.2 Bargaining Power of Buyers
- 5.4.3 Bargaining Power of Suppliers
- 5.4.4 Threat of Substitutes
- 5.4.5 Intensity of Competitive Rivalry
6 MARKET SIZE AND GROWTH FORECASTS (VALUE)
- 6.1 By Service Type
- 6.1.1 Enhanced Mobile Broadband (eMBB)
- 6.1.2 Ultra-Reliable Low-Latency Comms (URLLC)
- 6.1.3 Massive Machine-Type Comms (mMTC)
- 6.2 By Network Architecture
- 6.2.1 Non-Standalone (NSA) 5G
- 6.2.2 Standalone (SA) 5G
- 6.3 By End-User Industry
- 6.3.1 IT and Telecom
- 6.3.2 Media and Entertainment
- 6.3.3 Automotive and Mobility
- 6.3.4 Energy and Utilities
- 6.3.5 Aerospace and Defense
- 6.3.6 Manufacturing
- 6.3.7 Healthcare
- 6.3.8 Other Industries
- 6.4 By Geography
- 6.4.1 North America
- 6.4.1.1 United States
- 6.4.1.2 Canada
- 6.4.1.3 Mexico
- 6.4.2 South America
- 6.4.2.1 Brazil
- 6.4.2.2 Argentina
- 6.4.2.3 Rest of South America
- 6.4.3 Europe
- 6.4.3.1 Germany
- 6.4.3.2 United Kingdom
- 6.4.3.3 France
- 6.4.3.4 Italy
- 6.4.3.5 Russia
- 6.4.3.6 Rest of Europe
- 6.4.4 Asia Pacific
- 6.4.4.1 China
- 6.4.4.2 India
- 6.4.4.3 Japan
- 6.4.4.4 South Korea
- 6.4.4.5 ASEAN
- 6.4.4.6 Rest of Asia Pacific
- 6.4.5 Middle East and Africa
- 6.4.5.1 Middle East
- 6.4.5.1.1 Saudi Arabia
- 6.4.5.1.2 UAE
- 6.4.5.1.3 Turkey
- 6.4.5.1.4 Rest of Middle East
- 6.4.5.2 Africa
- 6.4.5.2.1 South Africa
- 6.4.5.2.2 Nigeria
- 6.4.5.2.3 Rest of Africa
- 6.4.1 North America
7 COMPETITIVE LANDSCAPE
- 7.1 Market Concentration
- 7.2 Strategic Moves
- 7.3 Market Share Analysis
- 7.4 Company Profiles {(includes Global level Overview, Market level overview, Core Segments, Financials as available, Strategic Information, Market Rank/Share for key companies, Products and Services, and Recent Developments)}
- 7.4.1 China Mobile Ltd.
- 7.4.2 Verizon Communications Inc.
- 7.4.3 ATandT Inc.
- 7.4.4 T-Mobile US Inc.
- 7.4.5 China Telecom Corp. Ltd.
- 7.4.6 Telefonaktiebolaget LM Ericsson
- 7.4.7 Nokia Corp.
- 7.4.8 Huawei Technologies Co. Ltd.
- 7.4.9 Deutsche Telekom AG
- 7.4.10 Vodafone Group Plc
- 7.4.11 Orange S.A.
- 7.4.12 Telefonica S.A.
- 7.4.13 BT Group plc
- 7.4.14 Swisscom AG
- 7.4.15 Telstra Corp. Ltd.
- 7.4.16 SK Telecom Co. Ltd.
- 7.4.17 KT Corp.
- 7.4.18 Rakuten Mobile Inc.
- 7.4.19 Reliance Jio Infocomm Ltd.
- 7.4.20 Qualcomm Inc. (5G as-a-Service platforms)
- 7.4.21 Samsung Electronics Co. Ltd. (5G networks)
8 MARKET OPPORTUNITIES AND FUTURE OUTLOOK
- 8.1 White-space and Unmet-need Assessment
