
|
시장보고서
상품코드
1851094
고정 무선 액세스 시장 : 시장 점유율 분석, 산업 동향, 통계, 성장 예측(2025-2030년)Fixed Wireless Access - Market Share Analysis, Industry Trends & Statistics, Growth Forecasts (2025 - 2030) |
||||||
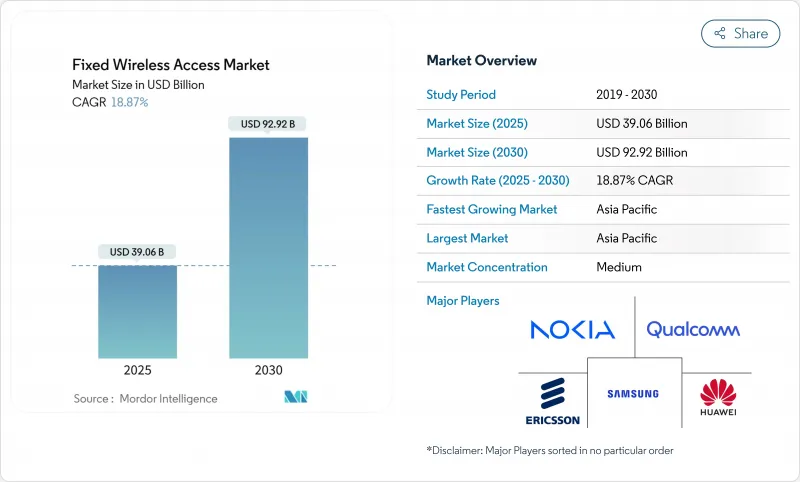
고정 무선 액세스 시장 규모는 2025년 390억 6,000만 달러로 추정되고, 2030년에는 927억 2,000만 달러에 이를 것으로 예측되며, CAGR 18.87%로 성장하여, 고정 무선 액세스 시장 규모가 가장 빠르게 확대되는 광대역 분야 중 하나임을 뒷받침하고 있습니다.
확대에는 세 개의 기둥이 있습니다. 기존의 모바일 타워를 가정용 광대역으로 재사용하는 5G 전개의 가속, 농촌에서 저렴한 가격의 라스트마일 접속에 대한 수요 증가, 광섬유에 가까운 속도를 실현하는 고객 가내 기기의 지속적인 기술 혁신입니다. 북미와 아시아태평양 사업자들은 기존의 가정용 광섬유에서 고정 무선으로 자금을 돌려 도입 스케줄을 단축하고 가구당 비용을 대폭 절감했습니다. 서브 6GHz 대역의 주파수 대역이 할당되고 도시 지역의 밀집 지역에서 mm 파가 시작됨에 따라 공급자는 커버리지와 용량의 균형을 유연하게 조정할 수 있습니다. 한편 산업용 IoT의 파일럿은 고정 무선 액세스 링크가 공장 및 물류 허브를 위한 안전하고 저지연의 백본이 되어 새로운 수익원이 탄생하고 있습니다.
세계의 고정 무선 액세스 시장 동향 및 인사이트
기가비트급 FWA를 가속화하는 5G 전개
5G의 광범위한 전개로 이동 통신사는 고정 무선 액세스를 동일한 무선 네트워크에 계층화하고 모바일 매크로 사이트를 이웃 광대역 노드로 변경할 수 있습니다. 미국의 통신 사업자들은 광대역의 순증수의 대부분이 고정 무선 패키지에 의한 것으로 보고하고 있으며, 고정 무선 액세스 시장이 케이블의 전통적인 기반을 파괴하고 있다고 강조하고 있습니다. 매시브 MIMO와 빔포밍에 대한 투자는 전망 밖의 환경에서도 서비스를 유지하면서 실외 CPE의 처리량을 향상시킵니다. 에릭슨의 소프트웨어 업그레이드는 새로운 하드웨어 없이 사용 가능 범위를 확대하여 지역에서의 커버리지를 간소화합니다. 노키아와 같은 공급업체는 최대 7km의 거리에서 1Gbps의 링크를 보유하는 mmWave 수신기를 전시하여 인구 밀도가 높은 도시와 인구가 적은 주변 모두에서 실행 가능함을 입증했습니다. 이러한 진보는 고객 경험을 섬유 수준으로 끌어올려 가정과 기업의 보급을 촉진합니다.
지방 광대역 촉진 프로그램
공적 자금은 광섬유 트렌치에 의해 우회된 마을의 무선 액세스 장비와 CPE를 맡아 디지털 디바이드를 좁히고 있습니다. 미국에서는 연방 정부와 주로부터의 보조금이 서비스가 충분하지 않은 인구 조사 블록에 수십억 달러나 투입되어, 타워가 몇 달이 아닌 몇 주 안에 배치되기 때문에 고정 무선 액세스가 우선되는 경우가 종종 있습니다. 워싱턴 주 규제 당국은 광섬유에 비해 속도 트레이드 오프가 있지만 FWA 솔루션이 저렴한 비용으로 신속하게 설치할 수 있음을 확인했습니다. 유럽의 '디지털 10년' 의제는 무선 인터넷 서비스 제공업체를 지역 대역으로 유치하는 유연한 주파수 규칙을 통해 이러한 접근 방식을 반영합니다. 브래틀 그룹의 비용 편익 연구에서 고정 라디오를 포함한 광대역의 확대는 자산 가치와 소득 향상에 수조 달러를 이끌어 내고 정책 지원을 더욱 강화하고 있습니다.
주파수 대역 부족 및 규제 불확실성
미드밴드 주파수 대역은 커버 범위와 커패시턴스 스위트 스팟에 위치하지만, 대부분은 레거시 용도에 묶여 있거나 기존 방송사에 의해 경쟁되고 있습니다. 미국의 3GHz 대역의 저역을 둘러싼 로비 전투는 장기적인 정책 결정이 사업자의 투자를 정체시키는 방법을 이야기하고 있습니다. Google의 스펙트럼 액세스 시스템과 같은 동적 공유 시스템은 의도적으로 활용할 수 있지만 기기 생태계는 여전히 명확한 라이선스에 의존합니다. 지역마다 다른 규칙은 세계 장비 설계를 복잡하게 하고, 비용을 상승시키며, 대량 생산을 지연시킵니다. NTIA의 국가 스펙트럼 전략을 포함한 국가 로드맵은 추가 할당을 약속하지만 경매 지연과 우선 순위 변화로 인해 불확실성이 남아 있습니다.
부문 분석
2024년 고정 무선 액세스 시장에서는 네트워크 전개의 핵심이 되는 무선기나 CPE에 대한 초기 단계에서의 집중적인 투자에 의해 하드웨어가 65%의 점유율을 유지했습니다. 실내용 디바이스는 출하 대수의 60%를 차지하지만, 옥외용 모델은 단가가 높고, 전문적인 설치가 필요하기 때문에 수익의 대부분을 차지합니다. 사업자와 공급업체는 열, 안테나 게인 및 라우터 소프트웨어의 기술 혁신을 계속하여 Wi-Fi 메쉬 키트와 유사한 자체 설치 경험을 고객에게 제공합니다. 하드웨어로 인한 고정 무선 액세스 시장 규모는 구독보다 느린 속도로 확대될 것으로 예측됩니다.
서비스 분야는 2030년까지의 CAGR이 19.60%로 성장이 전망되어, 프로바이더가 매니지드 Wi-Fi, 오버 더 톱 비디오, 클라우드 시큐리티 번들로 다양화됨에 따라 고정 무선 액세스 업계의 다른 분야를 상회합니다. 40% 이상의 사업자가 광섬유 등급 계층을 모방한 속도 기반 요금 메뉴로 이동하여 사용자당 평균 수익을 가속화하고 있습니다. 네트워크 API는 곧 라이브 이벤트 및 e스포츠 토너먼트 중에 온디맨드로 처리량을 높이고 서비스 마진을 더욱 높일 것입니다. 보급이 대규모가 되면 장비 판매보다 지속적인 요금이 수익력을 결정하게 됩니다.
2024년에는 주택용 광대역이 매출 전체의 52%를 차지했는데, 이는 Tier 1 모바일 통신 사업자에 의한 적극적인 소비자 캠페인을 반영하고 있습니다. 캠페인은 종종 스트리밍 게재 계약과 비용이 0인 하드웨어를 번들로 제공하므로 해지가 억제됩니다. 이와는 대조적으로 2030년까지 연평균 복합 성장률(CAGR)은 22.32%로 성장할 전망입니다. 공장은 생산 라인과 엣지 서버 사이에 고정 무선 게이트웨이를 삽입하여 실시간 머신 비전, 로봇 공학 및 안전 시스템을 지원합니다. 평가판에서는 캐리어 어그리게이션 스펙트럼을 사용하여 중앙값에서 하향 링크 648Mbps, 피크에서 1Gbps를 초과하는 것으로 입증되었습니다. 이러한 지표는 자동차 및 반도체 공장에서 일반적인 엄격한 가용성 목표를 충족합니다.
퀵 서비스 레스토랑과 같은 상업 시설에서는 POS 시스템과 디지털 간판을 연결하므로 신속한 출시와 유연한 계약이 필요합니다. 또한 교육 및 헬스케어 현장에서는 도랑을 파는 허가보다 신속한 도입이 선호됩니다. 따라서 업계 각사는 사설 5G 코어와 제로 터치 프로비저닝을 통합한 수직 패키지를 사용자 정의하고 있습니다.
지역 분석
아시아태평양은 중국, 한국, 일본에서 5G 인구 커버율이 85%를 넘어서 37%의 매출 점유율을 유지하고 CAGR은 21.07%로 가장 빠른 성장이 전망됩니다. 인도의 상위 2개 회사는 AirFiber 서비스를 1일 단위의 유료 바우처로 번들하여 1년 안에 수백만 명의 최초 광대역 사용자를 획득했습니다. 디지털 인디아 하에서 정부의 우대 조치는 서비스가 제공되지 않는 마을 타워 시설의 최대 80%를 환불하고 전개를 더욱 가속화하고 있습니다. 고정 무선 액세스 시장의 기업은 공급망을 단축하는 지역 전체의 장치 제조 기지에서도 이익을 얻고 있습니다.
북미는 대규모 5G 독립형 코어와 주파수 정책에 밀려있습니다. 미국의 고정 무선 액세스 시장 규모는 통신 사업자가 위성 서비스에서 해방된 미드밴드의 보유 주파수를 재전개함에 따라 상승하고 있습니다. 사업자는 분기별로 60만에서 70만 건의 순 증가를 정기적으로 보고하고 있으며, 이 동향은 케이블의 기존 사업자에게 대칭 계층의 도입을 강요하고 있습니다. 캐나다의 농촌 지역에서 광대역 추진 활동은 영구 동토에 섬유 그루브를 파는 것이 현실적이지 않은 농장 및 관광 롯지의 옥상 무선에 자금을 제공합니다.
유럽은 단편적인 패턴을 보여줍니다. 섬유의 커버율이 높은 북부 국가들은 주로 중복성을 위해 고정 무선을 사용하는 반면, 남부와 동부 국가들은 구리선 업그레이드를 도약하기 위해 고정 무선을 활용하고 있습니다. 26GHz 대역의 규제 유연성은 국경을 넘는 장비의 조화를 촉진하고 CPE 비용을 낮춥니다. 중동 및 아프리카의 신흥 시장은 라스트 원마일 액세스에 무선 우선 솔루션을 채택하고 있습니다. 국가의 광대역 계획에서 2년 이내에 고정 무선이 학교와 클리닉을 연결하는 주요 방법으로 취급되기 때문에 고정 무선 액세스 시장은 대륙 전체의 디지털 인클루전의 촉매로 자리매김하고 있습니다.
기타 혜택 :
- 엑셀 형식 시장 예측(ME) 시트
- 3개월간의 애널리스트 서포트
목차
제1장 서론
- 조사의 전제조건 및 시장 정의
- 조사 범위
제2장 조사 방법
제3장 주요 요약
제4장 시장 상황
- 시장 개요
- 시장 성장 촉진요인
- 기가비트급 FWA를 가속시키는 5G 전개
- 지방의 광대역 촉진 프로그램
- 파이버를 대체하는 비용 효율적인 라스트 마일로서의 FWA
- 엔터프라이즈 SD-WAN 백업 연결 수요
- 시장 성장 억제요인
- 스펙트럼의 희소성 및 규제의 불확실성
- mmWave의 고밀도화 CAPEX
- 밸류체인 분석
- 규제 상황
- 기술의 전망
- FWA 도입을 위한 주요 인에이블러
- 벤더의 대처 및 파트너십
- 비즈니스 고려 사항 및 전제조건
- FWA와 FTTH/FTTdp의 비교
- 농촌, 반도시, 도시의 이용 사례 모델
- Porter's Five Forces 분석
- 공급기업의 협상력
- 구매자의 협상력
- 신규 참가업체의 위협
- 대체품의 위협
- 경쟁 기업 간 경쟁 관계
제5장 시장 규모 및 성장 예측
- 유형별
- 하드웨어
- 소비자용 기기(CPE)
- 액세스 유닛(펨토 및 피코셀)
- 서비스
- 하드웨어
- 용도별
- 주택용
- 상업용
- 산업용
- 주파수 대역별
- 서브 6GHz
- mm파(24GHz 이상)
- 전개 모드별
- 실내 CPE
- 옥외 CPE
- 지역별
- 북미
- 남미
- 유럽
- 아시아태평양
- 중동 및 아프리카
제6장 경쟁 구도
- 시장 집중도
- 전략적 동향
- 시장 점유율 분석
- 기업 프로파일
- Huawei Technologies Co. Ltd.
- Nokia Corporation
- Ericsson AB
- Qualcomm Technologies Inc.
- Samsung Electronics Co. Ltd.
- Verizon Communications Inc.
- ATandT Inc.
- T-Mobile US Inc.
- US Cellular Corp.
- Airspan Networks Inc.
- Siklu Communication Ltd.
- Starry Group Holdings Inc.
- Arqiva Ltd.
- Inseego Corp.
- ZTE Corporation
- Deutsche Telekom AG
- Vodafone Group Plc
- Telstra Corp. Ltd.
- Orange SA
- Globe Telecom Inc.
제7장 시장 기회 및 향후 전망
AJY 25.11.12The fixed wireless access market is valued at USD 39.06 billion in 2025 and is forecast to reach USD 92.72 billion by 2030, reflecting an 18.87% CAGR and confirming the fixed wireless access market size as one of the most rapidly expanding broadband segments.

Expansion rests on three pillars: accelerated 5G roll-outs that repurpose existing mobile towers for home broadband, growing demand for affordable last-mile connectivity in rural districts, and continuous innovation in customer-premises equipment that delivers near-fiber speeds. Operators in North America and Asia Pacific have redirected capital from traditional fiber-to-the-home toward fixed wireless, trimming deployment timelines and reducing per-household costs by wide margins. Spectrum allocations in Sub-6 GHz, coupled with millimeter-wave launches in dense urban zones, give providers the flexibility to balance coverage and capacity. Meanwhile, industrial IoT pilots are turning fixed wireless access links into secure, low-latency backbones for factories and logistics hubs, thereby opening fresh revenue streams.
Global Fixed Wireless Access Market Trends and Insights
5G Roll-out Accelerating Gigabit-class FWA
Widespread 5G deployment allows operators to layer fixed wireless access on the same radio network, turning mobile macro sites into neighborhood broadband nodes. U.S. carriers report the majority of net broadband additions coming from fixed wireless packages, underscoring how the fixed wireless access market is eating into cable's traditional base. Investments in massive MIMO and beamforming raise outdoor CPE throughput while sustaining service in non-line-of-sight environments. Ericsson software upgrades extend usable range without new hardware, simplifying rural coverage. Vendors such as Nokia have showcased mmWave receivers that hold a 1 Gbps link at distances up to 7 km, proving viability in both dense cities and sparsely populated fringes. Taken together, these advances lift customer experience to fiber-like benchmarks and boost adoption across homes and enterprises.
Rural Broadband Stimulus Programmes
Public funding is narrowing digital divides by underwriting radio access equipment and CPE for towns bypassed by fiber trenching. In the United States, federal and state grants funnel billions into unserved census blocks, and fixed wireless access often receives priority because towers are deployed in weeks rather than months. Washington State regulators confirm that FWA solutions can be installed rapidly at lower cost, albeit with modest speed trade-offs compared with fiber. Europe's Digital Decade agenda mirrors this approach through flexible spectrum rules that invite wireless internet service providers into rural bands. Cost-benefit studies from The Brattle Group link broadband expansion, including fixed wireless, to trillions in property-value and income gains, fueling more policy support.
Spectrum Scarcity & Regulatory Uncertainty
Mid-band spectrum sits at the sweet spot between coverage and capacity, yet much of it is tied up in legacy use or contested by incumbent broadcasters. Lobbying battles over the lower 3 GHz block in the U.S. illustrate how protracted policymaking can stall operator investment. Dynamic sharing systems such as Google's Spectrum Access System allow opportunistic use, but device ecosystems still rely on clear, licensed holdings. Varied regional rules complicate global equipment design, raising costs and slowing volume manufacturing. Although national road maps, including the NTIA National Spectrum Strategy, promise additional allocations, uncertainty lingers through auction delays and shifting priorities.
Other drivers and restraints analyzed in the detailed report include:
- FWA as Cost-effective Last-mile Alternative to Fibre
- Enterprise SD-WAN Back-up Connectivity Demand
- High mmWave Densification CAPEX
For complete list of drivers and restraints, kindly check the Table Of Contents.
Segment Analysis
Hardware retained a 65% share of the fixed wireless access market in 2024 thanks to intensive early-stage spending on radios and CPE that anchor network roll-outs. Indoor devices make up 60% of units shipped, while outdoor models dominate revenue because of higher unit pricing and professional installation. Operators and vendors continue to innovate on thermals, antenna gains, and router software, giving customers a self-install experience that parallels Wi-Fi mesh kits. The fixed wireless access market size attributable to hardware is projected to expand, yet at a slower clip than subscriptions.
The services segment is set for a 19.60% CAGR through 2030, outstripping the rest of the fixed wireless access industry as providers diversify into managed Wi-Fi, over-the-top video, and cloud security bundles. More than 40% of operators have migrated to speed-based tariff menus that mimic fiber grade tiers, accelerating average revenue per user. Network APIs will soon enable on-demand throughput boosts during live events or e-sports tournaments, further lifting service margins. As adoption reaches scale, recurring fees rather than equipment sales will define earnings power.
Residential broadband accounted for 52% of overall revenue in 2024, reflecting aggressive consumer campaigns by Tier-1 mobile carriers. Promotions often bundle streaming subscriptions and zero-cost hardware, which compresses churn. Industrial deployments, in contrast, record a 22.32% CAGR to 2030. Factories insert fixed wireless gateways between production lines and edge servers, supporting real-time machine vision, robotics, and safety systems. Trials have demonstrated a median downlink of 648 Mbps and peaks above 1 Gbps using carrier-aggregated spectrum. These metrics satisfy stringent availability targets common in automotive and semiconductor plants.
Commercial sites such as quick-service restaurants rely on fast turn-ups and flexible contracts to connect point-of-sale systems and digital signage. Education and healthcare settings also favor rapid deployment over trenching permits. Consequently, fixed wireless access market players tailor vertical packages that integrate private 5 G cores with zero-touch provisioning.
The Fixed Wireless Access Market Report is Segmented by Type (Hardware [Consumer Premise Equipment (CPE), Access Units [Femto and Picocells]] and Services), Application (Residential, Commercial, and Industrial), Frequency Band (Sub-6 GHz and MmWave (above 24 GHz), Deployment Mode (Outdoor CPE and Indoor CPE), and Geography. The Market Forecasts are Provided in Terms of Value (USD).
Geography Analysis
Asia Pacific keeps a 37% revenue share and posts the fastest 21.07% CAGR as 5 G population coverage exceeds 85% in China, South Korea, and Japan. India's top two operators have bundled AirFiber services with pay-per-day vouchers, capturing millions of first-time broadband users in less than a year. Government incentives under Digital India reimburse up to 80% of tower equipment in unserved villages, further accelerating roll-out. Fixed wireless access market players also benefit from device-manufacturing hubs across the region that shorten supply chains.
North America follows, fueled by large-scale 5 G standalone cores and supportive spectrum policy. The fixed wireless access market size in the United States is climbing as telecoms redeploy mid-band holdings cleared from satellite services. Operators routinely report 600,000 to 700,000 net additions per quarter, a trend that has forced cable incumbents to introduce symmetrical tiers. Canada's rural broadband drive funds rooftop radios for farms and tourist lodges where fiber trenching through permafrost is impractical.
Europe shows a fragmented pattern. Northern nations with high fiber coverage use fixed wireless mainly for redundancy, while Southern and Eastern countries leverage it to leapfrog copper upgrades. Regulatory flexibility in the 26 GHz band encourages cross-border equipment harmonization, which lowers CPE cost. Emerging markets in the Middle East and Africa rely on wireless first solutions for last-mile access. National broadband plans treat fixed wireless as the primary method to connect schools and clinics within two years, positioning the fixed wireless access market as a catalyst for digital inclusion across the continent.
- Huawei Technologies Co. Ltd.
- Nokia Corporation
- Ericsson AB
- Qualcomm Technologies Inc.
- Samsung Electronics Co. Ltd.
- Verizon Communications Inc.
- ATandT Inc.
- T-Mobile US Inc.
- US Cellular Corp.
- Airspan Networks Inc.
- Siklu Communication Ltd.
- Starry Group Holdings Inc.
- Arqiva Ltd.
- Inseego Corp.
- ZTE Corporation
- Deutsche Telekom AG
- Vodafone Group Plc
- Telstra Corp. Ltd.
- Orange S.A.
- Globe Telecom Inc.
Additional Benefits:
- The market estimate (ME) sheet in Excel format
- 3 months of analyst support
TABLE OF CONTENTS
1 INTRODUCTION
- 1.1 Study Assumptions and Market Definition
- 1.2 Scope of the Study
2 RESEARCH METHODOLOGY
3 EXECUTIVE SUMMARY
4 MARKET LANDSCAPE
- 4.1 Market Overview
- 4.2 Market Drivers
- 4.2.1 5G roll-out accelerating gigabit-class FWA
- 4.2.2 Rural broadband stimulus programmes
- 4.2.3 FWA as cost-effective last-mile alternative to fibre
- 4.2.4 Enterprise SD-WAN back-up connectivity demand
- 4.3 Market Restraints
- 4.3.1 Spectrum scarcity and regulatory uncertainty
- 4.3.2 High mmWave densification CAPEX
- 4.4 Value Chain Analysis
- 4.5 Regulatory Landscape
- 4.6 Technological Outlook
- 4.6.1 Key enablers for FWA adoption
- 4.6.2 Vendor initiatives and partnerships
- 4.6.3 Business considerations and prerequisites
- 4.6.4 FWA vs FTTH / FTTdp comparison
- 4.6.5 Rural, semi-urban and urban use-case models
- 4.7 Porter's Five Forces Analysis
- 4.7.1 Bargaining Power of Suppliers
- 4.7.2 Bargaining Power of Buyers
- 4.7.3 Threat of New Entrants
- 4.7.4 Threat of Substitutes
- 4.7.5 Competitive Rivalry
5 MARKET SIZE AND GROWTH FORECASTS (VALUE)
- 5.1 By Type
- 5.1.1 Hardware
- 5.1.1.1 Consumer Premise Equipment (CPE)
- 5.1.1.2 Access Units (Femto and Picocells)
- 5.1.2 Services
- 5.1.1 Hardware
- 5.2 By Application
- 5.2.1 Residential
- 5.2.2 Commercial
- 5.2.3 Industrial
- 5.3 By Frequency Band
- 5.3.1 Sub-6 GHz
- 5.3.2 mmWave ( above 24 GHz)
- 5.4 By Deployment Mode
- 5.4.1 Indoor CPE
- 5.4.2 Outdoor CPE
- 5.5 By Geography
- 5.5.1 North America
- 5.5.2 South America
- 5.5.3 Europe
- 5.5.4 Asia-Pacific
- 5.5.5 Middle East and Africa
6 COMPETITIVE LANDSCAPE
- 6.1 Market Concentration
- 6.2 Strategic Moves
- 6.3 Market Share Analysis
- 6.4 Company Profiles (includes Global level Overview, Market level overview, Core Segments, Financials as available, Strategic Information, Market Rank/Share for key companies, Products and Services, and Recent Developments)
- 6.4.1 Huawei Technologies Co. Ltd.
- 6.4.2 Nokia Corporation
- 6.4.3 Ericsson AB
- 6.4.4 Qualcomm Technologies Inc.
- 6.4.5 Samsung Electronics Co. Ltd.
- 6.4.6 Verizon Communications Inc.
- 6.4.7 ATandT Inc.
- 6.4.8 T-Mobile US Inc.
- 6.4.9 US Cellular Corp.
- 6.4.10 Airspan Networks Inc.
- 6.4.11 Siklu Communication Ltd.
- 6.4.12 Starry Group Holdings Inc.
- 6.4.13 Arqiva Ltd.
- 6.4.14 Inseego Corp.
- 6.4.15 ZTE Corporation
- 6.4.16 Deutsche Telekom AG
- 6.4.17 Vodafone Group Plc
- 6.4.18 Telstra Corp. Ltd.
- 6.4.19 Orange S.A.
- 6.4.20 Globe Telecom Inc.
7 Market Opportunities and Future Outlook
- 7.1 White-space and Unmet-need Assessment
