
|
시장보고서
상품코드
1851098
CaaS(Containers As A Service) 시장 : 시장 점유율 분석, 산업 동향, 통계, 성장 예측(2025-2030년)Container As A Service - Market Share Analysis, Industry Trends & Statistics, Growth Forecasts (2025 - 2030) |
||||||
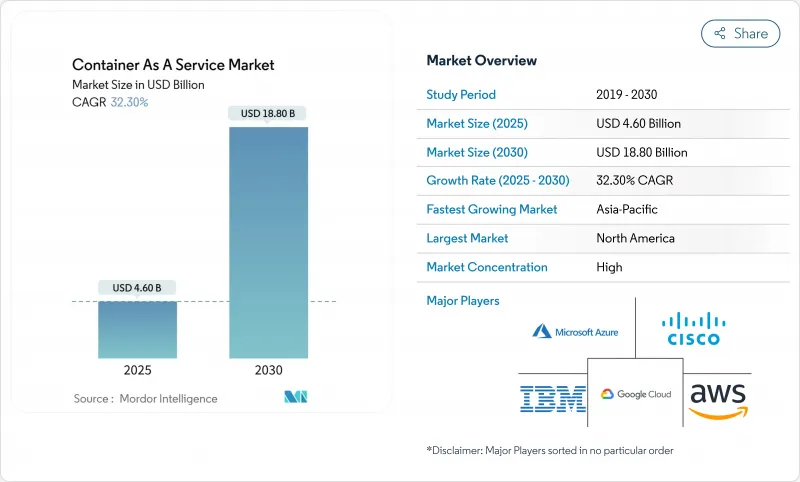
CaaS(Containers As A Service) 시장 규모는 2025년에 46억 달러로 추정되고, 2030년에는 CAGR 32.3%로 확대될 전망이며, 188억 달러에 이를 것으로 예측됩니다.

클라우드 네이티브 민첩성, 멀티클라우드 전략 상승, 세분화된 리소스 할당에 대한 강한 수요가 기업 인프라에 대한 의사 결정을 재구성하고 있습니다. 아시아태평양과 유럽에서는 소프트웨어 부품표(SBOM)의 의무화와 함께 주권 클라우드 지령이 내려져 기존의 리프트 & 시프트 이행에 그치지 않는 채용이 퍼지고 있습니다. 클라우드 도입은 여전히 매출의 78%를 차지하고 있지만, 규제산업이 하이브리드 모델을 채용함에 따라 온프레미스 도입이 CAGR 34%로 가속화되고 있습니다. 54%의 점유율을 차지하는 매니지드 서비스는 과거에는 사내에서 처리되었던 보안 스캔 및 컴플라이언스의 자동화 업무를 담당하고 있습니다. 중소기업은 현재 가장 빠르게 성장하는 고객 그룹으로, 사용량에 따른 과금과 낮은 진입 비용의 매력을 반영합니다. 제조업은 Industry 4.0 이니셔티브를 지원하는 AI 대응 엣지 워크로드를 운영하기 위해 경량 오케스트레이션을 활용하는 주요 성장 업종입니다.
세계의 CaaS(Containers As A Service) 시장 동향 및 인사이트
클라우드에 얽매이지 않는 Kubernetes 플랫폼 잠금 방지
벤더 의존성을 피하고 유리한 가격 협상을 하기 위해 클라우드에 얽매이지 않는 오케스트레이션의 도입이 진행되고 있습니다. 공급자 간에 동일한 클러스터를 실행하는 플랫폼은 워크로드의 이식성을 단순화하고 상태 저장 마이크로 서비스 테스트에서 마이그레이션 다운타임을 77% 절감합니다. HPE와 같은 공급업체는 가상 머신과 컨테이너를 하나의 컨트롤 플레인으로 통합하여 하이브리드 전략을 강화하고 있습니다.
종량 과금 투명성이 중소기업 도입 확대
소비자 가격은 중소기업의 자본 투자 장벽을 없애줍니다. AWS Fargate 및 EKS 비용 시각화 도구는 중소기업이 전문 DevOps 팀 없이 프로덕션 클러스터를 전개하는 데 도움이 됩니다. 자동화된 라이츠 사이징과 스팟 인스턴스 이용은 변동하는 트래픽과 비용을 더욱 정합시켜 중소기업용으로 기록된 36.7%의 연평균 복합 성장률(CAGR)을 지원하고 있습니다.
공인 K8s 운영자 부족
인력 부족은 도입을 늦추고 운영 위험을 높입니다. 신흥 시장의 기업은 비용이 많이 드는 컨설턴트에 의존하는 경우가 많으며 프로젝트 일정이 장기화되고 있습니다. 교육 파이프라인은 서비스 메쉬, GitOps, 엣지 클러스터 기술에 대한 수요를 따라잡지 못했습니다.
부문 분석
클라우드가 압도적인 점유율을 유지하고 있음에도 불구하고 온프레미스 클러스터는 CAGR 34%로 성장할 것으로 예측됩니다. 이는 컴플라이언스의 필요성, 로컬 프로세싱 대기 시간의 이점, 모든 워크로드를 재배치하는 대신 기존 하드웨어를 최신화하려는 요구를 반영합니다. HPE GreenLake는 퍼블릭 클라우드의 경제성을 반영한 소비 기반 프라이빗 클라우드 가격을 제공하며 공급업체가 하이브리 수요에 어떻게 적응하는지 보여줍니다.
기업은 일반적으로 클라우드에서 개발 워크로드와 버스트 워크로드를 실행하지만 대기 시간에 민감한 애플리케이션 및 규제 대상 애플리케이션은 현장에서 유지됩니다. CaaS(Containers As A Service) 시장은 통합된 제어 평면을 통해 원활한 워크로드 마이그레이션을 지원하며 팀은 성능 및 소블린 요구 사항에 따라 컨테이너를 마이그레이션할 수 있습니다. 하이브리드의 성숙도가 높아짐에 따라 클라우드를 최우선으로 설정하는 기본 스탠스가 아닌 비용 및 규정 준수에 대한 측정 가능한 변수에 따라 배포가 결정됩니다.
매니지드 제공 제품의 점유율은 54%로 CAGR 34.5%로 확대되고 있습니다. 공급업체는 AI 중심의 리소스 튜닝과 자동 패치 적용을 통합하여 사내 헤드 카운트의 필요성을 줄이면서 가동 시간을 확보하고 있습니다. T-Mobile은 통신 사업자의 클라우드 기능에 관리되는 Red Hat OpenShift 스택을 채택하여 미션 크리티컬한 5G 워크로드에 대한 접근 방식을 검증했습니다.
전문 서비스는 마이그레이션 및 복잡한 통합에 필수적인 것은 아니지만 수익은 일시적입니다. 시간이 지남에 따라 정기적인 관리 계약은 프로젝트 업무를 능가합니다. CaaS(Containers As A Service) 시장은 이러한 변화를 반영하며 새로운 기능(BBOM 자동화, 공급망 보안, FinOps 대시보드)이 측정 가능한 결과를 제공하는 구독 계층에 번들로 제공됩니다.
CaaS(Containers As A Service) 시장 보고서는 업계를 전개 모드별(온프레미스, 클라우드), 서비스 유형별(프로페셔널 서비스, 매니지드 서비스), 기업 규모별(중소기업, 대기업), 최종 사용자 용도별(은행, 금융서비스 및 보험(BFSI), 소매, IT 및 통신, 제조, 기타 최종 사용자 용도), 지역별로 분류하고 있습니다. 시장 예측은 금액(달러)으로 제공됩니다.
지역별 분석
북미는 확립된 하이퍼스케일 에코시스템과 적극적인 기업 근대화의 혜택을 받아 2024년 매출의 38.5%를 획득했습니다. 주요 공급자는 2025년에 두 자리의 클라우드 수익 성장을 기록해 지역의 우위성을 강화합니다. 그러나 Kubernetes 운영의 기술 부족이 족쇄가 되며, 관리 서비스에 대한 수요가 증가하고 있습니다.
아시아태평양의 CAGR은 39.4%로 세계 최고 속도로 성장할 것으로 예측되고 있는데, 이는 주권 클라우드 규칙과 국가 자금에 의한 AI 인프라 때문입니다. 인도에서는 민간 인공지능 클러스터에 10,000개의 GPU가 할당되는 등 계산 능력에 13억 달러가 할당되었습니다. Alibaba Cloud, Tencent Cloud, Huawei Cloud가 주도하는 중국 에코시스템은 하이브리드 클라우드의 도입을 확대하고 있으며, Huawei Cloud Stack은 아시아태평양 신흥 시장에서 106%의 수익 성장을 보고하고 있습니다.
2025년 9월에 시행되는 EU 데이터 법은 클라우드의 이식성을 의무화하고 2027년까지 전환 수수료를 철폐합니다. 순수하게 클라우드에 얽매이지 않는 아키텍처를 가진 공급자는 유리한 입장에 있다고 생각되지만, 한편 주권 조항은 지역의 CaaS 플랫폼에 박차를 가할 가능성이 높습니다. 독일, 프랑스, 영국이 채용을 이끌고 있지만, 인증 체계가 진정될 때까지 규제의 복잡성은 구매 사이클을 지연시킬 수 있습니다.
기타 혜택 :
- 엑셀 형식 시장 예측(ME) 시트
- 3개월간의 애널리스트 서포트
목차
제1장 서론
- 조사의 전제조건 및 시장 정의
- 조사 범위
제2장 조사 방법
제3장 주요 요약
제4장 시장 상황
- 시장 개요
- 시장 성장 촉진요인
- 클라우드에 얽매이지 않는 Kubernetes 플랫폼의 잠금 방지
- 페이 파 유스의 투명성이 중소기업의 채용 확대
- DevSecOps SBOM의 의무화가 매니지드 CaaS 가속
- AI/ML GPU 대응 클러스터 급증
- 5G 엣지 마이크로 DC의 전개에는 경량 CaaS가 필요
- 소블린 클라우드 의무화가 국내 CaaS 가속
- 시장 성장 억제요인
- K8s 인증 오퍼레이터의 부족
- 커널 레벨 이스케이프 및 eBPF 공격 벡터
- 예측 불가능한 클라우드 이용료
- 세분화된 관측 가능성 라이선스 비용
- 규제 상황
- 기술의 전망
- Porter's Five Forces 분석
- 공급기업의 협상력
- 구매자의 협상력
- 신규 참가업체의 위협
- 대체품의 위협
- 경쟁의 격렬함
- 투자 분석
제5장 시장 규모 및 성장 예측
- 전개 모드별
- 클라우드
- 온프레미스
- 서비스 유형별
- 관리 서비스
- 전문 서비스
- 기업 규모별
- 중소기업
- 대기업
- 최종 사용자 용도별
- BFSI
- 소매
- IT 및 통신
- 제조업
- 헬스케어
- 정부기관
- 기타(미디어, 게임, EdTech)
- 지역별
- 북미
- 미국
- 캐나다
- 멕시코
- 남미
- 브라질
- 아르헨티나
- 기타 남미
- 유럽
- 독일
- 영국
- 프랑스
- 스페인
- 이탈리아
- 기타 유럽
- 아시아태평양
- 중국
- 일본
- 인도
- 호주
- 한국
- 기타 아시아태평양
- 중동
- 이스라엘
- 사우디아라비아
- 아랍에미리트(UAE)
- 튀르키예
- 기타 중동
- 아프리카
- 남아프리카
- 이집트
- 나이지리아
- 기타 아프리카
- 북미
제6장 경쟁 구도
- 시장 집중도
- 전략적 동향
- 시장 점유율 분석
- 기업 프로파일
- Amazon Web Services
- Microsoft Azure
- Google Cloud(GKE)
- IBM Corp(Red Hat OpenShift)
- Alibaba Cloud
- VMware Tanzu
- Cisco Systems
- SUSE Rancher
- Oracle Container Engine
- Hewlett Packard Enterprise(Ezmeral)
- Mirantis
- D2iQ
- Platform9 Systems
- Akamai(Linode)
- DigitalOcean
- Rackspace Technology
- Nutanix
- Canonical
- HashiCorp
- Huawei Cloud
- Tencent Cloud
- OVHCloud
제7장 시장 기회 및 향후 전망
AJY 25.11.12The Container-as-a-Service market size stands at USD 4.6 billion in 2025 and is forecast to reach USD 18.8 billion by 2030, expanding at a 32.3% CAGR.
Strong demand for cloud-native agility, rising multi-cloud strategies and granular resource allocation are reshaping enterprise infrastructure decisions. Sovereign-cloud directives in Asia-Pacific and Europe, together with mandatory software bill of materials (SBOM) rules, are widening adoption beyond classic lift-and-shift migrations. Cloud deployment still represents 78% of revenue, but on-premise deployment is accelerating at a 34% CAGR as regulated industries embrace hybrid models. Managed services, which hold 54% share, are taking on security scanning and compliance automation tasks once handled internally. Small and medium enterprises now form the fastest-growing customer group, reflecting the appeal of pay-per-use billing and low entry costs. Manufacturing is the leading growth vertical, leveraging lightweight orchestration to operate AI-enabled edge workloads that support Industry 4.0 initiatives.
Global Container As A Service Market Trends and Insights
Cloud-agnostic Kubernetes Platforms Avert Lock-in
Enterprises increasingly deploy cloud-agnostic orchestration to avoid vendor dependency and negotiate favorable pricing. Platforms that run identical clusters across providers simplify workload portability and reduce migration downtime by 77% in stateful microservices tests. Vendors such as HPE integrate virtual machines and containers within one control plane, strengthening hybrid strategies.
Pay-per-use Transparency Grows SME Adoption
Consumption pricing eliminates capital expenditure barriers for smaller firms. AWS Fargate and EKS cost-visibility tools help SMEs deploy production clusters without dedicated DevOps teams. Automated rightsizing and spot-instance use further align expenses with fluctuating traffic, supporting the 36.7% CAGR recorded for SMEs.
Shortage of Certified K8s Operators
The talent gap delays deployments and raises operating risk. Enterprises in emerging markets often rely on costly consultants, lengthening project timelines. Training pipelines have yet to match demand for service-mesh, GitOps and edge cluster skills.
Other drivers and restraints analyzed in the detailed report include:
- DevSecOps SBOM Mandates Accelerate Managed CaaS
- AI/ML GPU-ready Clusters Surge
- Kernel-level Escape and eBPF Attack Vectors
For complete list of drivers and restraints, kindly check the Table Of Contents.
Segment Analysis
On-premise clusters are forecast to grow at a 34% CAGR even though cloud maintains dominant share. This reflects compliance needs, local-processing latency advantages and a desire to modernize existing hardware rather than relocate every workload. HPE GreenLake offers consumption-based private-cloud pricing that mirrors public-cloud economics, demonstrating how suppliers adapt to hybrid demand.
Organizations usually run development and bursting workloads in the cloud while retaining latency-sensitive or regulated applications on-site. The Container-as-a-Service market supports seamless workload migration through unified control planes, allowing teams to shift containers in response to performance or sovereignty requirements. As hybrid maturity rises, placement decisions hinge on measurable cost and compliance variables rather than a default cloud-first stance.
Managed offerings hold 54% share and are expanding at 34.5% CAGR as enterprises offload day-two operations. Providers integrate AI-driven resource tuning and automated patching, ensuring uptime while lowering internal headcount needs. T-Mobile adopted a managed Red Hat OpenShift stack for telco cloud functions, validating the approach for mission-critical 5G workloads.
Professional services remain essential for migrations and complex integrations, but revenue is episodic. Over time, recurring managed contracts outpace project work. The Container-as-a-Service market reflects this shift as new features-SBOM automation, supply-chain security and FinOps dashboards-are bundled into subscription tiers that deliver measurable outcomes.
Containers As A Service Market Report Segments the Industry Into by Deployment (On-Premise, Cloud), by Service Type (Professional Services, Managed Services), Enterprise Size (Small and Medium Enterprises, Large Enterprises), End-User Application (BFSI, Retail, IT & Telecommunications, Manufacturing, Other End-User Applications), and Geography. The Market Forecasts are Provided in Terms of Value (USD).
Geography Analysis
North America earns 38.5% of 2024 revenue, benefitting from established hyperscale ecosystems and aggressive enterprise modernization. Major providers posted double-digit cloud revenue growth in 2025, reinforcing regional dominance. Skills shortages in Kubernetes operations, however, are creating a drag that fuels demand for managed services.
Asia-Pacific is forecast to grow at 39.4% CAGR, the fastest worldwide, due to sovereign-cloud rules and state-funded AI infrastructure. India allocated USD 1.3 billion for compute capacity, including 10,000 GPUs earmarked for public-private AI clusters. China's ecosystem, led by Alibaba Cloud, Tencent Cloud and Huawei Cloud, is expanding hybrid-cloud deployments, with Huawei Cloud Stack reporting 106% revenue growth in emerging Asia-Pacific markets.
Europe faces distinctive dynamics under the EU Data Act, effective September 2025, which mandates cloud portability and removes switching fees by 2027. Providers with genuinely cloud-agnostic architectures appear better positioned, while sovereignty clauses are likely to spur regional CaaS platforms. Germany, France and the United Kingdom lead adoption, but regulatory complexity could slow purchase cycles until certification schemes settle.
- Amazon Web Services
- Microsoft Azure
- Google Cloud (GKE)
- IBM Corp (Red Hat OpenShift)
- Alibaba Cloud
- VMware Tanzu
- Cisco Systems
- SUSE Rancher
- Oracle Container Engine
- Hewlett Packard Enterprise (Ezmeral)
- Mirantis
- D2iQ
- Platform9 Systems
- Akamai (Linode)
- DigitalOcean
- Rackspace Technology
- Nutanix
- Canonical
- HashiCorp
- Huawei Cloud
- Tencent Cloud
- OVHCloud
Additional Benefits:
- The market estimate (ME) sheet in Excel format
- 3 months of analyst support
TABLE OF CONTENTS
1 INTRODUCTION
- 1.1 Study Assumptions and Market Definition
- 1.2 Scope of the Study
2 RESEARCH METHODOLOGY
3 EXECUTIVE SUMMARY
4 MARKET LANDSCAPE
- 4.1 Market Overview
- 4.2 Market Drivers
- 4.2.1 Cloud-agnostic Kubernetes platforms avert lock-in
- 4.2.2 Pay-per-use transparency grows SME adoption
- 4.2.3 DevSecOps SBOM mandates accelerate managed CaaS
- 4.2.4 AI/ML GPU-ready clusters surge
- 4.2.5 5G edge micro-DC roll-outs need lightweight CaaS
- 4.2.6 Sovereign-cloud mandates spur domestic CaaS
- 4.3 Market Restraints
- 4.3.1 Shortage of certified K8s operators
- 4.3.2 Kernel-level escape and eBPF attack vectors
- 4.3.3 Unpredictable cloud egress fees
- 4.3.4 Fragmented observability licensing costs
- 4.4 Regulatory Landscape
- 4.5 Technological Outlook
- 4.6 Porter's Five Forces Analysis
- 4.6.1 Bargaining Power of Suppliers
- 4.6.2 Bargaining Power of Buyers
- 4.6.3 Threat of New Entrants
- 4.6.4 Threat of Substitutes
- 4.6.5 Intensity of Rivalry
- 4.7 Investment Analysis
5 MARKET SIZE AND GROWTH FORECASTS (VALUE)
- 5.1 By Deployment
- 5.1.1 Cloud
- 5.1.2 On-Premise
- 5.2 By Service Type
- 5.2.1 Managed Services
- 5.2.2 Professional Services
- 5.3 By Enterprise Size
- 5.3.1 Small and Medium Enterprises
- 5.3.2 Large Enterprises
- 5.4 By End-user Application
- 5.4.1 BFSI
- 5.4.2 Retail
- 5.4.3 IT and Telecommunications
- 5.4.4 Manufacturing
- 5.4.5 Healthcare
- 5.4.6 Government
- 5.4.7 Others (Media, Gaming, EdTech)
- 5.5 By Geography
- 5.5.1 North America
- 5.5.1.1 United States
- 5.5.1.2 Canada
- 5.5.1.3 Mexico
- 5.5.2 South America
- 5.5.2.1 Brazil
- 5.5.2.2 Argentina
- 5.5.2.3 Rest of South America
- 5.5.3 Europe
- 5.5.3.1 Germany
- 5.5.3.2 United Kingdom
- 5.5.3.3 France
- 5.5.3.4 Spain
- 5.5.3.5 Italy
- 5.5.3.6 Rest of Europe
- 5.5.4 Asia-Pacific
- 5.5.4.1 China
- 5.5.4.2 Japan
- 5.5.4.3 India
- 5.5.4.4 Australia
- 5.5.4.5 South Korea
- 5.5.4.6 Rest of Asia-Pacific
- 5.5.5 Middle East
- 5.5.5.1 Israel
- 5.5.5.2 Saudi Arabia
- 5.5.5.3 United Arab Emirates
- 5.5.5.4 Turkey
- 5.5.5.5 Rest of Middle East
- 5.5.6 Africa
- 5.5.6.1 South Africa
- 5.5.6.2 Egypt
- 5.5.6.3 Nigeria
- 5.5.6.4 Rest of Africa
- 5.5.1 North America
6 COMPETITIVE LANDSCAPE
- 6.1 Market Concentration
- 6.2 Strategic Moves
- 6.3 Market Share Analysis
- 6.4 Company Profiles (includes Global level Overview, Market level overview, Core Segments, Financials as available, Strategic Information, Market Rank/Share for key companies, Products and Services, and Recent Developments)
- 6.4.1 Amazon Web Services
- 6.4.2 Microsoft Azure
- 6.4.3 Google Cloud (GKE)
- 6.4.4 IBM Corp (Red Hat OpenShift)
- 6.4.5 Alibaba Cloud
- 6.4.6 VMware Tanzu
- 6.4.7 Cisco Systems
- 6.4.8 SUSE Rancher
- 6.4.9 Oracle Container Engine
- 6.4.10 Hewlett Packard Enterprise (Ezmeral)
- 6.4.11 Mirantis
- 6.4.12 D2iQ
- 6.4.13 Platform9 Systems
- 6.4.14 Akamai (Linode)
- 6.4.15 DigitalOcean
- 6.4.16 Rackspace Technology
- 6.4.17 Nutanix
- 6.4.18 Canonical
- 6.4.19 HashiCorp
- 6.4.20 Huawei Cloud
- 6.4.21 Tencent Cloud
- 6.4.22 OVHCloud
7 MARKET OPPORTUNITIES AND FUTURE OUTLOOK
- 7.1 White-space and Unmet-Need Assessment
