
|
시장보고서
상품코드
1851221
영국의 재생에너지 시장 : 점유율 분석, 산업 동향, 통계, 성장 예측(2025-2030년)United Kingdom Renewable Energy - Market Share Analysis, Industry Trends & Statistics, Growth Forecasts (2025 - 2030) |
||||||
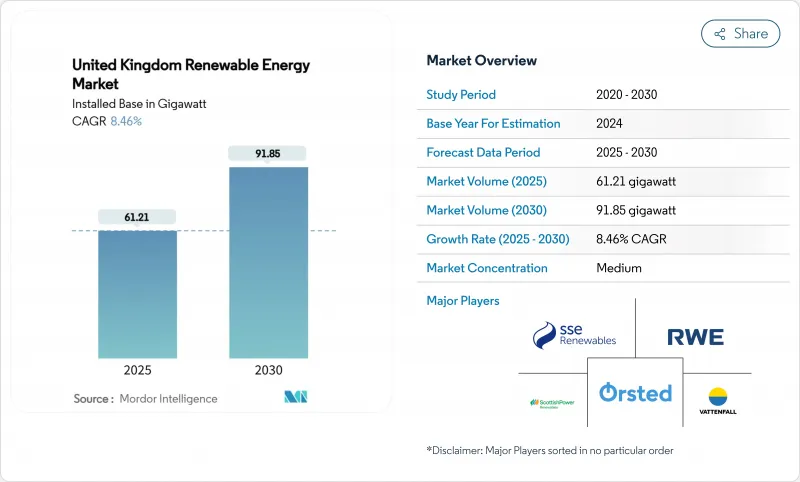
영국의 재생에너지 시장 규모는 설치 기준으로 2025년 61.21기가와트에서 2030년 91.85기가와트까지 확대될 것으로 예상되고, 예측 기간 중(2025-2030년) CAGR은 8.46%를 보일 것으로 예측됩니다.
급속한 도입은 화석연료 수입을 줄이면서 에너지 안보의 야심을 강화하고 95%의 청정발전을 목표로 하는 'Clean Power 2030 Action Plan'에 따른 것입니다. 신재생에너지는 2024년 국내 전력의 46.4%를 공급해 최초로 가스를 추월했으며 저탄소 전력에 대한 구조적 수요를 명확히 합니다. 그 원동력은 해상풍력발전의 주도권, 태양광발전 설비투자 감소, 차금결제계약(CfD) 체계에 의한 장기 수익 확보 등입니다. 정책의 명확화, 기업의 전력 구매 계약, 송전망 강화의 헌신이 프로젝트의 융통성을 향상시키기 때문에 투자 의욕은 계속 왕성합니다.
영국의 신재생에너지 시장 동향과 통찰
해상 풍력 CfD의 스트라이크 가격 재설정으로 북해 파이프라인 가속화
지난 입찰 불발 이후 정부는 할당 라운드 6에서 행사 가격을 인상하고 상업적 실행 가능성을 회복하고 혼사 3과 4를 포함한 530만 kW의 새로운 용량을 계약했습니다. 예측 가능한 연간 6-8GW의 입찰은 공급망의 스케일링을 지지해, 북해의 개발 파이프라인을 37GW이상으로 끌어올려, 2030년까지 50GW라는 목표를 지지하고 있습니다.
수익 확실성을 제공하는 차금 결제 계약 체계
시작 이후 양방향 CfD 메커니즘은 현재 국내 재생에너지 발전의 40% 이상을 지원하고 1,000억 파운드 이상의 민간 자본을 동원해 왔습니다. 조류나 부유식 풍력 발전의 대상이 확대됨에 따라 기술의 적용 범위가 넓어져 대규모 프로젝트의 가중 자본 비용을 계속 인하하고 있습니다.
내셔널 그리드 대기열이 5년간 연결 지연을 유발합니다.
연결 큐는 739GW로 부풀어 오르고, 일부 프로젝트는 2035년 마감일을 할당받습니다. Ofgem의 TMO4의 "first ready, first connected"개혁과 310억 파운드의 Great Grid Upgrade는 500GW의 용량을 해방하는 것을 목적으로 하고 있지만, 실질적인 구제는 43억 파운드의 Eastern Green Link 2 케이블과 같은 단기적인 보강 후에 나타날 것으로 보입니다.
부문 분석
풍력발전은 2024년 발전량의 53%를 차지했으며, 360만 kW의 도거뱅크 단지와 같은 높은 용량계수를 가지는 해양 지역에 지지되어 태양광발전은 2025-2030년 CAGR이 11.2%로 가장 빠릅니다. 선진적인 15MW 터빈과 고정식+부유식 기초가 풍력 발전의 우위성을 확대하지만, 합리화된 계획과 2025년부터 의무화되는 옥상 전개가 태양광 발전의 추상을 뒷받침합니다. 수력과 바이오에너지는 계속해서 안정된 공헌을 하고 있지만, 후자는 2030년 이후 탄소 포집 및 저류를 수반하는 상업적 바이오에너지가 기대되고 있습니다. 조류와 파력 기술에 대한 혁신적인 자금 제공은 영국의 재생에너지 시장을 다양한 장기 성장을 위해 자리잡고 있습니다.
태양광 발전의 급증과 비용 효과적인 옥상 시스템은 주택과 기업의 도입을 촉진하고, 조류 실증 시험과 부유식 풍력 발전의 프로토타입은 새로운 자원 분야를 개척합니다. 이러한 변화로 인해 영국의 재생에너지 시장은 현재의 풍력 주도 프로파일을 넘어 전력 공급 기여의 균형을 유지할 것입니다.
영국의 신재생에너지 시장 보고서는 발전원(풍력, 태양광, 수력, 바이오에너지 등), 설치규모(10MW 이상, 100KW 이상 10MW 미만, 100KW 미만), 최종사용자 부문(유틸리티, 상업 및 산업, 주택)으로 구분되어 있습니다. 시장 규모와 예측은 설치 용량(GW)으로 제공됩니다.
기타 혜택:
- 엑셀 형식 시장 예측(ME) 시트
- 3개월간의 애널리스트 서포트
목차
제1장 서론
- 조사의 전제조건과 시장의 정의
- 조사 범위
제2장 조사 방법
제3장 주요 요약
제4장 시장 상황
- 시장 개요
- 시장 성장 촉진요인
- 해상풍력 CfD의 스트라이크 가격 하락이 북해 파이프라인을 가속
- 수익의 확실성을 가져오는 차액계약(CfD) 제도
- 영국 데이터센터와 중공업 오프테이커에 의한 기업 PPA 대두
- 분산형 태양열을 뒷받침하는 Ofgem의 RIIO-ED2 그리드 업그레이드 약속
- 전해조 건설과 재생에너지를 연결시킨 그린 수소 전략
- 스코틀랜드 심해에서의 부유식 해상 터빈의 비용 저하
- 시장 성장 억제요인
- 5년간 접속 지연을 일으키는 국내 송전망 큐 병목
- 스마트 수출 보증 관세의 인하가 지붕 태양광 발전의 ROI에 타격
- 브렉시트 후 해상 풍력 발전용 모노파일의 코스트 상승
- 육상 풍력 발전의 허가를 막는 시각적 임팩트의 문제
- 공급망 분석
- 규제 전망
- 기술의 전망
- Porter's Five Forces
- 신규 참가업체의 위협
- 공급기업의 협상력
- 구매자의 협상력
- 대체품의 위협
- 업계 간 경쟁
- PESTEL 분석
제5장 시장 규모와 성장 예측
- 에너지원별
- 풍력(육상 풍력, 해상 풍력, 부유식 해상 풍력)
- 태양광 발전(유틸리티용 태양광 발전, 상업 및 산업용 옥상 태양광 발전, 주택용 옥상 태양광 발전)
- 수력(소형, 대형, 양수 발전)
- 바이오에너지(바이오매스, 바이오가스)
- 기타(지열, 조류, 파)
- 설치규모별
- 10MW 이상
- 100 kW-10 MW
- 100kW 미만
- 최종 사용자 부문별
- 유틸리티
- 상업 및 산업
- 주택
제6장 경쟁 구도
- 시장 집중도
- 전략적 움직임(M&A, 파트너십, PPA)
- 시장 점유율 분석(주요 기업의 시장 순위/점유율)
- 기업 프로파일
- SSE Renewables
- Orsted A/S
- ScottishPower Renewables(Iberdrola SA)
- RWE Renewables GmbH
- Vattenfall AB
- EDF Energy
- Statkraft AS
- RES Group Ltd.
- Brookfield Renewable Partners
- Greencoat UK Wind PLC
- Bluefield Solar Income Fund
- Octopus Renewables Infrastructure Trust
- NextEnergy Solar Fund
- Equinor ASA
- TotalEnergies SE
- Siemens Gamesa Renewable Energy SA
- Vestas Wind Systems A/S
- GE Vernova
- Lightsource BP
- Drax Group PLC
제7장 시장 기회와 장래의 전망
JHS 25.11.21The United Kingdom Renewable Energy Market size in terms of installed base is expected to grow from 61.21 gigawatt in 2025 to 91.85 gigawatt by 2030, at a CAGR of 8.46% during the forecast period (2025-2030).

Rapid deployment aligns with the Clean Power 2030 Action Plan that targets 95% clean electricity generation, reinforcing energy-security ambitions while cutting fossil-fuel imports . Renewables supplied 46.4% of national electricity in 2024, overtaking gas for the first time and underscoring structural demand for low-carbon power. Drivers include offshore wind leadership, falling solar PV capex, and long-dated revenue certainty from the Contracts-for-Difference (CfD) scheme. Investment appetite remains strong as policy clarity, corporate power-purchase agreements, and grid-upgrade commitments improve project bankability.
United Kingdom Renewable Energy Market Trends and Insights
Offshore-wind CfD strike-price resets accelerating the North Sea pipeline
After the previous zero-bid outcome, the government raised strike prices in Allocation Round 6, restoring commercial viability and contracting 5.3 GW of new capacity, including Hornsea 3 and 4. Predictable annual auctions of 6-8 GW underpin supply-chain scaling and have lifted the North Sea development pipeline above 37 GW, supporting the 50 GW by 2030 target .
Contracts-for-Difference scheme providing revenue certainty
Since its inception, the two-way CfD mechanism now backs over 40% of national renewable generation and has mobilized over GBP 100 billion of private capital. Expanding eligibility to tidal streams and floating wind broadens technology coverage and continues to lower the weighted cost of capital for large projects.
National Grid queue bottlenecks causing five-year connection delays
The connection queue has ballooned to 739 GW, with some projects assigned 2035 dates. Ofgem's TMO4+ "first ready, first connected" reforms and the GBP 31 billion Great Grid Upgrade aim to free 500 GW of capacity, yet material relief will appear only after near-term reinforcements such as the GBP 4.3 billion Eastern Green Link 2 cable.
Other drivers and restraints analyzed in the detailed report include:
- Rise of corporate PPAs from UK data-centre and industrial off-takers
- Ofgem RIIO-ED2 grid-upgrade commitments boosting distributed solar
- Reduced Smart-Export-Guarantee tariff hitting rooftop solar ROI
For complete list of drivers and restraints, kindly check the Table Of Contents.
Segment Analysis
Wind contributed 53% of 2024 generation, anchored by high-capacity-factor offshore sites such as the 3.6 GW Dogger Bank complex, while solar posts the fastest 2025-2030 CAGR at 11.2% . Advanced 15 MW turbines and fixed-plus-floating foundations extend wind's edge, but streamlined planning and mandated rooftop deployment from 2025 propel solar's catch-up. Hydro and bioenergy remain steady contributors; the latter awaits commercial bioenergy with carbon capture and storage after 2030. Innovation funding for tidal stream and wave technologies positions the UK renewable energy market for diversified long-term growth.
The solar surge and cost-effective rooftop systems encourage residential and corporate uptake, while tidal stream demonstrators and floating wind prototypes open new resource areas. These shifts ensure the UK renewable energy market continues to rebalance source contributions beyond the current wind-led profile.
The United Kingdom Renewable Energy Market Report is Segmented by Source (Wind, Solar, Hydro, Bioenergy, and Other), Installation Scale (Above 10 MW, 100 KW To 10 MW, and Below 100 KW), and End-User Sector (Utilities, Commercial and Industrial, and Residential). The Market Sizes and Forecasts are Provided in Terms of Installed Capacity (GW).
List of Companies Covered in this Report:
- SSE Renewables
- Orsted A/S
- ScottishPower Renewables (Iberdrola SA)
- RWE Renewables GmbH
- Vattenfall AB
- EDF Energy
- Statkraft AS
- RES Group Ltd.
- Brookfield Renewable Partners
- Greencoat UK Wind PLC
- Bluefield Solar Income Fund
- Octopus Renewables Infrastructure Trust
- NextEnergy Solar Fund
- Equinor ASA
- TotalEnergies SE
- Siemens Gamesa Renewable Energy SA
- Vestas Wind Systems A/S
- GE Vernova
- Lightsource BP
- Drax Group PLC
Additional Benefits:
- The market estimate (ME) sheet in Excel format
- 3 months of analyst support
TABLE OF CONTENTS
1 Introduction
- 1.1 Study Assumptions & Market Definition
- 1.2 Scope of the Study
2 Research Methodology
3 Executive Summary
4 Market Landscape
- 4.1 Market Overview
- 4.2 Market Drivers
- 4.2.1 Offshore-wind CfD Strike-Price Declines Accelerating North-Sea Pipeline
- 4.2.2 Contracts-for-Difference (CfD) Scheme Providing Revenue Certainty
- 4.2.3 Rise of Corporate PPAs from UK Data-Centre & Heavy-Industry Off-takers
- 4.2.4 Ofgem RIIO-ED2 Grid-Upgrade Commitments Boosting Distributed Solar
- 4.2.5 Green-Hydrogen Strategy Linking Electrolyser Build-out to Renewables
- 4.2.6 Cost Drop in Floating Offshore Turbines for Deep-water Scottish Sites
- 4.3 Market Restraints
- 4.3.1 National-Grid Queue Bottlenecks Causing 5-year Connection Delays
- 4.3.2 Reduced Smart-Export-Guarantee Tariff Hitting Rooftop Solar ROI
- 4.3.3 Offshore-Wind Monopile Cost Inflation Post-Brexit Steel Tariffs
- 4.3.4 Visual-Impact Objections Stalling Onshore Wind Permitting
- 4.4 Supply-Chain Analysis
- 4.5 Regulatory Outlook
- 4.6 Technological Outlook
- 4.7 Porter's Five Forces
- 4.7.1 Threat of New Entrants
- 4.7.2 Bargaining Power of Suppliers
- 4.7.3 Bargaining Power of Buyers
- 4.7.4 Threat of Substitutes
- 4.7.5 Industry Rivalry
- 4.8 PESTLE Analysis
5 Market Size & Growth Forecasts
- 5.1 By Source
- 5.1.1 Wind (Onshore Wind, Offshore Wind, and Floating Offshore Wind)
- 5.1.2 Solar (Utility-scale PV, Commercial and Industrial Rooftop PV, and Residential Rooftop PV)
- 5.1.3 Hydro (Small, Large, Pumped Storage)
- 5.1.4 Bioenergy (Biomass, Biogas)
- 5.1.5 Other (Geothermal, Tidal-Stream, Wave)
- 5.2 By Installation Scale
- 5.2.1 Above 10 MW
- 5.2.2 100 kW to 10 MW
- 5.2.3 Below 100 kW
- 5.3 By End-User Sector
- 5.3.1 Utilities
- 5.3.2 Commercial and Industrial
- 5.3.3 Residential
6 Competitive Landscape
- 6.1 Market Concentration
- 6.2 Strategic Moves (M&A, Partnerships, PPAs)
- 6.3 Market Share Analysis (Market Rank/Share for key companies)
- 6.4 Company Profiles (includes Global level Overview, Market level overview, Core Segments, Financials as available, Strategic Information, Products & Services, and Recent Developments)
- 6.4.1 SSE Renewables
- 6.4.2 Orsted A/S
- 6.4.3 ScottishPower Renewables (Iberdrola SA)
- 6.4.4 RWE Renewables GmbH
- 6.4.5 Vattenfall AB
- 6.4.6 EDF Energy
- 6.4.7 Statkraft AS
- 6.4.8 RES Group Ltd.
- 6.4.9 Brookfield Renewable Partners
- 6.4.10 Greencoat UK Wind PLC
- 6.4.11 Bluefield Solar Income Fund
- 6.4.12 Octopus Renewables Infrastructure Trust
- 6.4.13 NextEnergy Solar Fund
- 6.4.14 Equinor ASA
- 6.4.15 TotalEnergies SE
- 6.4.16 Siemens Gamesa Renewable Energy SA
- 6.4.17 Vestas Wind Systems A/S
- 6.4.18 GE Vernova
- 6.4.19 Lightsource BP
- 6.4.20 Drax Group PLC
7 Market Opportunities & Future Outlook
- 7.1 White-space & Unmet-Need Assessment
- 7.2 10 GW Floating-Wind Pipeline Beyond 2030 Target
