|
시장보고서
상품코드
1906914
중요 인프라 보호(CIP) : 시장 점유율 분석, 업계 동향 및 통계, 성장 예측(2026-2031년)Critical Infrastructure Protection (CIP) - Market Share Analysis, Industry Trends & Statistics, Growth Forecasts (2026 - 2031) |
||||||
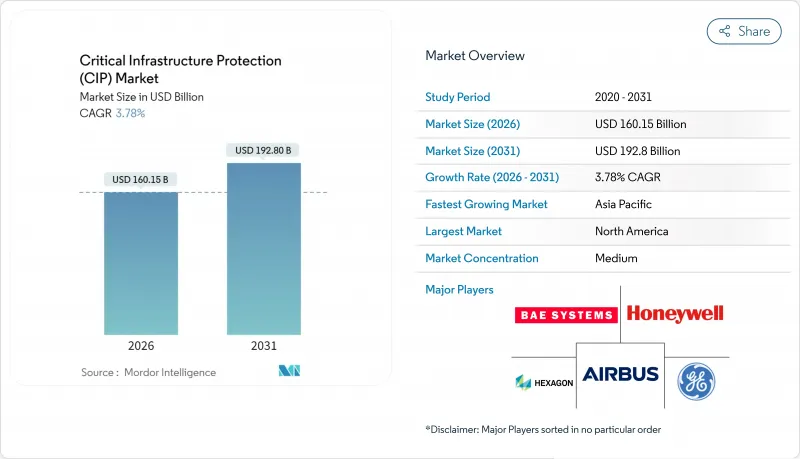
중요 인프라 보호(CIP) 시장 규모는 2026년에는 1,601억 5,000만 달러로 추정되고 있으며, 2025년 1,543억 2,000만 달러에서 성장이 예상됩니다.
2031년까지의 예측은 1,928억 달러에 이르고, 2026년부터 2031년까지 연평균 복합 성장률(CAGR) 3.78%를 나타낼 것으로 전망되고 있습니다.
이 균형 잡힌 확장은 사이버 보안과 물리적 보안이 에너지, 운송, 물 및 통신 자산을 보호하는 통합 프로그램으로 수렴하고 있음을 보여줍니다. 국가가 지원하는 공격 격화, 규제 요건 확대, 운영 기술(OT)의 급속한 디지털화로 위협 모니터링, 인시던트 보고, 제로 트러스트 액세스 솔루션에 대한 수요가 증가하고 있습니다. 북미 투자가 여전히 주류인 반면 5G, 엣지컴퓨팅, 스마트그리드 도입 확대로 공격대상 영역이 넓어지는 가운데 아시아태평양의 성장이 가속화되고 있습니다. 운영자가 지속적인 모니터링을 관리 보안 제공업체에 위임하여 서비스 수익은 기존 하드웨어 소프트웨어보다 빠르게 증가하고 있습니다. 한편, 인공지능 구동형 분석이 예측형 보호 모델을 실현하는 한편, 인재 부족이나 레거시 OT의 상호 운용성 문제가 도입 속도를 억제하고 있습니다.
세계의 중요 인프라 보호(CIP) 시장 동향 및 인사이트
정부 규제 강화가 컴플라이언스 주도 시장 확대를 촉진
의무적 규제가 중요 인프라 보호(CIP) 시장의 구매 패턴을 재구성하고 있습니다. EU의 NIS-2 지침은 의무적인 사이버 보안을 18개 업종 및 직원 50명 이상, 매출 1,000만 유로(약 1,090만 달러) 이상의 조직으로 확대하여 대상 시장을 확대하고 있습니다. 미국에서는 CISA가 제안한 CIRCIA 규정에 따라 약 31만 6천개의 기업이 사이버 인시던트를 72시간 이내, 랜섬웨어 결제를 24시간 이내에 보고해야 합니다. ISA/IEC 62443 규격에 준거는 벤더 인증을 간소화해 일괄 조달을 촉진하는 한편, 종래는 자주적 가이드라인에 의존하고 있던 사업체는 벌칙이나 감사 기준을 채우기 위해 투자를 가속시키고 있습니다.
국가 지원 사이버 공격은 운영 기술 시스템을 목표
국가 차원의 조직은 전력·수도·교통 시스템을 운영하는 OT 네트워크에 장기 잠복형 침입을 우선적으로 실시했습니다. 중국의 공격주체 '볼트타이툰'은 첩보활동이 아닌 파괴능력을 목적으로 5년 이상 미국 인프라에 잠복해왔습니다. 미국의 수도 시설과 일본의 항공우주 조직에 대한 유사한 공격은 IT 중심의 데이터 절취에서 OT 수준의 방해 행위로의 전환을 돋보이게합니다. 이러한 위협은 인증 기능이 없는 Modbus와 같은 구형 프로토콜을 악용하여 전문적인 침입 감지 및 네트워크 세분화 도구에 대한 투자를 촉진합니다.
레거시 OT 시스템이 지속적인 상호 운용성 문제를 야기
산업용 자산은 기본적인 암호화 기능이 없는 프로토콜로 수십년동안 가동되고 있는 경우가 많습니다. Modbus 및 OPC Classic은 다운타임 없이는 패치가 불가능하며 데이터 다이오드 및 가상 패치와 같은 고비용 보상 제어가 필요합니다. FBI는 지원 종료 시스템을 인프라 보안의 "아킬레스 건"으로 자리매김하고 있으며, 많은 업그레이드가 여러 해 동안 자본 계획에 의존하고 있음을 시사합니다. 이러한 장벽은 컴플라이언스 마감일이 다가오면서 중요한 인프라 보호(CIP) 시장의 진전을 늦추고 있습니다.
부문 분석
2025년 수익의 65.40%는 솔루션이 차지했지만, 조직이 복잡성 증대에 직면하는 가운데, 서비스는 CAGR 5.45%를 나타낼 것으로 전망되고 있습니다. 운영 리스크를 이전하는 구독 계약에는 관리 감지, 대응, 규정 준수 감사 및 사고 복구가 포함됩니다. 클라우드 보안 얼라이언스의 지침에 따르면 OT의 제로 트러스트 구축에는 전문적인 로드맵 개발과 24시간 365일 모니터링이 필요하며, 이러한 작업 부하를 사내에서 대응할 수 있는 기업은 거의 없습니다.
중요 인프라 보호(CIP) 시장은 가더월드의 중요한 이벤트 관리를 위한 온솔브 통합과 같은 관리 제공업체가 인수를 통해 전문 지식을 통합함으로써 혜택을 누리고 있습니다. 드래고스에 의한 네트워크 퍼셉션 인수는 회사의 산업 플랫폼에 방화벽 규칙의 지속적인 시각화 기능을 추가하여 크로스셀링의 가능성을 넓혔습니다. 이러한 움직임은 서비스 규모와 폭이 경쟁 우위를 가속화하고 장기적인 지속적인 수익을 지원한다는 것을 보여줍니다.
물리적 안전 및 보안 분야는 경계 감시·액세스 제어·스크리닝 기술에 의해 2025년 지출의 56.10%를 유지했습니다. 그러나 위협 액터가 IT-OT 융합 지점으로 전환하는 동안 사이버 보안 분야는 연간 5.62%로 성장하고 있습니다. SCADA/OT 보안의 중요 인프라 보호(CIP) 시장 규모는 새로운 제로 트러스트 기준의 도입으로 급증할 것으로 전망됩니다. 한편, 네트워크 마이크로세그먼테이션 제품은 플랜트 정지 없이 레거시 자산을 격리합니다.
Siemens의 SIBERprotect와 같은 자동 지원 제품군은 침해된 노드를 몇 밀리초로 격리하고 기계 수준의 방어 속도가 사고 봉쇄를 재구성하는 예를 보여줍니다. 에어 갭 시스템을 위해 구축된 ID 및 액세스 관리 플랫폼은 자격 증명의 확산을 방지합니다. 자본계획 담당자가 CCTV 분석과 사이버 경보를 통합한 대시보드를 요구하는 가운데, 컨버전스 소프트웨어는 물리적 및 디지털 보호 수단의 전통적인 경계를 지속적으로 해소하고 있습니다.
중요 인프라 보호(CIP) 시장은 구성 요소(솔루션, 서비스), 보안 유형(물리적 안전/보안, 사이버 보안), 배포 형태(On-Premise, 클라우드/X-as-a-Service), 산업(에너지/전력, BFSI(은행/금융/보험) 등) 및 지역별로 구분됩니다. 시장 예측은 금액(달러) 기준으로 제공됩니다.
지역별 분석
북미는 2025년 수익의 35.70%를 유지했고 16개 분야를 의무적 보고와 일치시키는 CISA의 성과 목표 로드맵이 이를 지원합니다. 슈나이더 일렉트릭에 의한 7억 달러의 제조 확장은 공급망의 현지화와 전력망 고객에 대한 대응 시간 단축을 도모하는 지속적인 자본 유입을 보여줍니다. 국토 안보부의 AI 안전 프레임워크는 리스크 태세를 더욱 표준화하고 있으며 국내 벤더의 홈마켓에서의 강점을 키우고 있습니다.
아시아태평양은 2031년까지 4.08%라는 가장 빠른 CAGR을 나타낼 전망입니다. 일본의 '적극적인 사이버 방어법안'은 예방적 위협 사냥을 가능하게 하고, KDDI와 NEC의 제휴는 산업 고객을 위한 매니지드 공급망 보호를 확대합니다. ASEAN 국가는 2025년까지 사이버 보안에 총 1,710억 달러를 예산화하여 지역 특화형 SOC 및 언어 대응 위협 분석 수요를 자극했습니다. 중국의 국가 프로그램과 인도의 디지털 공공 인프라 모델은 공급업체의 기회를 확대하지만, 자체 암호화 규칙에 따라 국가별 제품이 필요합니다.
기타 혜택 :
- 엑셀 형식 시장 예측(ME) 시트
- 애널리스트 지원(3개월간)
자주 묻는 질문
목차
제1장 서론
- 조사 전제조건 및 시장 정의
- 조사 범위
제2장 조사 방법
제3장 주요 요약
제4장 시장 상황
- 시장 개요
- 시장 성장 촉진요인
- 북미 및 EU의 정부 규제 강화(예 : NIS-2, CISA)
- 에너지·수도 사업자를 대상으로 한 국가 지원형 OT 사이버 공격
- 스마트 그리드 도입이 물리·사이버 통합 투자를 견인
- 5G 및 엣지 컴퓨팅의 확대가 아시아에서의 통신 공격 대상 영역을 확대
- IT-OT 융합이 제로 트러스트 도입을 가속
- 중동에 있어서 공항·항만 시큐리티를 위한 관민 자금 조달
- 시장 성장 억제요인
- 레거시 OT 보안 상호 운용성의 갭
- OT 스킬을 가진 사이버 보안 인력 부족
- 엔드 투 엔드 솔루션의 총 소유 비용 높이
- 신흥 경제국의 규제 단편화
- 가치/공급망 분석
- 규제와 기술의 전망
- Porter's Five Forces
- 공급기업의 협상력
- 구매자의 협상력
- 신규 참가업체의 위협
- 대체품의 위협
- 경쟁도
제5장 시장 규모와 성장 예측
- 구성 요소별
- 솔루션
- 서비스
- 보안 유형별
- 물리적 안전 및 보안
- 스크리닝 및 스캐닝
- 영상 감시
- 접근 통제
- PSIM 및 PIAM
- CBRNE 탐지
- 사이버 보안
- 네트워크 보안
- SCADA/OT보안
- 신원 및 접근 관리
- 데이터 및 애플리케이션 보안
- 보안 통신
- 스크리닝 및 스캐닝
- 물리적 안전 및 보안
- 배포 모드별
- On-Premise
- 클라우드/X-as-a-Service
- 업계별
- 에너지 및 전력
- BFSI
- 운송
- 통신
- 정부 및 방위
- 화학 및 제조
- 헬스케어 및 생명과학
- 중요 인프라 및 데이터센터
- 지역별
- 북미
- 미국
- 캐나다
- 멕시코
- 남미
- 브라질
- 아르헨티나
- 기타 남미
- 유럽
- 영국
- 독일
- 프랑스
- 이탈리아
- 스페인
- 기타 유럽
- 아시아태평양
- 중국
- 일본
- 인도
- 한국
- 뉴질랜드
- 기타 아시아태평양
- 중동 및 아프리카
- 중동
- GCC
- 튀르키예
- 이스라엘
- 기타 중동
- 아프리카
- 남아프리카
- 나이지리아
- 이집트
- 기타 아프리카
- 중동
- 북미
제6장 경쟁 구도
- 시장 집중도
- 전략적 동향
- 시장 점유율 분석
- 기업 프로파일
- BAE Systems PLC
- Honeywell International Inc.
- Lockheed Martin Corporation
- General Dynamics Corporation
- Northrop Grumman Corp.
- Hexagon AB
- Airbus SE
- General Electric Company
- Kaspersky Lab Inc.
- Waterfall Security Solutions Ltd.
- Ericsson AB
- Claroty
- Cisco Systems Inc.
- IBM Corporation
- ABB Ltd.
- Schneider Electric SE
- Raytheon Technologies Corp.
- Palo Alto Networks Inc.
- Siemens AG
- Johnson Controls International
- Thales Group
- Trellix
- Booz Allen Hamilton
- Darktrace PLC
- Fortinet
- Dragos
제7장 시장 기회와 향후 전망
KTH 26.01.20Critical Infrastructure Protection market size in 2026 is estimated at USD 160.15 billion, growing from 2025 value of USD 154.32 billion with 2031 projections showing USD 192.8 billion, growing at 3.78% CAGR over 2026-2031.

This balanced expansion shows how cybersecurity and physical security are converging into unified programs that protect energy, transportation, water, and communications assets. Heightened state-backed attacks, expanding regulatory mandates, and rapid digitization of operational technology (OT) are increasing demand for threat monitoring, incident reporting, and zero-trust access solutions. North American investments remain dominant, yet Asia-Pacific growth is accelerating as 5G, edge computing, and smart-grid deployments widen the attack surface. Services revenue is rising faster than traditional hardware and software because operators are outsourcing continuous monitoring to managed security providers. Meanwhile, talent gaps and legacy OT interoperability issues temper deployment speed even as artificial-intelligence-driven analytics unlock predictive protection models.
Global Critical Infrastructure Protection (CIP) Market Trends and Insights
Growing Government Mandates Drive Compliance-Led Market Expansion
Mandatory regulations are reshaping Critical Infrastructure Protection market purchasing patterns. The EU NIS-2 directive extends obligatory cybersecurity to 18 sectors and any organization with more than 50 employees and EUR 10 million (USD 10.9 million) revenue, enlarging the addressable base. In the United States, CISA's proposed CIRCIA rule compels roughly 316,000 entities to report cyber incidents within 72 hours and ransomware payments within 24 hours. Alignment around ISA/IEC 62443 standards simplifies vendor certification and drives bulk procurement, while entities that previously relied on voluntary guidelines now accelerate investments to meet penalties and audit thresholds.
State-Backed Cyber Campaigns Target Operational Technology Systems
Nation-state groups are prioritizing long-dwell infiltration of OT networks that run power, water, and transport systems. Chinese actor Volt Typhoon remained in U.S. infrastructure for over five years aiming for disruptive capability rather than espionage. Similar campaigns against U.S. water facilities and Japanese aerospace organizations underscore the shift from IT-centric data theft to OT-level sabotage. These threats exploit aged protocols such as Modbus that lack authentication, spurring investment in specialized intrusion detection and network segmentation tools.
Legacy OT Systems Create Persistent Interoperability Challenges
Industrial assets often run for decades on protocols without basic encryption. Modbus and OPC Classic cannot be patched without downtime, requiring costly compensating controls such as data diodes and virtual patching. The FBI labels end-of-life systems the "Achilles' heel" of infrastructure security, indicating that many upgrades depend on multi-year capital planning. These barriers slow the Critical Infrastructure Protection market even as compliance dates loom.
Other drivers and restraints analyzed in the detailed report include:
- Smart-Grid Modernization Integrates Physical and Cyber Protection
- 5G Network Expansion Creates New Attack Surfaces in Telecom Infrastructure
- Acute Workforce Shortages Limit Deployment Capabilities
For complete list of drivers and restraints, kindly check the Table Of Contents.
Segment Analysis
Solutions generated 65.40% of 2025 revenue; however, Services are projected to expand at a 5.45% CAGR as organizations confront mounting complexity. Managed detection and response, compliance auditing, and incident recovery are bundled into subscription contracts that transfer operational risk. Cloud Security Alliance guidance notes that zero-trust rollouts in OT require specialized road-mapping and 24/7 monitoring, workloads most enterprises lack in-house.
The Critical Infrastructure Protection market benefits as managed providers consolidate expertise through acquisitions such as GardaWorld's integration of OnSolve for critical-event management. Dragos' purchase of Network Perception adds continuous visualization of firewall rules to its industrial platform, broadening cross-sell potential. These moves illustrate how scale and breadth of service accelerate competitive advantage and underpin long-run recurring revenue.
Physical Safety and Security retained 56.10% of 2025 spend through perimeter surveillance, access control, and screening technologies. Yet the Cybersecurity segment is advancing 5.62% annually as threat actors migrate to IT-OT convergence points. The Critical Infrastructure Protection market size for SCADA/OT security is expected to rise sharply given new zero-trust baselines, while network micro-segmentation products isolate legacy assets without plant shutdowns.
Automatic response suites such as Siemens SIBERprotect isolate compromised nodes within milliseconds, demonstrating how machine-speed defense reshapes incident containment. Identity-and-access platforms built for air-gapped systems prevent credential sprawl. As capital planners seek integrated dashboards combining CCTV analytics with cyber alerts, convergence software continues to erode the historical divide between physical and digital safeguards.
Critical Infrastructure Protection Market is Segmented by Component (Solutions, Services), Security Type (Physical Safety and Security, Cybersecurity), Deployment Mode (On-Premise, Cloud/X-as-a-Service), Vertical (Energy and Power, BFSI, and More), and by Geography. The Market Forecasts are Provided in Terms of Value (USD).
Geography Analysis
North America maintained 35.70% of 2025 revenue, underpinned by CISA's performance-goal road map that aligns 16 sectors with mandatory reporting. Schneider Electric's USD 700 million manufacturing expansion demonstrates sustained capital inflows that localize supply chains and shorten response times for grid customers. The Department of Homeland Security's AI safety framework further standardizes risk posture, fostering home-market strength for domestic vendors.
Asia-Pacific posts the fastest regional CAGR at 4.08% to 2031. Japan's Active Cyber Defense Bill enables pre-emptive threat hunting, while the KDDI-NEC alliance scales managed supply-chain protection for industrial customers. ASEAN economies collectively budget USD 171 billion for cybersecurity by 2025, stimulating demand for localized SOCs and language-aware threat analytics. China's national programs and India's digital-public-infrastructure model broaden vendor opportunity, though unique encryption rules require country-specific product variants.
- BAE Systems PLC
- Honeywell International Inc.
- Lockheed Martin Corporation
- General Dynamics Corporation
- Northrop Grumman Corp.
- Hexagon AB
- Airbus SE
- General Electric Company
- Kaspersky Lab Inc.
- Waterfall Security Solutions Ltd.
- Ericsson AB
- Claroty
- Cisco Systems Inc.
- IBM Corporation
- ABB Ltd.
- Schneider Electric SE
- Raytheon Technologies Corp.
- Palo Alto Networks Inc.
- Siemens AG
- Johnson Controls International
- Thales Group
- Trellix
- Booz Allen Hamilton
- Darktrace PLC
- Fortinet
- Dragos
Additional Benefits:
- The market estimate (ME) sheet in Excel format
- 3 months of analyst support
TABLE OF CONTENTS
1 INTRODUCTION
- 1.1 Study Assumptions and Market Definition
- 1.2 Scope of the Study
2 RESEARCH METHODOLOGY
3 EXECUTIVE SUMMARY
4 MARKET LANDSCAPE
- 4.1 Market Overview
- 4.2 Market Drivers
- 4.2.1 Growing Government Mandates (e.g., NIS-2, CISA) in North America and EU
- 4.2.2 State-backed OT Cyber-attacks on Energy and Water Utilities
- 4.2.3 Smart-Grid Roll-outs Driving Integrated Physical-Cyber Spending
- 4.2.4 5G and Edge Expansion Increasing Telecom Attack Surface in Asia
- 4.2.5 IT-OT Convergence Accelerating Zero-Trust Adoption
- 4.2.6 Public Private Funding for Airport and Port Security in Middle East
- 4.3 Market Restraints
- 4.3.1 Legacy OT-Security Interoperability Gaps
- 4.3.2 Shortage of OT-Skilled Cybersecurity Workforce
- 4.3.3 High Total Cost of Ownership of End-to-End Solutions
- 4.3.4 Fragmented Regulations in Emerging Economies
- 4.4 Value / Supply-Chain Analysis
- 4.5 Regulatory and Technological Outlook
- 4.6 Porter's Five Forces
- 4.6.1 Bargaining Power of Suppliers
- 4.6.2 Bargaining Power of Buyers
- 4.6.3 Threat of New Entrants
- 4.6.4 Threat of Substitutes
- 4.6.5 Degree of Competition
5 MARKET SIZE AND GROWTH FORECASTS (VALUE)
- 5.1 By Component
- 5.1.1 Solutions
- 5.1.2 Services
- 5.2 By Security Type
- 5.2.1 Physical Safety and Security
- 5.2.1.1 Screening and Scanning
- 5.2.1.1.1 Video Surveillance
- 5.2.1.1.2 Access Control
- 5.2.1.1.3 PSIM and PIAM
- 5.2.1.1.4 CBRNE Detection
- 5.2.1.2 Cybersecurity
- 5.2.1.2.1 Network Security
- 5.2.1.2.2 SCADA / OT Security
- 5.2.1.2.3 Identity and Access Management
- 5.2.1.2.4 Data and Application Security
- 5.2.1.2.5 Secure Communications
- 5.2.1.1 Screening and Scanning
- 5.2.1 Physical Safety and Security
- 5.3 By Deployment Mode
- 5.3.1 On-premise
- 5.3.2 Cloud / X-as-a-Service
- 5.4 By Vertical
- 5.4.1 Energy and Power
- 5.4.2 BFSI
- 5.4.3 Transportation
- 5.4.4 Telecommunications
- 5.4.5 Government and Defense
- 5.4.6 Chemical and Manufacturing
- 5.4.7 Healthcare and Life Sciences
- 5.4.8 Sensitive Infrastructure and Data Centers
- 5.5 By Geography
- 5.5.1 North America
- 5.5.1.1 United States
- 5.5.1.2 Canada
- 5.5.1.3 Mexico
- 5.5.2 South America
- 5.5.2.1 Brazil
- 5.5.2.2 Argentina
- 5.5.2.3 Rest of South America
- 5.5.3 Europe
- 5.5.3.1 United Kingdom
- 5.5.3.2 Germany
- 5.5.3.3 France
- 5.5.3.4 Italy
- 5.5.3.5 Spain
- 5.5.3.6 Rest of Europe
- 5.5.4 Asia-Pacific
- 5.5.4.1 China
- 5.5.4.2 Japan
- 5.5.4.3 India
- 5.5.4.4 South Korea
- 5.5.4.5 New Zealand
- 5.5.4.6 Rest of Asia-Pacific
- 5.5.5 Middle East and Africa
- 5.5.5.1 Middle East
- 5.5.5.1.1 GCC
- 5.5.5.1.2 Turkey
- 5.5.5.1.3 Israel
- 5.5.5.1.4 Rest of Middle East
- 5.5.5.2 Africa
- 5.5.5.2.1 South Africa
- 5.5.5.2.2 Nigeria
- 5.5.5.2.3 Egypt
- 5.5.5.2.4 Rest of Africa
- 5.5.5.1 Middle East
- 5.5.1 North America
6 COMPETITIVE LANDSCAPE
- 6.1 Market Concentration
- 6.2 Strategic Moves
- 6.3 Market Share Analysis
- 6.4 Company Profiles (includes Global level Overview, Market level overview, Core Segments, Financials as available, Strategic Information, Market Rank/Share for key companies, Products and Services, and Recent Developments)
- 6.4.1 BAE Systems PLC
- 6.4.2 Honeywell International Inc.
- 6.4.3 Lockheed Martin Corporation
- 6.4.4 General Dynamics Corporation
- 6.4.5 Northrop Grumman Corp.
- 6.4.6 Hexagon AB
- 6.4.7 Airbus SE
- 6.4.8 General Electric Company
- 6.4.9 Kaspersky Lab Inc.
- 6.4.10 Waterfall Security Solutions Ltd.
- 6.4.11 Ericsson AB
- 6.4.12 Claroty
- 6.4.13 Cisco Systems Inc.
- 6.4.14 IBM Corporation
- 6.4.15 ABB Ltd.
- 6.4.16 Schneider Electric SE
- 6.4.17 Raytheon Technologies Corp.
- 6.4.18 Palo Alto Networks Inc.
- 6.4.19 Siemens AG
- 6.4.20 Johnson Controls International
- 6.4.21 Thales Group
- 6.4.22 Trellix
- 6.4.23 Booz Allen Hamilton
- 6.4.24 Darktrace PLC
- 6.4.25 Fortinet
- 6.4.26 Dragos
7 MARKET OPPORTUNITIES AND FUTURE OUTLOOK
- 7.1 White-space and Unmet-Need Assessment