


|
시장보고서
상품코드
1851282
분산형 발전 시장 : 시장 점유율 분석, 산업 동향, 통계, 성장 예측(2025-2030년)Distributed Power Generation - Market Share Analysis, Industry Trends & Statistics, Growth Forecasts (2025 - 2030) |
||||||
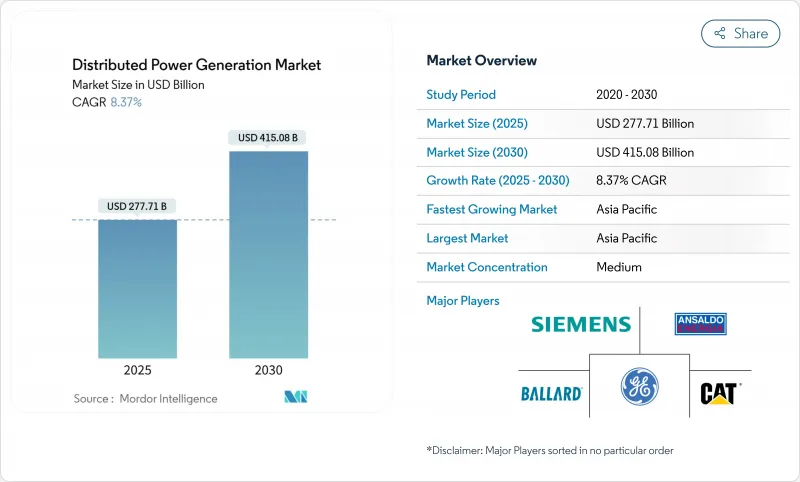
분산형 발전 시장 규모는 2025년에 2,777억 1,000만 달러로 추정되고, 예측 기간(2025-2030년) CAGR 8.37%로 성장할 전망이며, 2030년에는 4,150억 8,000만 달러에 이를 것으로 예측됩니다.
이 확장은 집중공급에서 태양광, 연료 플렉서블 엔진 및 디지털 제어를 결합한 지역 자산으로의 구조적 전환을 반영합니다. 설비의 비용 절감, 재생에너지 추진 규제, 계통 회복 요구의 고조가 주요한 가속 요인이 되고 있습니다. 아시아태평양은 양과 기세를 지원하고 북미는 풍부한 가스를 활용하고 유럽은 에너지 안보를 중시합니다. 기술 경쟁은 수소를 지원하는 연료전지 및 스토리지, 소프트웨어 및 서비스를 번들로 제공하는 통합 마이크로그리드를 중심으로 전개됩니다. 동시에 상호 연결 병목 현상, 에너지 저장 자본 요구 및 배출 규제 강화가 투자 위험을 형성하고 있습니다.
세계의 분산형 발전 시장 동향 및 인사이트
소규모 태양광 발전의 LCOE가 급속히 저하
중국의 TOPCon 모듈 가격은 2024년에 와트당 0.16달러까지 하락하고, 지역 전체의 평준화 전기 요금 하락을 촉진하며 분산형 경제를 재구축합니다. 설치 작업의 표준화, 저비용 인버터, 금융 우대 조치가 효과를 확대하고, 아시아태평양은 소규모 태양광 발전의 세계적인 벤치마크가 됩니다. 각국 정부는 허가 및 그리드 코드 규칙을 간소화하고 프로젝트 주기를 더욱 단축하고 있습니다. 가격 압력으로 인해 다른 지역 공급업체는 효율성 및 용도에 특화된 설계로 차별화를 도모해야 합니다.
상업용 및 산업용 비하인드 더 미터 설치의 활황
유럽 기업들은 불안정한 도매 가격을 헤지하고 기업의 탈탄소화 공약을 달성하기 위해 자가 발전을 가속화하고 있습니다. 독일에서는 2026년부터 신축 상업 빌딩에 태양광 발전 도입을 의무화하고, 2028년까지 개수 공사로 확대하는 EU의 규칙을 받고 지붕 설치가 기록적으로 증가하고 있습니다. 태양광 발전과 결합된 배터리 시스템은 부하 시프트와 언시러리 서비스 수입을 가능하게 하여 분산 자산을 금융 및 환경 도구로 만듭니다. 북미 기업은 연방 정부의 세제 우대 조치와 국가의 청정 에너지 의무화를 통해이 모델을 모방합니다.
신흥국의 배전망 상호 연결 장벽
세계 상호연결 대기열에서 대기하는 재생가능 에너지는 3,000GW를 초과하며 비용 상승과 긴 조사를 위해 신청의 80%가 철회됩니다. 신흥국의 송전망은 현대적인 표준과 노동력이 부족하기 때문에 소규모 프로젝트는 불균형한 지연에 직면하고 있습니다. '선착순' 개혁이 진행중이지만, 선진 시장 이외의 진전은 여전히 완만하고, 단기적인 보급을 억제하고 있습니다.
부문 분석
솔라 부문은 2024년 매출의 35%를 차지하였고, 간소화된 가대와 인버터 키트를 활용한 주택용 및 경상업용 지붕이 그 중심입니다. 2024년 분산형 발전 시장 규모에서 차지하는 태양광 발전의 점유율은 889억 달러였습니다. 현재는 규모는 작지만, 연료전지의 CAGR은 11.8%로 가장 높고, 디젤 연료를 사용하지 않는 업타임을 요구하는 데이터센터 캠퍼스에서의 프로젝트가 견인하고 있습니다. Caterpillar는 와이오밍의 하이퍼스케일 시설에서 99.999%의 서비스 수준 목표를 달성한 1.5MW 수소 연료전지 백업 시스템을 검증했습니다. 풍력 마이크로터빈과 레시프로 가스 엔진은 토지 이용 효율과 열전 병급 능력을 중시하는 틈새 시설에 대응하고 있습니다. 경쟁의 중심은 단일 발전 설비보다 축전 설비 및 전력 전자 제품의 통합입니다.
0-100kW의 가정용 소규모 기업용 시스템은 키트 기반 조달과 턴키 설치 모델을 반영하여 2024년 수요의 47%를 차지했습니다. 이 부문은 대수 기반에서 가장 큰 시장 세분화 점유율을 차지합니다. 한편, 1,000kW 이상의 솔루션은 산업용 캠퍼스가 송전망의 제약을 회피하기 위해 자가발전을 선택하기 때문에 2030년까지 연평균 복합 성장률(CAGR)이 10.2%를 기록합니다. 벤더는 디지털 트윈과 O&M 애널리틱스를 통해 차별화를 도모하고 전력 회사의 요금표에 비추어 디스패치를 미세 조정합니다. 101-1,000kW의 미드레인지 패키지는 병원과 대학 부지에 설치되어 표준화된 스키드와 제한적인 맞춤 엔지니어링의 균형을 맞추고 있습니다.
분산형 발전 시장 보고서는 기술별(태양광, 풍력 터빈, 가스 터빈, 디젤 발전기, 연료전지, 기타), 정격별(0-100KW, 101-1,000KW, 기타), 연료 유형별(재생 가능, 비재생 가능), 연결성별(온그리드, 오프 그리드), 최종 사용자별(주택, 통신, 데이터센터 등), 지역별(북미, 유럽, 아시아태평양, 남미, 중동 및 아프리카)로 분류됩니다.
지역 분석
2024년 분산형 발전 시장의 매출 점유율은 아시아태평양이 44%를 차지하였고, 2030년까지 CAGR 11.1%로 가장 빠른 성장이 전망됩니다. 이 지역의 리더십은 대량 생산되는 PV 모듈, 광범위한 정책 인센티브, 급증하는 전력 수요에 의해 지원됩니다. 중국의 지붕 위 프로그램만으로도 2024년에는 50GW 이상의 신규 용량이 실현되었고, 인도의 배전 사업자는 지붕 위 설치를 가상 발전소에 집약하고 있습니다. 동남아시아의 일부 정부는 인터넷 과금 제도를 공식화하고 비하인드 더 미터에 대한 투자를 개방하고 있습니다.
북미는 절대치로 2위이며, 풍부한 천연가스 공급 및 유리한 세액 공제를 겸비하고 있습니다. 아메리칸 뮤니시펄 파워(American Municipal Power)가 미시간주에서 실시하고 있는 20MW의 비하인드 더 미터 프로그램은 지자체 전력 회사가 지역의 발전을 피크 컷에 활용하는 방법의 전형적입니다. 30개 주 수준의 신재생에너지 포트폴리오 기준이 학교와 지자체 시설에서 태양광+축전을 촉진하고 있습니다. 버지니아, 텍사스 및 앨버타의 데이터센터 클러스터는 듀얼 연료 엔진 및 수소 대응 엔진의 조기 채용을 추진하고 지역 수요 프로파일을 더욱 향상시키고 있습니다.
유럽의 분산형 전략은 지정학적 가스 공급을 중단한 에너지 안보의 요청과 일치합니다. EU Solar Standard는 2026년부터 신축 상업 빌딩에 태양광 발전을 통합할 것을 의무화하고 개발자를 분산형 레이아웃으로 향하게 합니다. 프랑스에서는 1,500㎡ 이상의 주차장에 50%의 태양광 발전을 의무화, 위반한 경우에는 최고 4만 유로의 벌금을 부과함으로써 상업용 부동산의 개수를 가속시키고 있습니다. 독일은 800W까지 '발코니 발전소'의 등록을 간소화하여 가정 참여를 넓혔습니다. 역사적인 도시 중심부에서는 유산적인 입지의 제약이나 시 수준에서의 허가에 시간이 걸리기 때문에 그 성장이 억제되고 있습니다.
기타 혜택 :
- 엑셀 형식 시장 예측(ME) 시트
- 3개월간의 애널리스트 서포트
목차
제1장 서론
- 조사의 전제조건 및 시장 정의
- 조사 범위
제2장 조사 방법
제3장 주요 요약
제4장 시장 상황
- 시장 개요
- 시장 성장 촉진요인
- 아시아에서 소규모 태양광 발전의 LCOE의 급속한 저하
- 유럽에서 상업 및 산업용(C&I) 비하인드 더 미터 설치의 활황
- 아프리카 및 섬도부에서의 통신탑에 대한 마이크로그리드 도입
- 천연가스 가격 변동이 북미의 바이오가스 발전기 수요 시프트 초래
- 미국의 지자체 유틸리티에서 재생에너지 및 포트폴리오 기준(RPS)의 의무화
- 중동 데이터센터의 수소 준비 연료전지 파일럿 사업
- 시장 성장 억제요인
- 신흥 경제국의 배전망 상호 접속 장벽
- 간헐적 DG를 위한 자본 집약적 에너지 스토리지 페어링
- 엄격한 NOx/PM 규제가 EU 도시에서의 디젤 발전기 판매 억제
- 역사적 중심 시가지에서 지붕 위 태양광 발전의 복잡한 허가 제도
- 공급망 분석
- 규제 전망
- 기술의 전망
- Porter's Five Forces
- 공급기업의 협상력
- 소비자의 협상력
- 신규 참가업체의 위협
- 대체품의 위협
- 경쟁 기업 간 경쟁 관계
제5장 시장 규모 및 성장 예측
- 기술별
- 태양광 발전(5 MW 이하 옥상 및 지상 설치형)
- 풍력 터빈(5 MW 이하)
- 마이크로터빈
- 가스 터빈(50 MW 이하)
- 연료전지(PEMFC, SOFC, 기타)
- 디젤 발전기
- 천연가스 발전기
- 수력 발전 및 소수력 발전(10 MW 이하)
- 기타(바이오매스 CHP, 스털링 엔진)
- 정격 출력별
- 0-100 kW
- 101-1,000 kW
- 1,000 kW 이상
- 연료 유형별
- 재생 가능
- 비재생 가능
- 접속성별
- 온그리드
- 오프그리드 및 원격
- 최종 사용자별
- 주택
- 상업 시설
- 공업 및 제조업
- 전력회사 및 IPP 피크/예비
- 텔레콤 데이터센터
- 지역별
- 북미
- 미국
- 캐나다
- 멕시코
- 유럽
- 영국
- 독일
- 프랑스
- 스페인
- 북유럽 국가
- 러시아
- 기타 유럽
- 아시아태평양
- 중국
- 인도
- 일본
- 한국
- 말레이시아
- 태국
- 인도네시아
- 베트남
- 호주
- 기타 아시아태평양
- 남미
- 브라질
- 아르헨티나
- 콜롬비아
- 기타 남미
- 중동 및 아프리카
- 아랍에미리트(UAE)
- 사우디아라비아
- 남아프리카
- 이집트
- 기타 중동 및 아프리카
- 북미
제6장 경쟁 구도
- 시장 집중도
- 전략적 움직임(M&A, 파트너십, PPA)
- 시장 점유율 분석(주요 기업의 시장 순위 및 점유율)
- 기업 프로파일
- Caterpillar Inc.
- Cummins Inc.
- Siemens AG
- General Electric Co.
- Schneider Electric SE
- Ansaldo Energia SpA
- Ballard Power Systems Inc.
- Bloom Energy Corp.
- Capstone Turbine Corp.
- FuelCell Energy Inc.
- Rolls-Royce plc(mtu Onsite Energy)
- Aggreko Ltd.
- Yanmar Holdings Co., Ltd.
- Wartsila Corp.
- Kohler Co.
- Canadian Solar Inc.
- Sunverge Energy Inc.
- MTU Aero Engines AG Microgrid Solutions
- Generac Power Systems Inc.
- Plug Power Inc.
제7장 시장 기회 및 향후 전망
AJY 25.11.21The Distributed Power Generation Market size is estimated at USD 277.71 billion in 2025, and is expected to reach USD 415.08 billion by 2030, at a CAGR of 8.37% during the forecast period (2025-2030).

The expansion reflects a structural move from centralized supply toward local assets that combine solar, fuel-flexible engines, and digital controls. Widespread equipment cost reductions, pro-renewable regulations, and rising grid-resilience needs are the main accelerants. Asia-Pacific anchors volume and momentum, while North America leverages abundant gas, and Europe focuses on energy security. Technology competition revolves around hydrogen-ready fuel cells and integrated microgrid offerings that bundle storage, software, and services. At the same time, interconnection bottlenecks, energy-storage capital needs, and tightening emission caps shape investment risk.
Global Distributed Power Generation Market Trends and Insights
Rapid Decline in Small-Scale Solar-PV LCOE
Chinese TOPCon module prices fell to USD 0.16 per watt in 2024, driving a region-wide drop in levelized electricity costs and reshaping distributed economics. Installation labor standardization, low-cost inverters, and concessional finance amplify the effect, positioning Asia-Pacific as the global benchmark for small-scale PV. Governments streamline permitting and grid-code rules, further shortening project cycles. The price pressure forces suppliers elsewhere to differentiate on efficiency and application-specific design.
Booming Commercial & Industrial Behind-the-Meter Installations
European firms accelerate on-site generation to hedge volatile wholesale prices and meet corporate decarbonization pledges. Record rooftop additions in Germany follow EU rules that require solar on new commercial buildings from 2026, broadening to retrofits by 2028. Battery systems paired with PV allow load shifting and ancillary service income, making distributed assets a financial and environmental tool. North American businesses replicate the model, spurred by federal tax incentives and state clean-energy mandates.
Distribution-Network Interconnection Barriers in Emerging Economies
Renewables waiting in global interconnection queues exceed 3,000 GW, and 80% of applications are withdrawn due to escalating costs or long studies. Emerging grids lack modern standards and workforce capacity, so small projects face disproportionate delays. Although a "first-ready, first-served" reform is underway, progress outside advanced markets remains slow, restraining near-term deployment.
Other drivers and restraints analyzed in the detailed report include:
- Microgrid Adoption for Telecom Towers across Africa & Islands
- Natural-Gas Price Volatility Shifting Demand toward Biogas Gensets
- Capital-Intensive Energy-Storage Pairing for Intermittent DG
For complete list of drivers and restraints, kindly check the Table Of Contents.
Segment Analysis
The solar segment commanded 35% of 2024 revenues, anchored by residential and light-commercial rooftops that capitalize on simplified mounting and inverter kits. Solar's share of the distributed power generation market size for 2024 stood at USD 88.9 billion. Though smaller today, fuel cells deliver the highest 11.8% CAGR, led by projects at data-center campuses where operators seek diesel-free uptime. Caterpillar validated a 1.5 MW hydrogen fuel-cell backup system that met a 99.999% service-level target for a hyperscale facility in Wyoming. Wind micro-turbines and reciprocating gas engines round out the mix, serving niche sites that value either land-use efficiency or combined heat-and-power capability. Competitive dynamics now center on integrating storage and power electronics rather than standalone generation hardware.
Household and small-business systems in the 0-100 kW bracket captured 47% of 2024 demand, reflecting kit-based procurement and turnkey installation models. The segment accounted for the largest distributed power generation market share in unit terms. At the other extreme, Above 1,000 kW solutions will record a 10.2% CAGR through 2030 as industrial campuses opt for on-site generation to bypass grid constraints. Vendors differentiate through digital twins and O&M analytics that fine-tune dispatch against utility tariffs. Mid-range 101-1,000 kW packages serve hospitals and university estates, balancing standardized skids with limited custom engineering.
The Distributed Power Generation Market Report is Segmented by Technology (Solar, Wind Turbines, Gas Turbines, Diesel Gensets, Fuel Cells, and More), by Rating (0 To 100 KW, 101 To 1, 000 KW, and More), Fuel Type (Renewable and Non-Renewable), Connectivity (On-Grid and Off-Grid), End-User (Residential, Telecom and Data Centers, and More), and Geography (North America, Europe, Asia-Pacific, South America, and Middle East and Africa).
Geography Analysis
Asia-Pacific dominated the distributed power generation market with a 44% revenue share in 2024 and continues to post the fastest 11.1% CAGR to 2030. Regional leadership rests on mass-manufactured PV modules, extensive policy incentives, and surging electricity demand. China's rooftop program alone realized more than 50 GW of new capacity in 2024, while India's distribution utilities aggregate rooftop installations into virtual power plants. Several Southeast Asian governments are formalizing net-billing regimes, unlocking behind-the-meter investment.
North America ranks second in absolute value and combines an abundant natural gas supply with favorable tax credits. American Municipal Power's 20 MW behind-the-meter program in Michigan typifies how municipal utilities leverage local generation for peak shaving. Thirty state-level renewable portfolio standards catalyze solar-plus-storage at schools and municipal facilities. Data-center clusters in Virginia, Texas, and Alberta drive early adoption of dual-fuel or hydrogen-ready engines, further lifting the region's demand profile.
Europe's distributed strategy aligns with energy-security imperatives following geopolitical gas disruptions. The EU Solar Standard obliges new commercial buildings to integrate PV from 2026, pushing developers toward distributed layouts. France mandates 50% solar coverage on parking lots over 1 500 m2, with fines up to EUR 40 000 for non-compliance, accelerating commercial-real-estate retrofits. Germany simplified the registration of "balcony power plants" up to 800 W, broadening household participation. Heritage-site constraints and lengthy city-level permitting temper growth in historic urban cores.
- Caterpillar Inc.
- Cummins Inc.
- Siemens AG
- General Electric Co.
- Schneider Electric SE
- Ansaldo Energia SpA
- Ballard Power Systems Inc.
- Bloom Energy Corp.
- Capstone Turbine Corp.
- FuelCell Energy Inc.
- Rolls-Royce plc (mtu Onsite Energy)
- Aggreko Ltd.
- Yanmar Holdings Co., Ltd.
- Wartsila Corp.
- Kohler Co.
- Canadian Solar Inc.
- Sunverge Energy Inc.
- MTU Aero Engines AG Microgrid Solutions
- Generac Power Systems Inc.
- Plug Power Inc.
Additional Benefits:
- The market estimate (ME) sheet in Excel format
- 3 months of analyst support
TABLE OF CONTENTS
1 Introduction
- 1.1 Study Assumptions & Market Definition
- 1.2 Scope of the Study
2 Research Methodology
3 Executive Summary
4 Market Landscape
- 4.1 Market Overview
- 4.2 Market Drivers
- 4.2.1 Rapid Decline in Small-Scale Solar-PV LCOE in Asia
- 4.2.2 Booming Commercial & Industrial (C&I) Behind-the-Meter Installations in Europe
- 4.2.3 Microgrid Adoption for Telecom Towers across Africa & Islands
- 4.2.4 Natural-Gas Price Volatility Shifting Demand toward Biogas Gensets in North America
- 4.2.5 Mandated Renewable Portfolio Standards (RPS) in U.S. Municipal Utilities
- 4.2.6 Hydrogen-Ready Fuel-Cell Pilots in Middle-East Data Centers
- 4.3 Market Restraints
- 4.3.1 Distribution-Network Interconnection Barriers in Emerging Economies
- 4.3.2 Capital-Intensive Energy-Storage Pairing for Intermittent DG
- 4.3.3 Stringent NOx/PM Limits Curtailing Diesel Genset Sales in EU Urban Areas
- 4.3.4 Complex Permitting for Rooftop PV in Historic City Centers
- 4.4 Supply-Chain Analysis
- 4.5 Regulatory Outlook
- 4.6 Technological Outlook
- 4.7 Porters Five Forces
- 4.7.1 Bargaining Power of Suppliers
- 4.7.2 Bargaining Power of Consumers
- 4.7.3 Threat of New Entrants
- 4.7.4 Threat of Substitute Products & Services
- 4.7.5 Intensity of Competitive Rivalry
5 Market Size & Growth Forecasts
- 5.1 By Technology
- 5.1.1 Solar Photovoltaic (Rooftop & Ground-Mounted <=5 MW)
- 5.1.2 Wind Turbines (<=5 MW)
- 5.1.3 Microturbines
- 5.1.4 Gas Turbines (<=50 MW)
- 5.1.5 Fuel Cells (PEMFC, SOFC, Others)
- 5.1.6 Diesel Gensets
- 5.1.7 Natural-Gas Gensets
- 5.1.8 Hydrokinetic and Small Hydro (<=10 MW)
- 5.1.9 Others (Biomass CHP, Stirling Engines)
- 5.2 By Power Rating
- 5.2.1 0 to 100 kW
- 5.2.2 101 to 1,000 kW
- 5.2.3 Above 1,000 kW
- 5.3 By Fuel Type
- 5.3.1 Renewable
- 5.3.2 Non-Renewable
- 5.4 By Connectivity
- 5.4.1 On-Grid
- 5.4.2 Off-Grid and Remote
- 5.5 By End-user
- 5.5.1 Residential
- 5.5.2 Commercial and Institutional
- 5.5.3 Industrial and Manufacturing
- 5.5.4 Utility and IPP Peaking/Reserve
- 5.5.5 Telecom and Data Centers
- 5.6 By Geography
- 5.6.1 North America
- 5.6.1.1 United States
- 5.6.1.2 Canada
- 5.6.1.3 Mexico
- 5.6.2 Europe
- 5.6.2.1 United Kingdom
- 5.6.2.2 Germany
- 5.6.2.3 France
- 5.6.2.4 Spain
- 5.6.2.5 Nordic Countries
- 5.6.2.6 Russia
- 5.6.2.7 Rest of Europe
- 5.6.3 Asia-Pacific
- 5.6.3.1 China
- 5.6.3.2 India
- 5.6.3.3 Japan
- 5.6.3.4 South Korea
- 5.6.3.5 Malaysia
- 5.6.3.6 Thailand
- 5.6.3.7 Indonesia
- 5.6.3.8 Vietnam
- 5.6.3.9 Australia
- 5.6.3.10 Rest of Asia-Pacific
- 5.6.4 South America
- 5.6.4.1 Brazil
- 5.6.4.2 Argentina
- 5.6.4.3 Colombia
- 5.6.4.4 Rest of South America
- 5.6.5 Middle East and Africa
- 5.6.5.1 United Arab Emirates
- 5.6.5.2 Saudi Arabia
- 5.6.5.3 South Africa
- 5.6.5.4 Egypt
- 5.6.5.5 Rest of Middle East and Africa
- 5.6.1 North America
6 Competitive Landscape
- 6.1 Market Concentration
- 6.2 Strategic Moves (M&A, Partnerships, PPAs)
- 6.3 Market Share Analysis (Market Rank/Share for key companies)
- 6.4 Company Profiles (includes Global level Overview, Market level overview, Core Segments, Financials as available, Strategic Information, Products & Services, and Recent Developments)
- 6.4.1 Caterpillar Inc.
- 6.4.2 Cummins Inc.
- 6.4.3 Siemens AG
- 6.4.4 General Electric Co.
- 6.4.5 Schneider Electric SE
- 6.4.6 Ansaldo Energia SpA
- 6.4.7 Ballard Power Systems Inc.
- 6.4.8 Bloom Energy Corp.
- 6.4.9 Capstone Turbine Corp.
- 6.4.10 FuelCell Energy Inc.
- 6.4.11 Rolls-Royce plc (mtu Onsite Energy)
- 6.4.12 Aggreko Ltd.
- 6.4.13 Yanmar Holdings Co., Ltd.
- 6.4.14 Wartsila Corp.
- 6.4.15 Kohler Co.
- 6.4.16 Canadian Solar Inc.
- 6.4.17 Sunverge Energy Inc.
- 6.4.18 MTU Aero Engines AG Microgrid Solutions
- 6.4.19 Generac Power Systems Inc.
- 6.4.20 Plug Power Inc.
7 Market Opportunities & Future Outlook
- 7.1 White-space & Unmet-Need Assessment
