|
시장보고서
상품코드
1906938
인도네시아의 재생에너지 시장 : 시장 점유율 분석, 산업 동향 통계, 성장 예측(2026-2031년)Indonesia Renewable Energy - Market Share Analysis, Industry Trends & Statistics, Growth Forecasts (2026 - 2031) |
||||||
인도네시아의 재생에너지 시장 규모는 2026년 18.4 기가와트에 달할 것으로 예측되고 있습니다. 이것은 2025년 15.97 기가와트에서 성장한 수치이며, 2031년에는 37.32 기가와트에 이를 것으로 전망되고 있습니다. 2026-2031년 CAGR 15.20%로 확대될 전망입니다.

강력한 정책의 뒷받침, 기술 비용 저하, 기업 수요 증가가 이 기세를 이끌고 있으며, 정부는 기후 목표와 경제 성장의 균형을 이루고 있습니다. 프라보워 스비언트 대통령이 2025년 1월 총 72조 루피아(44억 달러)에 달하는 37개 전력 프로젝트를 기공한 것은 송전망 업그레이드와 신규 용량에 대한 국가의 지원을 강조하는 것입니다. 수력 발전이 여전히 발전구성의 주류를 차지하고 있는 한편, 태양광 발전은 프로젝트 경제성의 개선 및 독립계 발전 사업자(IPP)에 의한 기존 자산 이외의 사업 다각화에 의해 가장 급속한 성장을 기록하고 있습니다. 200억 달러 규모의 공정한 에너지 이행 파트너십을 포함한 기후 변화 관련 자금의 유입에 의해 자본제약은 완화되고 있지만, 석탄화력 발전의 과잉 설비 및 국영전력회사(PLN)의 단일 구매자 모델이 민간투자의 족쇄가 되고 있습니다.
인도네시아의 재생에너지 시장 동향 및 인사이트
태양광 및 풍력 발전의 LCOE 저하
2024년 세계의 태양광 발전 비용은 평균 0.044달러/kWh, 육상 풍력 발전은 0.033달러/kWh까지 떨어졌으며 석탄의 0.065달러/kWh라는 기준치를 밑돌았습니다. 인도네시아에서는 2024년 8월에 현지 조달 규제가 완화되어 개발업체는 보다 저렴한 모듈을 수입하면서 국내 조립을 유지할 수 있게 되었기 때문에 프로젝트 파이프라인이 가속화되고 있습니다. 이러한 경제성에서 PLN(인도네시아 국영전력회사)은 발전 비용 억제에 주력하고 있으며, 특히 연료비 절감 효과 및 탄소 가격 리스크가 신규 건설의 경제성을 재생에너지에 기울이는 요인이 되고 있습니다. 그 결과 인도네시아의 재생에너지 시장에서는 신규 발전 용량의 추가에 있어서 태양광 및 풍력으로의 꾸준한 전환이 진행되고 있습니다. 진행 중인 자금 조달 개혁은 개발자가 한때 직면했던 프리미엄을 축소하여 비용 패리티를 더욱 확대하고 있습니다.
RUPTL 2025-34 계획에서 53GW의 신규 재생에너지 용량 파이프라인
인도네시아의 전력 공급 계획에서는 2034년까지 69.5기가와트의 새로운 용량이 요구되고 있으며, 그 76%가 재생에너지 또는 축전 설비가 됩니다. 이를 위해서는 2,967조 루피아(1,825억 달러)의 투자가 필요합니다. 이 계획의 73%는 민간 파트너십을 통한 자금 조달이 예상되며, 인도네시아의 재생에너지 시장은 보다 깊은 기술 다양화로 전환하고 있습니다. 로드맵에서는 태양광 17.1GW, 풍력 7.2GW, 지열 5.2GW를 할당해 수력 발전의 종래의 우위성을 넘어, 보다 유연한 송전망의 실현을 목표로 합니다. 계획 중인 250MW 원자력 발전 유닛 2개는 장기적인 베이스 로드 저탄소 공급 추구를 보여주는 반면, 2040년까지 재생에너지 비율 41%를 달성하는 목표는 투자자에게 보다 명확한 전망을 제공합니다.
석탄의 과잉 설비 및 필수 운전 PPA
기존의 석탄화력 PPA(전력구입계약)에 의해 PLN(인도네시아 국영전력회사)은 발전소가 가동되지 않은 경우에도 용량 요금을 지불할 의무를 지고 있으며, 연간 80억 달러 이상의 부담이 되고 있습니다. 이러한 '마스터런' 조항은 경제성이 양호함에도 불구하고 보다 저렴한 재생에너지의 도입을 저해하고 단기적인 증가를 제한합니다. 석탄의 구조적 고정화는 에너지 이행 메커니즘에 근거한 조기 폐지 제도가 자금 조달을 확보하고 계약을 재협상함으로써 완화될 전망이지만, 그 스케줄은 불투명한 채로 인도네시아의 재생에너지 시장의 성장을 계속 억제하고 있습니다.
부문 분석
2025년 시점에서 수력발전은 인도네시아 재생에너지 시장 점유율의 47.70%를 차지했습니다. 이것은 2020년 이전에 가동한 기존 댐 때문입니다. 한편, 풍력 발전 용량은 2026-2031년 55.95%의 연평균 복합 성장률(CAGR)로 성장할 것으로 예측되고 있습니다. 이것은 술라웨시 섬의 해상 풍력 발전 지역과 남쪽 술라웨시주의 우수한 육상 사이트가 견인하는 것입니다. 수력 발전 분야의 인도네시아 재생에너지 시장 규모는 미래 증설이 이주 문제 우려를 피하는 소규모 유입식 프로젝트로 치우치기 때문에 완만한 성장이 예상됩니다. 한편, 태양광 발전 설비는 자바 섬, 발리 섬 및 부유식 저수지에서 급속히 확대되고 있어 용량 지불 대상이 되는 4시간 축전 시스템의 추가 설치가 추풍이 되고 있습니다.
풍력 발전의 급성장은 ACWA파워와 마스다르에 의한 합작 사업 자금 및 높은 설비 이용률에 의해 지원되고 있지만, 해저케이블 접속 및 해양 이용 구역의 정비는 미성숙한 상태가 계속되고 있습니다. 지열 프로젝트는 시추 리스크 및 높은 초기 비용에 제약받으면서도 연간 200-300MW의 꾸준한 증가를 계속하고 있으며, PLN(인도네시아 국영 전력회사)의 계통 계획을 지원하는 조정 가능한 베이스 로드 전원을 제공합니다. 바이오에너지의 성장은 팜 오일 생산 지역에서 바이오 매스 원료 수요를 안정화시키는 B40과 B50 혼합 의무를 따르고 있습니다. 해양 에너지는 요금 체계의 명확화를 기다리는 파일럿 규모의 단계에 머물고 있습니다. 이 진화하는 구성비에 의해 인도네시아의 재생에너지 시장은 금세기 말까지 변동성 재생에너지와 축전을 축으로 한 방향으로 전환할 전망입니다.
인도네시아 재생에너지 시장 보고서는 기술별(태양광 에너지, 풍력 에너지, 수력 발전, 바이오 에너지, 지열, 해양 에너지) 및 최종 사용자별(유틸리티, 상업 및 산업, 주택)로 분류됩니다. 시장 규모 및 예측은 설치 용량(GW) 단위로 제공됩니다.
기타 혜택 :
- 엑셀 형식 시장 예측(ME) 시트
- 애널리스트에 의한 3개월간의 지원
자주 묻는 질문
목차
제1장 서론
- 조사의 전제조건 및 시장 정의
- 조사 범위
제2장 조사 방법
제3장 주요 요약
제4장 시장 상황
- 시장 개요
- 시장 성장 촉진요인
- 태양광 및 풍력 발전의 LCOE 저하 경향
- RUPTL 2025-34 계획에서 53GW의 신규 재생에너지 도입 계획
- JETP 및 다자간 기후 금융 유입
- B40/B50 바이오연료 혼합의 의무화 추진
- 데이터센터 및 기업용 PPA의 급성장
- 마지막 마일 전화를 위한 오프 그리드 마이크로그리드
- 시장 성장 억제요인
- 석탄의 과잉 생산 능력 및 필수 운전 PPA
- ASEAN 국가와 비교한 높은 자본 비용
- PLN에 의한 단일 구매자 독점이 경쟁 제한
- 풍력 및 수력 발전소 용지 취득에 있어서의 분쟁
- 공급망 분석
- 규제 상황
- 기술 전망
- Porter's Five Forces
- 공급기업의 협상력
- 구매자의 협상력
- 신규 참가업체의 위협
- 대체품의 위협
- 경쟁 기업 간 경쟁 관계
- PESTEL 분석
제5장 시장 규모 및 성장 예측
- 기술별
- 태양광 에너지(PV 및 CSP)
- 풍력 에너지(육상 및 해상)
- 수력 발전(소규모, 대규모, PSH)
- 바이오 에너지
- 지열
- 해양 에너지(조력 및 파력)
- 최종 사용자별
- 전력 회사
- 상업 및 산업용
- 주택용
제6장 경쟁 구도
- 시장 집중도
- 전략적 움직임(M&A, 파트너십, 전력 구매 계약)
- 시장 점유율 분석(주요 기업의 시장 순위 및 점유율)
- 기업 프로파일
- PLN Renewables(PT Pembangkitan Jawa-Bali, PT Indonesia Power)
- Pertamina Geothermal Energy
- Star Energy Geothermal
- Medco Power Indonesia
- Canadian Solar Inc.
- Trina Solar Ltd
- PT Sumber Energi Sukses Makmur
- PT Barito Renewables Energy Tbk
- SEG Solar
- PT ATW Solar Indonesia
- Fourth Partner Energy Pvt Ltd
- Xurya Daya Indonesia
- TotalEnergies ENEOS
- ACWA Power
- Masdar
- Northstar PLTS
- Bright PLN Batam
- PT Supreme Energy
- PT Geo Dipa Energi
- PT Sarulla Operations
제7장 시장 기회 및 장래 전망
AJY 26.01.26Indonesia Renewable Energy market size in 2026 is estimated at 18.4 gigawatt, growing from 2025 value of 15.97 gigawatt with 2031 projections showing 37.32 gigawatt, growing at 15.20% CAGR over 2026-2031.
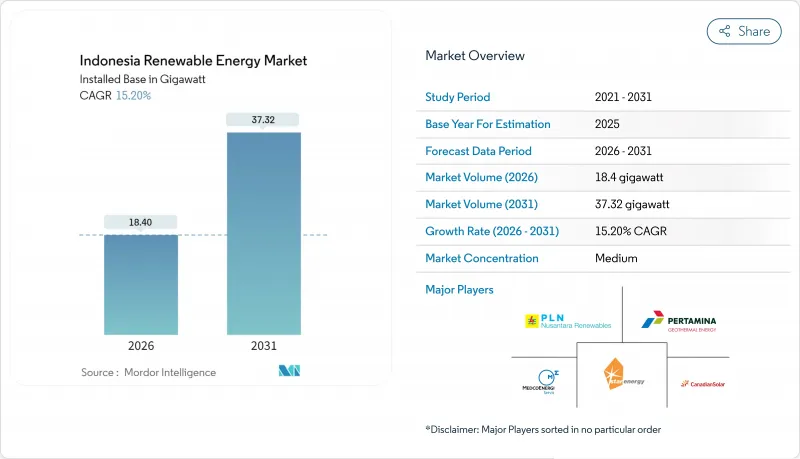
Strong policy tailwinds, falling technology costs, and rising corporate demand drive this momentum while the government balances climate goals with economic growth. President Prabowo Subianto's January 2025 inauguration of 37 electricity projects worth IDR 72 trillion (USD 4.4 billion) underscored state backing for grid upgrades and new capacity. Hydropower still leads the generation mix, yet solar PV registers the fastest growth as project economics improve, and independent power producers diversify beyond legacy assets. Climate-finance inflows, including the USD 20 billion Just Energy Transition Partnership, are easing capital constraints, though coal over-capacity and PLN's single-buyer model continue to slow private investment.
Indonesia Renewable Energy Market Trends and Insights
Falling solar & wind LCOE
Global average solar costs fell to USD 0.044/kWh in 2024 and onshore wind to USD 0.033/kWh, undercutting coal's USD 0.065/kWh benchmark. Indonesia's August 2024 relaxation of local-content rules lets developers import cheaper modules while keeping assembly onshore, accelerating project pipelines. These economics sharpen PLN's focus on curbing generation costs, especially as avoided fuel outlays and carbon-pricing risks tilt new-build economics toward renewables. The result is a steady pivot in the Indonesian renewable energy market toward solar and wind for green-field capacity additions. Ongoing financing reforms further magnify this cost parity by narrowing the premium that developers once faced.
RUPTL 2025-34 Pipeline of 53 GW New Renewable Capacity
Indonesia's power-supply plan calls for 69.5 GW of new capacity by 2034, 76% of which is renewable or storage, requiring IDR 2,967 trillion (USD 182.5 billion) in investment. Private partnerships are expected to fund 73% of this pipeline, shifting the Indonesian renewable energy market toward deeper technology diversification. The roadmap earmarks 17.1 GW solar, 7.2 GW wind, and 5.2 GW geothermal, moving beyond hydropower's historic dominance and enabling a more flexible grid. Two planned 250 MW nuclear units underscore a longer-term quest for baseload low-carbon supply, while the 41% renewable target for 2040 offers clearer visibility for investors.
Coal Over-Capacity & Must-Run PPAs
Legacy coal PPAs obligate PLN to pay capacity charges even when plants are idle, costing the utility more than USD 8 billion annually. These must-run clauses crowd out procurement of cheaper renewables, limiting short-term additions despite favorable economics. Coal's structural lock-in is set to ease only as early-retirement schemes under the Energy Transition Mechanism secure funding and renegotiate contracts, but the timetable remains uncertain and continues to temper growth in the Indonesian renewable energy market.
Other drivers and restraints analyzed in the detailed report include:
- JETP & Multilateral Climate-Finance Inflows
- Mandatory B40/B50 Biofuel Blending Push
- High Cost of Capital versus ASEAN Peers
For complete list of drivers and restraints, kindly check the Table Of Contents.
Segment Analysis
Hydropower held 47.70% of Indonesia's Renewable Energy market share in 2025, owing to legacy dams commissioned before 2020. Conversely, wind capacity is forecast to post a 55.95% CAGR from 2026 to 2031, fueled by offshore zones in Sulawesi and robust onshore sites in South Sulawesi. The Indonesian Renewable Energy market size for hydropower will grow slowly as future additions skew to small run-of-river projects that skirt resettlement controversies. Solar installations are accelerating in Java, Bali, and on floating reservoirs, benefiting from 4-hour battery add-ons that qualify for capacity payments.
Wind's rapid rise rests on higher capacity factors and joint-venture finance from ACWA Power and Masdar, although subsea-cable links and marine-use zoning remain underdeveloped. Geothermal projects add a steady 200-300 MW annually, constrained by drilling risk and high upfront cost, yet provide dispatchable baseload that anchors PLN's system planning. Bioenergy growth follows B40 and B50 blending mandates that stabilize biomass feedstock demand in palm-oil provinces. Ocean energy stays at pilot scale pending tariff clarity. The evolving mix will pivot the Indonesian Renewable Energy market toward variable renewables plus storage by the late decade.
The Indonesia Renewable Energy Market Report is Segmented by Technology (Solar Energy, Wind Energy, Hydropower, Bioenergy, Geothermal, and Ocean Energy) and End-User (Utilities, Commercial and Industrial, and Residential). The Market Sizes and Forecasts are Provided in Terms of Installed Capacity (GW).
List of Companies Covered in this Report:
- PLN Renewables (PT Pembangkitan Jawa-Bali, PT Indonesia Power)
- Pertamina Geothermal Energy
- Star Energy Geothermal
- Medco Power Indonesia
- Canadian Solar Inc.
- Trina Solar Ltd
- PT Sumber Energi Sukses Makmur
- PT Barito Renewables Energy Tbk
- SEG Solar
- PT ATW Solar Indonesia
- Fourth Partner Energy Pvt Ltd
- Xurya Daya Indonesia
- TotalEnergies ENEOS
- ACWA Power
- Masdar
- Northstar PLTS
- Bright PLN Batam
- PT Supreme Energy
- PT Geo Dipa Energi
- PT Sarulla Operations
Additional Benefits:
- The market estimate (ME) sheet in Excel format
- 3 months of analyst support
TABLE OF CONTENTS
1 Introduction
- 1.1 Study Assumptions & Market Definition
- 1.2 Scope of the Study
2 Research Methodology
3 Executive Summary
4 Market Landscape
- 4.1 Market Overview
- 4.2 Market Drivers
- 4.2.1 Falling solar & wind LCOE
- 4.2.2 RUPTL 2025-34 pipeline of 53 GW new RE
- 4.2.3 JETP & multilateral climate-finance inflows
- 4.2.4 Mandatory B40/B50 biofuel blending push
- 4.2.5 Data-centre & corporate PPA boom
- 4.2.6 Off-grid microgrids for last-mile electrification
- 4.3 Market Restraints
- 4.3.1 Coal over-capacity & must-run PPAs
- 4.3.2 High cost of capital vs ASEAN peers
- 4.3.3 PLN single-buyer monopoly limits competition
- 4.3.4 Land-acquisition conflicts in wind/hydro sites
- 4.4 Supply-Chain Analysis
- 4.5 Regulatory Landscape
- 4.6 Technological Outlook
- 4.7 Porters Five Forces
- 4.7.1 Bargaining Power of Suppliers
- 4.7.2 Bargaining Power of Buyers
- 4.7.3 Threat of New Entrants
- 4.7.4 Threat of Substitutes
- 4.7.5 Competitive Rivalry
- 4.8 PESTLE Analysis
5 Market Size & Growth Forecasts
- 5.1 By Technology
- 5.1.1 Solar Energy (PV and CSP)
- 5.1.2 Wind Energy (Onshore and Offshore)
- 5.1.3 Hydropower (Small, Large, PSH)
- 5.1.4 Bioenergy
- 5.1.5 Geothermal
- 5.1.6 Ocean Energy (Tidal and Wave)
- 5.2 By End-User
- 5.2.1 Utilities
- 5.2.2 Commercial and Industrial
- 5.2.3 Residential
6 Competitive Landscape
- 6.1 Market Concentration
- 6.2 Strategic Moves (M&A, Partnerships, PPAs)
- 6.3 Market Share Analysis (Market Rank/Share for key companies)
- 6.4 Company Profiles (includes Global level Overview, Market level overview, Core Segments, Financials as available, Strategic Information, Products & Services, and Recent Developments)
- 6.4.1 PLN Renewables (PT Pembangkitan Jawa-Bali, PT Indonesia Power)
- 6.4.2 Pertamina Geothermal Energy
- 6.4.3 Star Energy Geothermal
- 6.4.4 Medco Power Indonesia
- 6.4.5 Canadian Solar Inc.
- 6.4.6 Trina Solar Ltd
- 6.4.7 PT Sumber Energi Sukses Makmur
- 6.4.8 PT Barito Renewables Energy Tbk
- 6.4.9 SEG Solar
- 6.4.10 PT ATW Solar Indonesia
- 6.4.11 Fourth Partner Energy Pvt Ltd
- 6.4.12 Xurya Daya Indonesia
- 6.4.13 TotalEnergies ENEOS
- 6.4.14 ACWA Power
- 6.4.15 Masdar
- 6.4.16 Northstar PLTS
- 6.4.17 Bright PLN Batam
- 6.4.18 PT Supreme Energy
- 6.4.19 PT Geo Dipa Energi
- 6.4.20 PT Sarulla Operations
7 Market Opportunities & Future Outlook
- 7.1 White-space & Unmet-Need Assessment