


|
시장보고서
상품코드
1851306
사물인터넷(IoT) 시장 : 시장 점유율 분석, 산업 동향, 통계, 성장 예측(2025-2030년)Internet Of Things (IoT) - Market Share Analysis, Industry Trends & Statistics, Growth Forecasts (2025 - 2030) |
||||||
사물인터넷(IoT) 시장은 2025년에 1조 3,500억 달러로 추정되고, 2030년에는 2조 7,200억 달러에 이를 것으로 예측되며, CAGR 15.04%로 성장할 전망입니다.

실시간 분석, 예지보전, 자율적 의사결정 시스템에 대한 왕성한 수요가 공장, 농장, 물류 허브로의 전개를 가속화하고 있습니다. 5G의 급속한 배치, 저전력 광역 네트워크 성장, 센서 비용의 감소로 연결 자산의 대응 가능한 기반이 확대됩니다. 기업은 또한 밀리초 단위의 응답 시간을 보장하면서 데이터 주권을 보호하는 엣지 AI를 높이 평가합니다. 그 결과 투자는 파일럿 프로젝트에서 모든 주요 산업에서 본격적인 생산으로 전환하고 있습니다. 따라서 사물인터넷 시장은 탄력적인 설비 투자 및 효율성과 지속가능성을 목적으로 하는 규제상 인센티브에 뒷받침되는 견고한 기술기반으로 성장하고 있습니다.
세계의 사물인터넷(IoT) 시장 동향 및 인사이트
커넥티드 디바이스 보급 및 센서 비용 저하
기본 환경 센서의 단가는 20달러에서 5달러 이하로 떨어졌으며 공장과 농장 전체에서 고밀도 측정이 경제적으로 실행 가능합니다. 예지 보전에 사용되는 산업용 진동 센서는 불과 5년 전의 200-500달러에 비해 현재는 50-100달러로 판매되고 있습니다. 하드웨어 장벽이 낮아짐에 따라 새로운 소프트웨어 인티 그레이터가 증가하고 사물 인터넷 시장의 인재 풀이 확산되고 있습니다. BMW의 전용 5G 생산 네트워크는 이미 수천 개의 센서를 실시간으로 처리량을 최적화하는 에지 컨트롤러에 연결합니다. 반도체의 일시적인 부족은 비용 압력을 야기하지만 부품 수를 줄이는 설계 혁신은 가격 하락세를 유지합니다. 기업이 이전보다 더 작은 자산을 연결함에 따라 데이터 양이 급증하고 애널리틱스 서비스가 가장 빠르게 성장하는 수익 풀이 됩니다.
5G 및 LPWAN의 전개로 커버리지 확대
프라이빗 5G는 현재 초저지연 산업 제어를 지원하고 있으며 유연한 제조 라인이 무선 재구성에 의존하는 존디어의 워털루 공장에서 입증되었습니다. LoRaWAN과 NB-IoT 네트워크는 셀룰러의 경제성이 늦어진 원격지 필드, 광산, 파이프라인을 연결하여 5G를 보완합니다. 키네이스 및 기타 초소형 위성 사업자는 가축 무리와 해상 자산의 지속적인 시각화를 허용하고 남아있는 격차를 채웁니다. 통신 사업자는 주파수 대역과 백홀에 대한 투자를 조정하고 장치의 밀도와 실현 가능한 반환을 일치시킵니다. 이러한 액세스 옵션의 수렴으로 인해 사물 인터넷 시장은 인구 밀도가 높은 도시 캠퍼스와 인구가 적은 변경에 걸쳐 종합적인 길을 걷게 됩니다.
심각화하는 사이버 보안 및 개인 정보 침해
커넥티드 에셋은 공격 대상을 확대하고, 랜섬웨어는 이미 공장 라인을 정지시키며, 독자적인 레시피를 폭로하고 있습니다. EU의 사이버 탄력성 법은 암호화 및 패치 적용의 최소 의무를 정하고 있으며, 공급업체는 보다 높은 컴플라이언스 비용을 부담해야 합니다. 업계의 구매자는 보안 부팅 칩셋과 제로 트러스트 아키텍처를 요구하고 있으며 저비용 공급업체에게 장벽이 높습니다. 정보 유출 소식이 일시적으로 보급을 지연시킬 가능성은 있지만, 사물 인터넷 시장에서는 장기적인 보안 지출이 계약 총액 증가로 이어지는 경우가 많습니다.
부문 분석
서비스는 2024년 매출의 34%를 차지했으며, 기기 및 데이터를 측정 가능한 결과로 바꾸는 복잡성을 돋보이게 합니다. 컨설팅 팀은 워크플로를 매핑하고 안전한 아키텍처를 구축하며 센서 스트림을 운영 가치로 변환하는 대시보드를 최적화합니다. 하드웨어 가격은 계속 떨어지고 있지만 통합 수요는 전문가의 인건비를 늘리고 서비스가 사물인터넷 시장의 가장 큰 슬라이스임을 확고하게 합니다. 컨테이너 오케스트레이션과 OTA 패치를 융합시킨 엣지 플랫폼은 대기 시간과 데이터 거버넌스가 현장에 머무는 것을 구매자가 주장하는 가운데 CAGR 17.51%로 확대될 전망입니다. 연결 모듈은 비용 디플레이션을 흡수하고 수천 개의 엔드포인트에 걸쳐 용량을 재판매하는 솔루션 어셈블러의 이익률을 확대합니다.
유연한 인프라를 추구하는 움직임은 게이트웨이 에이전트가 무엇을 로컬에 남기고 무엇을 클라우드로 옮길지 결정하는 하이브리드 토폴로지를 추진합니다. 이러한 오케스트레이션은 하이퍼스케일 클라우드와 팩토리 플로어 컨트롤러 간의 API 조화에 대한 요구를 강화합니다. 소프트웨어 공급업체는 모델을 지속적으로 미세 조정하는 자동 ML 엔진을 통합하여 고객을 생태계에 고정하는 구독을 강화합니다. 한편, 위성통신 사업자는 지상통신사업자와 제휴하여 폴백 접속을 번들함으로써 사물인터넷 시장의 지리적 적용 범위를 넓히고 있습니다. 성과 기반 계약으로 하드웨어, 통합 및 라이프사이클 관리를 패키징하는 공급업체는 컴포넌트 중심 라이벌로부터 점유율을 빼앗고 있습니다.
공장은 가동 시간을 보호하기 위해 예지 보전, 로봇 조정 및 공급망 투명성에 의존하기 때문에 제조업은 2024년 지출의 29.5%를 차지했습니다. 지멘스는 레거시 머신을 네트워크화하는 브라운필드 리노베이션과 관련된 디지털 산업의 수주가 기록적이라고 보고했습니다. 환경, 건강 및 안전 대시보드는 규제 당국이 배기 가스 감사를 강화함에 따라 주목받게 됩니다. 그 결과 산업 플랜트를 위한 사물인터넷 시장 규모는 거시적인 역풍에도 불구하고 견조하게 확대될 것으로 예측됩니다.
대조적으로, 농업은 CAGR 19.2%로 가장 빠르게 성장할 전망입니다. 토양 프로브, 무인 항공기 이미지 및 위성 링크를 통해 농부는 비료와 관개를 거의 실시간으로 조정할 수 있어 헥타르당 투입 비용이 저하됩니다. 신흥기업은 센서, 분석, 신용서비스를 중규모 농가들이 이용하기 쉬운 구독 모델에 번들하고 있습니다. 가축의 목장주는 체온, 반추 횟수, 위치를 모니터하는 목걸이를 장착하여 질병의 발생이나 포식에 의한 손실을 줄이고 있습니다. 공적기관이 식량 안보를 추진하는 가운데, 보조금에 의해 커넥티드 팜의 도입이 가속되고, 사물인터넷 산업의 고객 기반이 얼리어댑터 이외에도 퍼지고 있습니다.
지역 분석
북미는 2024년 매출의 32.3%를 차지했으며, 성숙한 5G 전개, 개인 셀룰러 라이선스의 광범위한 보급, 디지털 네이티브의 견고한 노동력에 의해 지원되고 있습니다. 자동차에서 식품 가공에 이르는 산업 시설에서는 엣지 AI 컨트롤러로 고충실도 데이터를 스트리밍하는 주파수 공유 네트워크가 일상적으로 시험 운용되고 있습니다. 결과적으로 사물 인터넷 시장은 거시 환경이 변동하더라도 안정적인 자본 배분을 계속하고 있습니다.
아시아태평양은 각국 정부가 IoT를 제조 보조금이나 스마트 시티 설계도에 통합함으로써 2030년까지 연평균 복합 성장률(CAGR) 15.1%로 성장할 것으로 예측됩니다. 라이선싱된 휴대폰 연결 수는 2030년까지 인도, 중국, 동남아시아 전체에서 2억 7천만에 달할 전망입니다. 중국은 수출규제의 불확실성을 완화하기 위해 국내 칩 주조에 대한 투자를 가속화하고 인도는 센서 조립 공장을 유치하기 위해 생산에 연동된 인센티브를 활용합니다. 베트남과 인도네시아의 신흥 기업은 LPWAN 게이트웨이와 클라우드 대시보드를 통합하여 중견 공장을 저렴한 비용으로 온라인화합니다. 이러한 동향을 합치면 사물 인터넷 시장 규모는 인구동태적으로 다양한 지역 전체에 걸쳐 확대될 것입니다.
유럽에서는 환경 컴플라이언스에 중점을 두고 있으며, 센서에 의한 배출량 추적이 기업 보고에 필수적입니다. 프라이버시 규제가 현장에서의 처리를 장려하고 있기 때문에 엣지의 도입이 증가합니다. 관민 컨소시엄은 스마트 항만 물류와 국경을 넘어선 화물 투명화 시스템에 자금을 제공합니다. 중동 및 아프리카는 아직 보급의 초기 단계에 있지만, 위성을 이용한 가축의 모니터링과 태양광 발전을 이용한 물 관리로 비약적으로 보급됩니다. 국제개발기관은 단기간에 투자 회수가 가능한 파일럿 프로젝트에 자금을 제공하고, 지역에 뿌리를 둔 전문지식을 키워, 사물인터넷 시장의 저변을 넓히고 있습니다.
기타 혜택 :
- 엑셀 형식 시장 예측(ME) 시트
- 3개월간의 애널리스트 서포트
목차
제1장 서론
- 조사의 전제조건 및 시장 정의
- 조사 범위
제2장 조사 방법
제3장 주요 요약
제4장 시장 상황
- 시장 개요
- 시장 성장 촉진요인
- 커넥티드 디바이스 보급 및 센서 비용 저하
- 5G와 LPWAN의 전개로 커버 범위 확대
- 엣지 AI 애널리틱스가 실시간 가치 실현
- LEO 위성 IoT가 원격 감시 해방
- ESG와 관련된 공급망 보고 의무
- IoT 원격 측정에 의한 이용 기반 보험
- 시장 성장 억제요인
- 심각화하는 사이버 보안 및 프라이버시 침해
- 프로토콜의 단편화 및 낮은 상호 운용성
- 수출 규제가 칩 및 모듈 공급 압박
- 엣지 AI의 소비 전력이 디바이스 배터리에 부담 전가
- 밸류체인 분석
- 규제 상황
- 기술의 전망
- Porter's Five Forces 분석
- 공급기업의 협상력
- 구매자의 협상력
- 신규 참가업체의 위협
- 대체품의 위협
- 경쟁 기업 간 경쟁 관계
- 가격 분석
- 주요 이용 사례 및 사례 연구
- 거시 경제 및 팬데믹 영향 분석
제5장 시장 규모 및 성장 예측
- 컴포넌트별
- 하드웨어(센서, 프로세서, 연결 모듈, 게이트웨이)
- 소프트웨어 및 플랫폼(디바이스 관리, 데이터 관리, 분석, 보안)
- 접속 유형(셀룰러(2G-5G), LPWAN(NB-IoT, LoRaWAN, Sigfox), 위성, 근거리 통신(Wi-Fi, BLE, Zigbee))
- 서비스(프로페셔널, 매니지드, 인테그레이션)
- 최종 사용자 업계별
- 제조 및 산업
- 운송 및 물류
- 헬스케어 및 생명과학
- 소매 및 전자상거래
- 에너지 및 유틸리티
- 주택 및 스마트 빌딩
- 농업
- 정부 및 스마트 시티
- 용도별
- 자산 추적 및 플릿 관리
- 예지보전
- 스마트 미터
- 원격 환자 모니터링
- 스마트 홈 및 어플라이언스
- 커넥티드카 및 V2X
- 환경 및 기후 모니터링
- 전개 모델별
- 클라우드
- 온프레미스
- 엣지 및 하이브리드
- 지역별
- 북미
- 미국
- 캐나다
- 멕시코
- 남미
- 브라질
- 아르헨티나
- 유럽
- 독일
- 영국
- 프랑스
- 스페인
- 이탈리아
- 러시아
- 아시아태평양
- 중국
- 인도
- 일본
- 한국
- ASEAN
- 기타 아시아태평양
- 중동 및 아프리카
- 중동
- 사우디아라비아
- 아랍에미리트(UAE)
- 튀르키예
- 아프리카
- 남아프리카
- 나이지리아
- 이집트
- 북미
제6장 경쟁 구도
- 시장 집중도
- 전략적인 동향과 파트너십
- 시장 점유율 분석
- 기업 프로파일
- Amazon Web Services
- Microsoft Corporation
- Google LLC
- Cisco Systems
- Huawei Technologies
- Siemens AG
- IBM Corporation
- PTC Inc.
- Robert Bosch GmbH
- Honeywell International
- Oracle Corporation
- SAP SE
- AT&T
- Aeris Communications
- Fujitsu
- Wipro
- Intel Corporation
- Ericsson
- Qualcomm
- Advantech
- Sierra Wireless(Semtech)
- Quectel Wireless
- Telit Cinterion
- u-blox
제7장 시장 기회 및 향후 전망
AJY 25.11.21The internet of things market stands at USD 1,350 billion in 2025 and is forecast to reach USD 2,720 billion by 2030, advancing at a 15.04% CAGR.
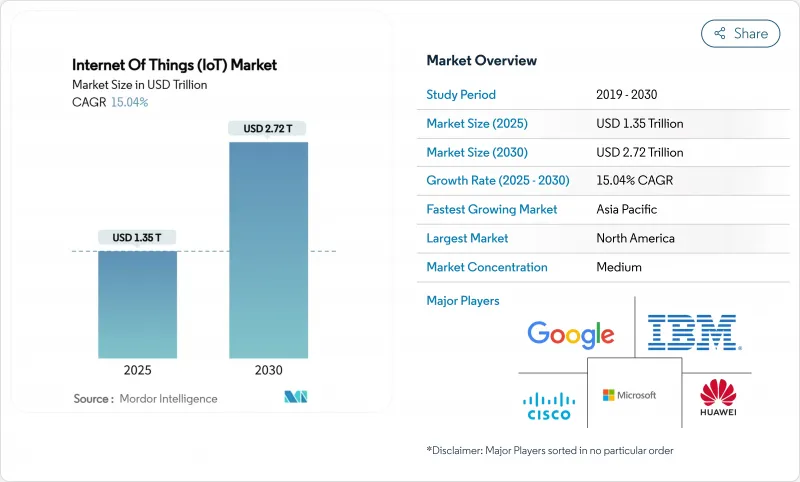
Strong demand for real-time analytics, predictive maintenance, and autonomous decision systems is accelerating deployments across factories, farms, and logistics hubs. Rapid 5G roll-outs, growth of low-power wide-area networks, and falling sensor costs expand the addressable base of connected assets. Enterprises also value edge AI because it protects data sovereignty while guaranteeing millisecond response times. As a result, investment continues to shift from pilot projects to full-scale production across every major vertical. The Internet of Things market, therefore, continues to compound on a solid technology foundation supported by resilient capital spending and regulatory incentives aimed at efficiency and sustainability.
Global Internet Of Things (IoT) Market Trends and Insights
Connected-device proliferation and falling sensor costs
Unit prices for basic environmental sensors have declined from USD 20 to below USD 5, making dense instrumentation economically viable across factories and farms. Industrial-grade vibration sensors used in predictive maintenance now retail for USD 50-100 compared with USD 200-500 only five years ago. Lower hardware barriers attract new software integrators, broadening the Internet of Things market talent pool. BMW's private 5G production network already links thousands of sensors to edge controllers that optimize throughput in real time. Temporary semiconductor shortages create cost pressure, yet design innovations that reduce component counts preserve downward price momentum. As firms connect ever-smaller assets, data volumes rise sharply, cementing analytics services as the fastest-growing revenue pool.
5G and LPWAN roll-outs widen coverage
Private 5G now underpins ultra-low-latency industrial control, demonstrated by John Deere's Waterloo Works where flexible manufacturing lines rely on wire-free reconfiguration. LoRaWAN and NB-IoT networks complement 5G by linking remote fields, mines, and pipelines where cellular economics still lag. Kineis and other nanosatellite operators bridge remaining gaps, enabling continuous visibility of livestock herds and maritime assets. Telecom operators coordinate spectrum and backhaul investments to match device density with viable returns. These converging access options keep the internet of things market on an inclusive path that spans both dense urban campuses and sparsely populated frontiers.
Escalating cybersecurity and privacy breaches
Connected assets expand the attack surface, with ransomware already halting factory lines and exposing proprietary recipes. The EU Cyber Resilience Act sets minimum encryption and patching obligations, forcing vendors to absorb higher compliance costs. Industrial buyers increasingly request secure-boot chipsets and zero-trust architectures, raising barriers for low-cost suppliers. Breach headlines could momentarily slow adoption, yet long-term security spending often translates into higher total contract values within the internet of things market.
Other drivers and restraints analyzed in the detailed report include:
- Edge-AI analytics enable real-time value
- LEO-satellite IoT unlocks remote monitoring
- Protocol fragmentation and poor interoperability
For complete list of drivers and restraints, kindly check the Table Of Contents.
Segment Analysis
Services contributed 34% of 2024 revenue, underscoring the complexity of turning devices and data into measurable outcomes. Consulting teams map workflows, build secure architectures, and optimize dashboards that convert sensor streams into operational value. Hardware prices keep falling, yet integration demands elevate specialist labor rates, cementing services as the largest slice of the internet of things market. Edge platforms that blend container orchestration with OTA patching expand at 17.51% CAGR as buyers insist latency and data governance stay onsite. Connectivity modules absorb cost deflation, widening profit margins for solution assemblers who resell capacity across thousands of endpoints.
The push toward flexible infrastructure drives hybrid topologies where gateway agents decide what stays local and what travels to the cloud. Such orchestration intensifies demand for API harmonization between hyperscale clouds and factory floor controllers. Software vendors embed auto-ML engines that fine-tune models continuously, reinforcing subscriptions that lock customers into ecosystems. Meanwhile, satellite operators partner with terrestrial carriers to bundle fallback connectivity, broadening geographic applicability of the internet of things market. Vendors that package hardware, integration, and lifecycle management under outcome-based contracts are capturing share from component-centric rivals.
Manufacturing held 29.5% of 2024 spending as factories rely on predictive maintenance, robot coordination, and supply-chain transparency to safeguard uptime. Siemens reports record digital industries orders tied to brown-field retrofits that network legacy machines.Automotive plants deploy thousands of torque and vibration sensors, feeding edge AI that quarantines anomalies before they trigger costly downtime. Environmental, health, and safety dashboards gain prominence as regulators tighten emission audits. Consequently, the Internet of Things market size for industrial plants is expected to expand steadily despite macro headwinds.
Agriculture, by contrast, grows fastest at a 19.2% CAGR. Soil probes, drone imagery, and satellite links allow farmers to adjust fertilizer and irrigation in near real time, lowering input costs per hectare. Start-ups bundle sensors, analytics, and credit services into subscription models affordable to mid-sized holdings. Livestock ranchers fit collars that monitor temperature, rumination, and location, trimming disease outbreaks and predation losses. As public agencies push food security, grant funding accelerates connected-farm adoption, broadening the Internet of Things industry customer base beyond early adopters.
The IoT Market Report is Segmented by Component (Hardware, Software, Services, and More), End-User Industry (Agriculture, Retail and E-Commerce, Energy and Utilities, and More), Application (Asset Tracking and Fleet Management, Predictive Maintenance, Smart Metering, and More), Deployment Model (Cloud, On-Premises, and More), and Geography
Geography Analysis
North America owned 32.3% of 2024 revenue, anchored by mature 5G roll-outs, wide adoption of private cellular licenses, and a robust digital-native workforce. Industrial facilities from automotive to food processing routinely pilot spectrum-sharing networks that stream high-fidelity data to edge AI controllers.Policy frameworks prioritize innovation yet codify minimum security standards, promoting trust without stifling experimentation. Consequently, the Internet of Things market continues to see steady capital allocations even when macro conditions fluctuate.
Asia-Pacific is projected to grow at 15.1% CAGR through 2030 as governments embed IoT into manufacturing subsidies and smart-city blueprints. Licensed cellular connections are set to reach 270 million by 2030 across India, China, and Southeast Asia. China accelerates domestic chip foundry investments to buffer export control uncertainties, while India leverages production-linked incentives to attract sensor assembly plants. Start-ups in Vietnam and Indonesia integrate LPWAN gateways with cloud dashboards, bringing mid-tier factories online at low cost. Together, these trends expand the Internet of Things market size across a demographically diverse region.
Europe emphasizes environmental compliance, making sensor-driven emissions tracking integral to corporate reporting. Edge deployments rise because privacy regulations encourage onsite processing. Public-private consortia finance smart port logistics and cross-border freight transparency systems. Middle East and Africa remain earlier in the adoption curve but leapfrog with satellite-enabled livestock monitoring and solar-powered water management. International development agencies fund pilot projects that demonstrate quick payback, nurturing localized expertise and widening the internet of things market footprint.
- Amazon Web Services
- Microsoft Corporation
- Google LLC
- Cisco Systems
- Huawei Technologies
- Siemens AG
- IBM Corporation
- PTC Inc.
- Robert Bosch GmbH
- Honeywell International
- Oracle Corporation
- SAP SE
- AT&T
- Aeris Communications
- Fujitsu
- Wipro
- Intel Corporation
- Ericsson
- Qualcomm
- Advantech
- Sierra Wireless (Semtech)
- Quectel Wireless
- Telit Cinterion
- u-blox
Additional Benefits:
- The market estimate (ME) sheet in Excel format
- 3 months of analyst support
TABLE OF CONTENTS
1 INTRODUCTION
- 1.1 Study Assumptions and Market Definition
- 1.2 Scope of the Study
2 RESEARCH METHODOLOGY
3 EXECUTIVE SUMMARY
4 MARKET LANDSCAPE
- 4.1 Market Overview
- 4.2 Market Drivers
- 4.2.1 Connected-device proliferation and falling sensor costs
- 4.2.2 5G and LPWAN roll-outs widen coverage
- 4.2.3 Edge-AI analytics enable real-time value
- 4.2.4 LEO-satellite IoT unlocks remote monitoring
- 4.2.5 ESG-linked supply-chain reporting mandates
- 4.2.6 Usage-based insurance powered by IoT telemetry
- 4.3 Market Restraints
- 4.3.1 Escalating cybersecurity and privacy breaches
- 4.3.2 Protocol fragmentation and poor interoperability
- 4.3.3 Export controls squeezing chip/module supply
- 4.3.4 Edge-AI power draw strains device batteries
- 4.4 Value Chain Analysis
- 4.5 Regulatory Landscape
- 4.6 Technological Outlook
- 4.7 Porter's Five Forces Analysis
- 4.7.1 Bargaining Power of Suppliers
- 4.7.2 Bargaining Power of Buyers
- 4.7.3 Threat of New Entrants
- 4.7.4 Threat of Substitutes
- 4.7.5 Intensity of Competitive Rivalry
- 4.8 Pricing Analysis
- 4.9 Key Use-Cases and Case Studies
- 4.10 Macroeconomic and Pandemic Impact Analysis
5 MARKET SIZE AND GROWTH FORECASTS (VALUE)
- 5.1 By Component
- 5.1.1 Hardware (Sensors, Processors, Connectivity Modules, Gateways)
- 5.1.2 Software / Platforms (Device Management, Data Management, Analytics, Security)
- 5.1.3 Connectivity Type (Cellular (2G-5G), LPWAN (NB-IoT, LoRaWAN, Sigfox), Satellite, Short-Range (Wi-Fi, BLE, Zigbee))
- 5.1.4 Services (Professional, Managed, Integration)
- 5.2 By End-user Industry
- 5.2.1 Manufacturing and Industrial
- 5.2.2 Transportation and Logistics
- 5.2.3 Healthcare and Life Sciences
- 5.2.4 Retail and E-commerce
- 5.2.5 Energy and Utilities
- 5.2.6 Residential and Smart Buildings
- 5.2.7 Agriculture
- 5.2.8 Government and Smart Cities
- 5.3 By Application
- 5.3.1 Asset Tracking and Fleet Management
- 5.3.2 Predictive Maintenance
- 5.3.3 Smart Metering
- 5.3.4 Remote Patient Monitoring
- 5.3.5 Smart Home and Appliances
- 5.3.6 Connected Vehicles and V2X
- 5.3.7 Environmental and Climate Monitoring
- 5.4 By Deployment Model
- 5.4.1 Cloud
- 5.4.2 On-premises
- 5.4.3 Edge / Hybrid
- 5.5 By Geography
- 5.5.1 North America
- 5.5.1.1 United States
- 5.5.1.2 Canada
- 5.5.1.3 Mexico
- 5.5.2 South America
- 5.5.2.1 Brazil
- 5.5.2.2 Argentina
- 5.5.3 Europe
- 5.5.3.1 Germany
- 5.5.3.2 United Kingdom
- 5.5.3.3 France
- 5.5.3.4 Spain
- 5.5.3.5 Italy
- 5.5.3.6 Russia
- 5.5.4 Asia Pacific
- 5.5.4.1 China
- 5.5.4.2 India
- 5.5.4.3 Japan
- 5.5.4.4 South Korea
- 5.5.4.5 ASEAN
- 5.5.4.6 Rest of Asia Pacific
- 5.5.5 Middle East and Africa
- 5.5.5.1 Middle East
- 5.5.5.1.1 Saudi Arabia
- 5.5.5.1.2 UAE
- 5.5.5.1.3 Turkey
- 5.5.5.2 Africa
- 5.5.5.2.1 South Africa
- 5.5.5.2.2 Nigeria
- 5.5.5.2.3 Egypt
- 5.5.1 North America
6 COMPETITIVE LANDSCAPE
- 6.1 Market Concentration
- 6.2 Strategic Moves and Partnerships
- 6.3 Market Share Analysis
- 6.4 Company Profiles (includes Global level Overview, Market level overview, Core Segments, Financials as available, Strategic Information, Market Rank/Share, Products and Services, Recent Developments)
- 6.4.1 Amazon Web Services
- 6.4.2 Microsoft Corporation
- 6.4.3 Google LLC
- 6.4.4 Cisco Systems
- 6.4.5 Huawei Technologies
- 6.4.6 Siemens AG
- 6.4.7 IBM Corporation
- 6.4.8 PTC Inc.
- 6.4.9 Robert Bosch GmbH
- 6.4.10 Honeywell International
- 6.4.11 Oracle Corporation
- 6.4.12 SAP SE
- 6.4.13 AT&T
- 6.4.14 Aeris Communications
- 6.4.15 Fujitsu
- 6.4.16 Wipro
- 6.4.17 Intel Corporation
- 6.4.18 Ericsson
- 6.4.19 Qualcomm
- 6.4.20 Advantech
- 6.4.21 Sierra Wireless (Semtech)
- 6.4.22 Quectel Wireless
- 6.4.23 Telit Cinterion
- 6.4.24 u-blox
7 MARKET OPPORTUNITIES AND FUTURE OUTLOOK
- 7.1 White-space and Unmet-need Assessment
