


|
시장보고서
상품코드
1851352
태양광 발전 시장 : 점유율 분석, 산업 동향, 통계, 성장 예측(2025-2030년)Solar Photovoltaic (PV) - Market Share Analysis, Industry Trends & Statistics, Growth Forecasts (2025 - 2030) |
||||||
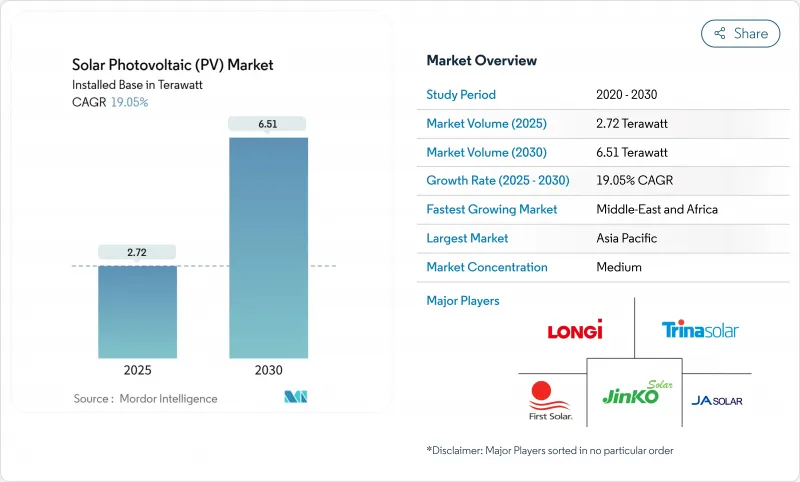
세계의 태양광 발전 시장에서 설치 기반 규모는 2025년 2.72테라와트에서 2030년 6.51테라와트까지 확대되고 예측기간 중(2025-2030년) CAGR은 19.05%를 보일 것으로 예측됩니다.
모듈의 비용 절감, 과거 최고의 셀 효율 및 지원 정책을 통해 이 기술은 다양한 지역에서 기존 발전을 밑돌게 했습니다. 제조능력은 1.8TW로 상승하여 수요가 가속화되는 가운데 견조한 공급을 지지하고 있습니다. 탠덤형과 페로브스카이트형의 기술 혁신이 현상을 타파하려고 하고 있지만, 단결정 셀은 여전히 벤치마크로 남아있습니다. 미국의 인플레이션 억제법, EU의 넷 제로 산업법 및 유사한 이니셔티브에 힘입어 전략적 공급망 재조달은 단일 지역 생산에 대한 의존성을 완화하면서 새로운 지역 성장 벡터를 도입합니다. 그리드 통합 장애물, 폴리실리콘 가격 변동, 무역 체제의 변화가 눈에 띄는 리스크가 되지만, 기업의 24/7 클린 전력 계약 증가와 그린 수소에 대한 의욕이 장기적인 수요를 지원합니다. 부문별로는 오늘날 태양광 발전 시장은 유틸리티 스케일이 주류이지만, 토지의 제약과 에너지 자급 지향이 강해짐에 따라 주택용과 부체식 시스템의 점유율이 확대되고 있습니다.
세계 태양광 발전 시장 동향과 통찰
모듈 ASP 하락으로 그리드 패리티 영역 확대
모듈 가격은 2024년에 전년 대비 51.8% 하락했으며, 중국의 일부 업체들은 손익 분기점을 밑돌고 추가 하락 궤도를 안정시키는 공급 삭감을 촉구했습니다. 그리드 패리티는 현재 세계 전력 시장의 70%에서 달성되고 있으며, 일찍이 경제적이지 않은 것으로 간주되었던 지역에서 태양광 발전 시장의 보급을 가능하게 하고 있습니다. 사우디아라비아는 10.4 USD/MWh의 평준화 전력 비용을 기록하고 강한 일사량 하에서의 비용 리더십을 보여줍니다. 사하라 이남의 아프리카에서는 비용 절감이 미니 그리드 수요 증가에 수렴하기 때문에 큰 이익을 기대할 수 있습니다. 무역행동이나 지역별 내용규제로 지역적 가격 스프레드가 발생할 가능성은 있지만, 2026년까지 세계의 중앙가격은 효율 상승에 따라 하락하는 경향이 있습니다.
미국의 IRA 주도 PV 제조 온쇼어링
1,000억 달러 이상의 커미트먼트가 발표되어 미국의 셀 모듈 생산량이 4배로 확대되고 세계 공급망도 재편됩니다. Hanwha Qcells는 잉곳에서 모듈까지 일관된 컴플렉스를 건설 중이며 First Solar는 앨라배마 주에 박막 라인을 신설하여 국내 생산 능력을 11GW로 끌어올립니다. 국내 생산 보너스는 프로젝트 비용을 10-20% 절감하고 역사적인 아시아 비용 우위를 무효화합니다. 이 이니셔티브는 지정학적 위험을 줄이지만 지속적인 정책의 지속과 점진적인 규모 중심의 학습 곡선에 달려 있습니다.
고도입 지역에서의 송전망의 혼잡과 억제
캘리포니아에서는 2024년에 340만 MWh의 송전 정지가 발생했으며, 이는 29%의 급증이고 발전량 증가와 송전 확장의 미스매치를 부각하고 있습니다. 텍사스 주에서는 대규모 송전망 업그레이드가 없으면 2035년까지 태양광 발전 억제율이 19%까지 상승할 수 있습니다. 유럽의 재파견량은 2040년까지 6배로 증가할 수 있으며, 사업자와 소비자 모두 부담이 됩니다. 서부 에너지 불균형 시장과 같은 지역 협력의 틀은 억제 감소의 가능성을 보여주지만, 새로운 송전선의 일반적인 리드 타임은 7년에서 10년이며, 투자자에게 이 제약은 항상 머리의 한쪽 구석에 놓여 있습니다.
부문 분석
단결정 Si 모듈은 2024년 발전 용량의 87%를 공급하여 시스템 수준의 학습 커브 향상으로 비용 리더십을 강화했습니다. 이 기술은 2030년까지 연평균 복합 성장률(CAGR) 19.05%를 보일 것으로 예측되는 기술 부문의 태양광 발전 시장 규모의 중심에 위치하고 있습니다. TOPCon 태양전지는 대규모 자본 증강 없이 효율을 높일 수 있어 신규 생산 라인의 70%를 차지했습니다. CdTe 및 CIGS와 같은 박막 솔루션은 공간에 제약이 있는 용도와 고온 용도로 틈새를 유지합니다. 탠덤형과 페롭스카이트형 아키텍처는 LONGi의 30.1% 실험실 스케일 효율과 Qcells의 28.6%의 모듈 마일스톤을 통해 파일럿 라인을 가속화하고 이론 수율의 상한을 밀어 올리는 벤처 자금을 모으고 있습니다. 헤테로 접합은 높은 개방 회로 전압을 제공하지만 금속화 비용의 장애물에 직면하는 반면 백 접점 셀은 건물 일체형 태양광 발전의 미관을 목표로하고 있습니다. 따라서 기술 경쟁은 효율성 향상, 재료 가용성 및 생산 확장성을 축적하고 있으며, 이러한 요인은 태양광 발전 시장 전체의 조달 결정에 달려 있습니다.
지속적인 연구개발은 성능 향상이 시스템 비용 절감으로 이어질 수 있게 하고, 당분간은 단결정의 우위성을 강화합니다. 그러나 효율이 1% 상승할 때마다 유효 면적은 약 2% 삭감되어 도시와 농지에서의 태양광 발전 환경에서는 매우 중요한 절약이 됩니다. 탠덤형 태양전지에 대한 투자의 기세는 파괴적인 가능성을 보여주며, 최초의 상업 출하는 2027년 이전이 될 것 같습니다. 최종 보급 속도는 내구성 증명과 자본 투자 강도에 달려 있습니다. 그때까지는 은 비율이 높은 메탈라이제이션 페이스트나 바이페이셜의 강화 등 점진적인 업그레이드가 현행의 경쟁력을 유지합니다.
태양광 발전(PV) 시장 보고서는 기술별(단결정 실리콘, 다결정 실리콘, 박막, 탠덤/페로브스카이트), 최종 사용자별(주택, 상업 및 산업, 유틸리티 스케일 IPP), 도입 유형별(지상 설치형, 옥상/건물 일체형, 부체식 PV), 지역별(북미, 아시아태평양, 유럽, 남미, 중동 및 아프리카)로 구분됩니다.
지역별 분석
아시아태평양은 2024년 세계 설치량의 64%를 차지했으며, 중국의 통합된 공급망과 지속적인 정책 지원이 그 원동력이 되고 있습니다. 중국 국내 증설 외에도 동남아시아 조립 허브로의 수출이 세계 모듈 공급을 윤택하게 유지했습니다. 미국과 EU의 무역 장벽을 피하기 위해 인도의 생산 연동형 인센티브 프로그램이 기가와트 규모의 팹을 유치하고 있습니다. 일본에서는 관개용 연못 위에 부유식 PV 어레이를 설치하는 시도가 이루어지고, 호주에서는 옥상으로의 도입이 진행되어 분산형 발전 용량이 증가하고 있습니다. 이러한 움직임은 아시아태평양이 태양광 발전 시장의 역사적이고 지속적인 핵심 역할을 한다는 것을 뒷받침합니다.
중동 및 아프리카는 비전 2030의 틀과 그린 수소 전략에 힘입어 2030년까지 연평균 복합 성장률(CAGR) 22%로 성장합니다. 사우디아라비아의 5,800만 kW 목표, UAE의 1,400만 kW 야망, 오만의 그린 암모니아 프로젝트는 파일럿 프로그램에서 기가와트 규모의 건설로의 전환을 이야기하고 있습니다. 아프리카에서는 2023년 누적 용량이 16GW를 초과했습니다. 2030년 투자 파이프라인은 양허적 자금을 기준으로 100GW를 초과합니다. 현지 모듈 조립 라인과 광산 회사 간의 양자간 전력 구매 계약은 환율 위험 노출을 줄이고 은행성을 강화합니다.
북미는 IRA의 인센티브를 활용하여 국내 생산을 회복시켜 다운스트림 투자를 유치하고 있습니다. 하이퍼스케일러 데이터센터의 성장으로 인해 베이스 로드의 재생에너지 요구 사항이 증가하고 있습니다. 유럽에서는 에너지 안보와 중국 의존으로부터의 탈피를 중시하는 움직임이 강해져, 협조 입찰에 의해 옥상 발전소의 도입, 축전과 태양광 발전을 조합한 하이브리드 발전소의 도입이 가속하고 있습니다. 칠레의 아타카마 사막에서는 발전 용량률이 30%를 넘어 기록적인 저등급이 가능하게 되었습니다. 각 지역에서 정책 입안, 자원 공급 및 자금 조달 생태계가 태양광 발전 시장의 보급 궤도를 형성하고 있습니다.
기타 혜택:
- 엑셀 형식 시장 예측(ME) 시트
- 3개월간의 애널리스트 서포트
목차
제1장 서론
- 조사의 전제조건과 시장의 정의
- 조사 범위
제2장 조사 방법
제3장 주요 요약
제4장 시장 상황
- 시장 개요
- 시장 성장 촉진요인
- 모듈 ASP의 하락으로 그리드 패리티 존이 확대
- 미국에서 PV 제조 온쇼어화가 진행
- AI를 활용한 태양광 발전 예측으로 밸런싱 비용을 삭감
- 그린 수소 전해조 프로젝트에서의 수요
- 기업의 24시간 365일 클린 전력 PPA 헌신
- 애그리볼리택스가 이중 토지 이용에 의한 수익을 해방
- 시장 성장 억제요인
- 고보급 지역에서의 송전망 혼잡과 억제 리스크
- 폴리실리콘 가격의 급격한 변동이 생산자의 마진을 압박
- 반덤핑 무역조치에 의한 공급체인의 분단
- 옥상 방화 규제의 고조가 BOS(밸런스 오브 시스템) 비용을 상승
- 공급망 분석
- 규제 상황
- 기술의 전망
- Porter's Five Forces
- 공급기업의 협상력
- 소비자의 협상력
- 신규 참가업체의 위협
- 대체품의 위협
- 경쟁 기업간 경쟁 관계
- 설치 용량과 출하 동향
- 가격과 LCOE 동향
- 주요 프로젝트 및 파이프라인
제5장 시장 규모와 성장 예측
- 기술별
- 단결정 실리콘
- 다결정 실리콘
- 박막(CdTe, CIGS, a-Si)
- 탠덤 및 페로브스카이트
- 최종 사용자별
- 주택용
- 상업 및 산업용
- 유틸리티 스케일 IPP
- 전개 유형별
- 지상 설치형
- 옥상 및 빌딩 일체형(BIPV)
- 부유식 PV
- 지역별
- 북미
- 미국
- 캐나다
- 멕시코
- 유럽
- 독일
- 영국
- 프랑스
- 이탈리아
- 러시아
- 기타 유럽
- 아시아태평양
- 중국
- 인도
- 일본
- 한국
- ASEAN 국가
- 호주
- 기타 아시아태평양
- 남미
- 브라질
- 아르헨티나
- 기타 남미
- 중동 및 아프리카
- 사우디아라비아
- 아랍에미리트(UAE)
- 남아프리카
- 나이지리아
- 기타 중동 및 아프리카
- 북미
제6장 경쟁 구도
- 시장 집중도
- 전략적 움직임(M&A, 파트너십, PPA)
- 시장 점유율 분석(주요 기업의 시장 순위/점유율)
- 기업 프로파일
- LONGi Green Energy Technology Co. Ltd.
- Trina Solar Co. Ltd.
- JinkoSolar Holding Co. Ltd.
- JA Solar Technology Co. Ltd.
- First Solar Inc.
- Canadian Solar Inc.
- Hanwha Q Cells Co. Ltd.
- SunPower Corporation
- Risen Energy Co. Ltd.
- Sharp Corporation
- Suntech Power Co. Ltd.
- REC Solar Holdings AS
- GCL System Integration Technology
- Maxeon Solar Technologies
- Yingli Solar
- Adani Solar
- Axitec Energy GmbH
- FuturaSun Srl
- Waaree Energies Ltd.
- Meyer Burger Technology AG
제7장 시장 기회와 장래의 전망
JHS 25.11.13The Solar Photovoltaic Market size in terms of installed base is expected to grow from 2.72 Terawatt in 2025 to 6.51 Terawatt by 2030, at a CAGR of 19.05% during the forecast period (2025-2030).

Module cost declines, record-high cell efficiencies, and supportive policies have enabled the technology to undercut conventional generation across diverse geographies. Manufacturing capacity has climbed to 1.8 TW, underpinning robust supply even as demand accelerates. Monocrystalline cells remain the benchmark, though tandem and perovskite innovations are poised to disrupt the status quo. Strategic supply-chain reshoring-driven by the US Inflation Reduction Act, the EU Net-Zero Industry Act, and similar initiatives-introduces new regional growth vectors while tempering dependence on single-region production. Grid-integration hurdles, price volatility in polysilicon, and shifting trade regimes pose near-term risks, yet rising corporate 24/7 clean-power contracts and green-hydrogen ambitions anchor long-term demand. Across segments, utility-scale assets dominate today's solar photovoltaic market, but residential and floating systems capture an expanding share as land constraints and energy-autonomy preferences intensify.
Global Solar Photovoltaic (PV) Market Trends and Insights
Falling Module ASPs Widen Grid-Parity Zones
Module prices fell 51.8% year-over-year in 2024, pushing several Chinese producers below break-even and prompting supply reductions that stabilize the trajectory of further declines. Grid parity is now achieved in 70% of global electricity markets, unlocking solar photovoltaic market penetration in regions once considered uneconomic. Saudi Arabia recorded a levelized cost of electricity of USD 10.4/MWh, illustrating cost leadership under strong irradiance. Sub-Saharan Africa stands to gain as cost reductions converge with rising mini-grid demand. Trade actions and localized content rules may introduce regional price spreads, yet global median prices trend lower through 2026 as efficiencies climb.
IRA-Driven On-Shoring of PV Manufacturing in the US
Announced commitments exceeding USD 100 billion will quadruple US cell and module output and realign global supply networks. Hanwha Qcells is building an integrated ingot-to-module complex, and First Solar's new thin-film line in Alabama boosts domestic capacity to 11 GW. Domestic content bonuses shave 10-20% from project costs, neutralizing historic Asian cost advantages. The initiative mitigates geopolitical risk but hinges on sustained policy continuity and incremental scale-driven learning curves.
Grid Congestion and Curtailment in High-Penetration Regions
California curtailed 3.4 million MWh in 2024, a 29% jump that spotlights the mismatch between generation growth and transmission expansion. Texas could see solar curtailment rates rise to 19% by 2035 without major grid upgrades. Europe's redispatch volumes may increase sixfold by 2040, costing operators and consumers alike. Regional coordination frameworks-such as the Western Energy Imbalance Market-demonstrate curtailment-reduction potential, yet typical lead times of seven to ten years for new lines keep the constraint front-of-mind for investors.
Other drivers and restraints analyzed in the detailed report include:
- AI-Enabled Solar Forecasting Cuts Balancing Costs
- Demand from Green-Hydrogen Electrolyzer Projects
- Rapid Polysilicon Price Swings Squeeze Producer Margins
For complete list of drivers and restraints, kindly check the Table Of Contents.
Segment Analysis
Monocrystalline-Si modules supplied 87% of 2024 capacity and delivered system-level learning-curve gains that reinforce their cost leadership. This technology sits at the heart of the solar photovoltaic market size for the technology segment, which is projected to grow at a 19.05% CAGR to 2030. TOPCon cells captured 70% of new production lines because they raise efficiency without large capital retooling. Thin-film solutions like CdTe and CIGS retain niches in space-constrained or high-temperature applications. Tandem and perovskite architectures, with LONGi's 30.1% lab-scale efficiency and Qcells' 28.6% module milestone, attract venture funding that accelerates pilot lines and pushes theoretical yield ceilings higher. Heterojunction offers high open-circuit voltages but encounters metallization cost hurdles, while back-contact cells target aesthetics for building-integrated photovoltaics. Technology competition thus pivots on efficiency advancements, material availability, and production scalability-factors that collectively steer procurement decisions across the solar photovoltaic market.
Continued R&D ensures performance gains translate to lower balance-of-system costs, reinforcing monocrystalline leadership in the near term. Yet every 1 percentage-point efficiency jump trims active area by roughly 2%, a saving critical in urban or agrivoltaic settings. Investment momentum behind tandem cells indicates disruption potential, and first commercial shipments are plausible before 2027. The eventual diffusion pace will hinge on durability proofs and capex intensity. Until then, incremental upgrades-such as metallization pastes with higher silver fraction efficiency or bifacial enhancements-keep current lines competitive.
The Solar Photovoltaic (PV) Market Report is Segmented by Technology (Monocrystalline-Si, Multicrystalline-Si, Thin-Film, and Tandem/Perovskite), End-User (Residential, Commercial and Industrial, and Utility-Scale IPPs), Deployment Type (Ground-Mounted, Rooftop/Building-Integrated, and Floating PV), and Geography (North America, Asia-Pacific, Europe, South America, and Middle East and Africa).
Geography Analysis
Asia-Pacific contributed 64% of global installations in 2024, driven by China's integrated supply chain and sustained policy support. Domestic Chinese additions, plus exports into Southeast Asian assembly hubs, kept the global module supply abundant. India's production-linked incentive program draws gigawatt-scale fabs as firms hedge against US and EU trade barriers. Japan pilots floating PV arrays atop irrigation ponds, while Australia intensifies rooftop adoption, boosting distributed capacity. These developments anchor Asia-Pacific's role as the historical and ongoing nucleus of the solar photovoltaic market.
The Middle East and Africa region is growing at a 22% CAGR through 2030, propelled by Vision 2030 frameworks and green-hydrogen strategies. Saudi Arabia's 58 GW target, the UAE's 14 GW ambition, and Omani green-ammonia projects illustrate the shift from pilot programs to gigawatt build-outs. Africa exceeded 16 GW cumulative capacity in 2023; investment pipelines exceed 100 GW for 2030, contingent on concessional finance. Local module-assembly lines and bilateral power-purchase contracts with mining firms mitigate currency-risk exposure and strengthen bankability.
North America leverages IRA incentives to restore domestic production and attract downstream investment. Corporate procurement remains the region's prime demand driver, with hyperscaler data-center growth elevating baseload renewable requirements. Europe intensifies focus on energy security and de-risking Chinese dependency; coordinated tenders accelerate rooftop adoption and hybrid plants that blend storage with PV. South America capitalizes on stellar irradiation; Chile's Atacama Desert records capacity factors above 30%, enabling record-low tariffs. Across regions, policymaking, resource endowments, and financing ecosystems collectively sculpt uptake trajectories in the solar photovoltaic market.
- LONGi Green Energy Technology Co. Ltd.
- Trina Solar Co. Ltd.
- JinkoSolar Holding Co. Ltd.
- JA Solar Technology Co. Ltd.
- First Solar Inc.
- Canadian Solar Inc.
- Hanwha Q Cells Co. Ltd.
- SunPower Corporation
- Risen Energy Co. Ltd.
- Sharp Corporation
- Suntech Power Co. Ltd.
- REC Solar Holdings AS
- GCL System Integration Technology
- Maxeon Solar Technologies
- Yingli Solar
- Adani Solar
- Axitec Energy GmbH
- FuturaSun Srl
- Waaree Energies Ltd.
- Meyer Burger Technology AG
Additional Benefits:
- The market estimate (ME) sheet in Excel format
- 3 months of analyst support
TABLE OF CONTENTS
1 Introduction
- 1.1 Study Assumptions & Market Definition
- 1.2 Scope of the Study
2 Research Methodology
3 Executive Summary
4 Market Landscape
- 4.1 Market Overview
- 4.2 Market Drivers
- 4.2.1 Falling module ASPs widen grid-parity zones
- 4.2.2 IRA-driven on-shoring of PV manufacturing in the U.S.
- 4.2.3 AI-enabled solar forecasting cuts balancing costs
- 4.2.4 Demand from green-hydrogen electrolyzer projects
- 4.2.5 Corporate 24/7 clean-power PPA commitments
- 4.2.6 Agrivoltaics unlocks dual-land use revenues
- 4.3 Market Restraints
- 4.3.1 Grid-congestion & curtailment risks in high-penetration regions
- 4.3.2 Rapid polysilicon price swings squeeze producer margins
- 4.3.3 Anti-dumping trade actions fragment supply chains
- 4.3.4 Rising rooftop-fire regulations add balance-of-system (BOS) cost
- 4.4 Supply-Chain Analysis
- 4.5 Regulatory Landscape
- 4.6 Technological Outlook
- 4.7 Porter's Five Forces
- 4.7.1 Bargaining Power of Suppliers
- 4.7.2 Bargaining Power of Consumers
- 4.7.3 Threat of New Entrants
- 4.7.4 Threat of Substitutes
- 4.7.5 Intensity of Competitive Rivalry
- 4.8 Installed-Capacity and Shipment Trends
- 4.9 Pricing and LCOE Trends
- 4.10 Key Projects Pipeline
5 Market Size & Growth Forecasts
- 5.1 By Technology
- 5.1.1 Monocrystalline-Si
- 5.1.2 Multicrystalline-Si
- 5.1.3 Thin-film (CdTe, CIGS, a-Si)
- 5.1.4 Tandem/Perovskite
- 5.2 By End-User
- 5.2.1 Residential
- 5.2.2 Commercial and Industrial
- 5.2.3 Utility-scale IPPs
- 5.3 By Deployment Type
- 5.3.1 Ground-mounted
- 5.3.2 Rooftop/Building-Integrated (BIPV)
- 5.3.3 Floating PV
- 5.4 By Geography
- 5.4.1 North America
- 5.4.1.1 United States
- 5.4.1.2 Canada
- 5.4.1.3 Mexico
- 5.4.2 Europe
- 5.4.2.1 Germany
- 5.4.2.2 United Kingdom
- 5.4.2.3 France
- 5.4.2.4 Italy
- 5.4.2.5 Russia
- 5.4.2.6 Rest of Europe
- 5.4.3 Asia-Pacifc
- 5.4.3.1 China
- 5.4.3.2 India
- 5.4.3.3 Japan
- 5.4.3.4 South Korea
- 5.4.3.5 ASEAN Countries
- 5.4.3.6 Australia
- 5.4.3.7 Rest of Asia-Pacifc
- 5.4.4 South America
- 5.4.4.1 Brazil
- 5.4.4.2 Argentina
- 5.4.4.3 Rest of South America
- 5.4.5 Middle East and Africa
- 5.4.5.1 Saudi Arabia
- 5.4.5.2 United Arab Emirates
- 5.4.5.3 South Africa
- 5.4.5.4 Nigeria
- 5.4.5.5 Rest of Middle East and Africa
- 5.4.1 North America
6 Competitive Landscape
- 6.1 Market Concentration
- 6.2 Strategic Moves (M&A, Partnerships, PPAs)
- 6.3 Market Share Analysis (Market Rank/Share for key companies)
- 6.4 Company Profiles (includes Global level Overview, Market level overview, Core Segments, Financials as available, Strategic Information, Products & Services, and Recent Developments)
- 6.4.1 LONGi Green Energy Technology Co. Ltd.
- 6.4.2 Trina Solar Co. Ltd.
- 6.4.3 JinkoSolar Holding Co. Ltd.
- 6.4.4 JA Solar Technology Co. Ltd.
- 6.4.5 First Solar Inc.
- 6.4.6 Canadian Solar Inc.
- 6.4.7 Hanwha Q Cells Co. Ltd.
- 6.4.8 SunPower Corporation
- 6.4.9 Risen Energy Co. Ltd.
- 6.4.10 Sharp Corporation
- 6.4.11 Suntech Power Co. Ltd.
- 6.4.12 REC Solar Holdings AS
- 6.4.13 GCL System Integration Technology
- 6.4.14 Maxeon Solar Technologies
- 6.4.15 Yingli Solar
- 6.4.16 Adani Solar
- 6.4.17 Axitec Energy GmbH
- 6.4.18 FuturaSun Srl
- 6.4.19 Waaree Energies Ltd.
- 6.4.20 Meyer Burger Technology AG
7 Market Opportunities & Future Outlook
- 7.1 White-space & Unmet-need Assessment
