|
시장보고서
상품코드
1851353
디지털 사이니지 시장 : 시장 점유율 분석, 산업 동향, 통계, 성장 예측(2025-2030년)Digital Signage - Market Share Analysis, Industry Trends & Statistics, Growth Forecasts (2025 - 2030) |
||||||
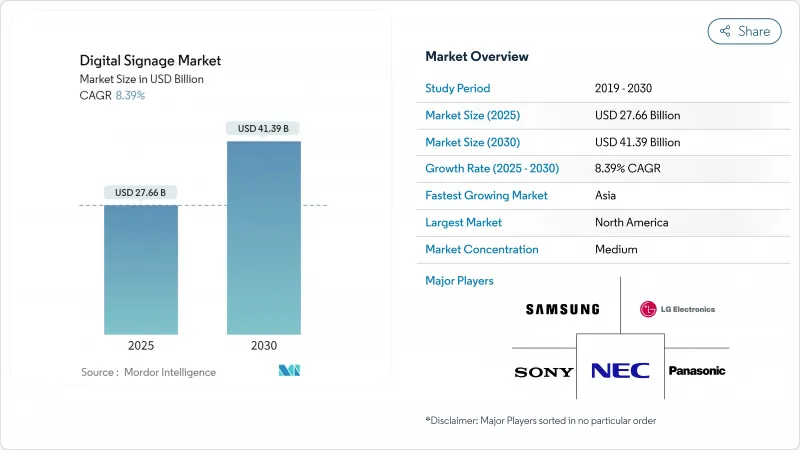
디지털 사이니지 시장 규모는 2025년에 276억 6,000만 달러로 추정되고, 2030년에는 413억 9,000만 달러에 이를 것으로 예측되며, CAGR 8.39%로 성장할 전망입니다.
AI 주도의 컨텐츠 엔진, 5G 대응 엣지 네트워크, 에너지 소비가 적은 MicroLED 스크린의 일관된 보급이 이 확대를 지원하고 있습니다. 대기업은 커넥티드 디스플레이를 사용하여 하이브리드 직장 전체의 커뮤니케이션을 통일하고, 시 당국은 인터랙티브 보드를 스마트 시티 인프라에 통합해 모빌리티 및 공공 안전 이니셔티브를 합리화하고 있습니다. 소매업체는 시청자 분석 플랫폼이 매장 내 화면을 수익을 창출하는 소매 미디어 자산으로 전환시켜 투자를 강화하고 있습니다. 동시에 교통 사업자는 실시간 여객 정보 시스템을 도입하여 서비스의 질을 높입니다.
세계의 디지털 사이니지 시장 동향 및 인사이트
AI를 활용한 시청자 분석이 역동적인 컨텐츠 개인화 뒷받침
소매업체는 현재 쇼핑객이 가까워지면 실시간으로 메시징을 조정하는 AI 엔진으로 획일적인 루프를 대체하고 있습니다. 컴퓨터 비전 모듈은 연령대, 성별 및 참여 길이를 측정하고 전환을 최대 30%까지 향상시키는 광고 소재의 변형을 유발합니다. 미국, 영국, 독일 및 프랑스의 체인은 옴니 채널 캠페인을 강화하기 위해 이러한 인사이트를 로열티 앱 데이터와 연결합니다. 대행사는 이러한 정확한 노출을 위해 프리미엄 CPM을 지불하고 상점 네트워크를 수익률이 높은 미디어 채널로 전환하고 있습니다. GDPR(EU 개인정보보호규정)에 대한 대응이 유럽에서의 전개 페이스를 형성하고 있지만, 벤더는 분석 전에 로컬로 비디오 프레임을 익명화하는 프라이버시 바이 디자인의 워크플로우를 포함하고 있습니다. 이러한 요인으로 인해 디지털 사이니지 시장은 중기적으로 견조한 성장 궤도를 유지하고 있습니다.
실시간 야외 스트리밍을 가능하게 하는 5G 엣지 컴퓨팅
도쿄, 서울, 싱가포르, 시드니 교통 당국은 mm파 5G 백본을 사용하여 초저지연 비디오와 긴급 경보를 옥외 LED 보드에 푸시하고 있습니다. 디바이스 상 엣지 서버가 사전에 고해상도 클립을 캐시하여 데이터 전송 비용을 줄이고 스트레스가 급증할 때 캠페인을 즉시 전환할 수 있습니다. 아시아의 교통 허브를 대상으로 한 조사는 5G가 레거시 파이버를 대체할 경우 생산성이 52%에서 245% 향상되고 비용이 최대 90% 절감되는 것으로 나타났습니다. 더 많은 메트로가 독립형 5G 코어를 실행하면 디지털 사이니지 시장이 즉시 활성화됩니다.
세분화된 CMS 표준은 멀티 벤더의 상호 운용성을 복잡하게 합니다.
세계 소매업체는 여러 브랜드의 화면을 구분하지만 스케줄링 및 분석을 위한 공통 프로토콜을 찾을 수 없습니다. 국제통신연합은 상호운용성 부족이 도입을 늦추고 총소유 비용을 높인다고 경고하고 있습니다. 따라서 많은 기업들이 단일 공급업체 생태계에 갇혀 경쟁 입찰을 제한하고 있습니다. 업계 얼라이언스는 API를 초안하고 있지만 공급업체 간에 로드맵이 다르기 때문에 진행은 느리게 진행되지 않습니다. 이 현실은 디지털 사이니지 시장의 단기적인 확장성을 억제합니다.
부문 분석
2024년 매출은 비디오 월이 28.1%의 점유율을 차지했습니다. 디지털 사이니지 시장은 브랜드 극장과 기업 타운홀 이벤트에서 계속 선호되고 있습니다. 또한 퀵 서비스 레스토랑의 디지털 포스터 수요도 안정적입니다.
그러나 키오스크 단말기는 셀프 프레지, 웨이 파인딩, 로열티 등록이 반응형 터치스크린에서 이용되게 되었으며, 2030년까지 CAGR은 가장 빠른 9.2%로 성장할 전망입니다. 디지털 사이니지 시장의 소매업체는 체크아웃 시 애드온을 권장하고 티켓 크기를 조정하는 AI 모듈을 도입하고 있습니다. 투명 액정 디스플레이는 고급 상점과 자동차 쇼룸에서 상품의 시인성 및 데이터 오버레이를 융합시키는 틈새 분야를 개척하고 있습니다. 제조업체는 현재 교통 콘코스를 위해 멀티 패널 비디오 월과 키오스크 단말기의 상호 작용을 융합시킨 하이브리드 장비를 시도하고 있습니다.
기계 설비 부속은 2024년 판매의 60.7%를 차지하였고, LED 타일, 미디어 플레이어, 임명 장비를 포함하는 디지털 사이니지 시장의 기반으로 지속됩니다. 픽셀 비용이 떨어지기 때문에 4-5년마다 업데이트 주기로 설비 투자를 관리하기 쉽게 되어 있습니다.
기업이 컨텐츠 오케스트레이션 및 애널리틱스가 ROI를 홍보한다는 사실을 발견했기 때문에 소프트웨어 수익은 2자리 CAGR 10.5%로 성장하고 있습니다. 클라우드 대시보드는 원격 진단을 통해 차량 가동 시간을 확보하고 AI 스케줄러는 캠페인의 관련성을 향상시킵니다. 공급업체는 광고주가 익스포저를 감사할 수 있도록 Proof of Play 대장을 통합하여 디지털 사이니지 시장의 신뢰성을 높이고 있습니다.
지역 분석
북미는 2024년 수입의 33.4%를 차지했으며, 미국 기업의 로비 개조에 의한 디지털 퍼스트 쇼케이스가 그 중심이었습니다. 캐나다 소매업체는 체크아웃 근대화를 가속화하고 지역 수요를 안정시킵니다. 이 지역의 디지털 사이니지 시장은 성숙한 클라우드 인프라가 전개 마찰을 줄이고 있습니다.
아시아태평양은 중국의 도시 클러스터 프로젝트, 일본의 기술 수출 촉진, 인도의 몰 붐, 동남 아시아의 관광업 회복에 힘입어 CAGR 8.5%의 궤도를 타고 있습니다. 패널과 IC의 통합 공급망은 단가를 낮추고 지역 구매자에게 가격 폭을 제공하여 디지털 사이니지 시장의 침투를 뒷받침합니다.
유럽은 에코 디자인의 의무화 및 높은 구매력에 힘입어 안정된 성장을 기록하고 있습니다. 역사 지구 간판의 상한 규제는 컴플라이언스에 번거롭지만 독일과 북유럽 기업은 에너지 클래스 A의 디스플레이를 채택하고 관광 구역의 휴식을 상쇄합니다. 동유럽 공항은 몰입형 안내 표시로 허브 공항의 지위를 겨루고 디지털 사이니지 시장을 동쪽으로 확대하고 있습니다.
기타 혜택 :
- 엑셀 형식 시장 예측(ME) 시트
- 3개월간의 애널리스트 서포트
목차
제1장 서론
- 조사의 전제조건 및 시장 정의
- 조사 범위
제2장 조사 방법
제3장 주요 요약
제4장 시장 상황
- 시장 개요
- 시장 성장 촉진요인
- AI를 활용한 시청자 분석이, 북미 및 유럽의 소매점 및 교통기관의 통로에서 다이나믹 컨텐츠의 퍼스널라이제이션 촉진
- 5G+엣지 컴퓨팅이 아시아와 오세아니아의 주요 교통 허브로 실시간 야외 스트리밍 실현
- EU 기업의 지속가능성 의무화로 에너지 효율이 높은 MicroLED와 전자페이퍼 사이니지 채용 가속
- 클라우드 기반의 기업 커뮤니케이션 대시보드를 추진하는 미국의 포스트 팬데믹 하이브리드 워크 모델
- 중동 전역에서 대형 디지털 사이니지를 통합한 스마트 시티 메가 프로젝트(NEOM, 두바이 2040)가 진행 중
- 라틴아메리카의 대형 체인에 의한 비디오 월 전개를 뒷받침하는 소매 미디어 수익화 전략
- 시장 성장 억제요인
- 세계 소매업체의 멀티 벤더 상호 운용성을 복잡화하는 단편적인 CMS 표준
- 유럽의 역사적 중심 시가지에서 옥외 LED 파사드가 높은 CAPEX 및 허가의 허들
- 미국 트랜짓 디스플레이의 랜섬웨어로 떠오른 사이버 보안 취약성
- 대형 패널용 특수 드라이버 IC 공급망 가격 상승
- 생태계 분석
- 기술의 전망
- Porter's Five Forces 분석
- 신규 참가업체의 위협
- 구매자의 협상력
- 공급기업의 협상력
- 대체품의 위협
- 경쟁 기업 간 경쟁 관계
제5장 시장 규모 및 성장 예측
- 유형별
- 비디오 월
- 비디오 스크린
- 키오스크
- 투명 LCD 스크린
- 디지털 포스터
- 빌보드
- 기타 유형
- 컴포넌트별
- 하드웨어
- LCD 및 LED 디스플레이
- OLED 디스플레이
- 마이크로 LED 디스플레이
- 미디어 플레이어
- 컨트롤러
- 프로젝터 및 프로젝션 스크린
- 기타 하드웨어
- 소프트웨어
- 서비스
- 설치 및 통합
- 관리 서비스
- 지원 및 유지 보수
- 하드웨어
- 전개별
- 온프레미스
- 클라우드 기반
- 하이브리드
- 스크린 사이즈별
- 32인치 이하
- 32인치-52인치
- 52인치 이상
- 초대형 100인치 이상
- 위치별
- 인스토어 및 인도어
- 아웃도어
- 최종 이용 산업별
- 소매
- 운송
- 접객
- 기업
- 교육
- 헬스케어
- 정부기관
- 스포츠 및 엔터테인먼트
- 은행 및 금융 서비스
- 제조 시설
- 지역별
- 북미
- 미국
- 캐나다
- 멕시코
- 유럽
- 독일
- 영국
- 프랑스
- 북유럽 국가
- 기타 유럽
- 남미
- 브라질
- 기타 남미
- 아시아태평양
- 중국
- 일본
- 인도
- 동남아시아
- 기타 아시아태평양
- 중동 및 아프리카
- 중동
- GCC
- 튀르키예
- 기타 중동
- 아프리카
- 남아프리카
- 기타 아프리카
- 북미
제6장 경쟁 구도
- 시장 집중도
- 전략적 동향
- 시장 점유율 분석
- 기업 프로파일
- NEC Display Solutions Ltd.
- LG Display Co. Ltd.
- Samsung Electronics Co. Ltd.
- Panasonic Corporation
- Sony Group Corporation
- Stratacache
- Planar Systems Inc.
- Hitachi Ltd.
- Barco NV
- Goodview
- Cisco Systems Inc.
- Scala Inc.
- Broadsign International LLC
- Appspace Inc.
- BrightSign LLC
- Mvix Inc.
- Christie Digital Systems USA Inc.
- Daktronics Inc.
- Leyard Optoelectronic Co. Ltd.
- Unilumin Group Co. Ltd.
- JCDecaux SA
- E Ink Holdings Inc.
- Clear Channel Outdoor Holdings Inc.
- Sharp Corporation
제7장 시장 기회 및 향후 전망
AJY 25.11.21The digital signage market size stands at USD 27.66 billion in 2025 and is forecast to reach USD 41.39 billion by 2030, reflecting an 8.39% CAGR.
Consistent uptake of AI-driven content engines, 5G-enabled edge networks and energy-frugal MicroLED screens underpins this expansion. Large enterprises are using connected displays to unify communications across hybrid workplaces, while city authorities weave interactive boards into smart-city infrastructure to streamline mobility and public safety initiatives. Retailers intensify investment as audience-analytics platforms transform in-store screens into revenue-generating retail-media assets. At the same time, transportation operators deploy real-time passenger information systems that raise service quality.
Global Digital Signage Market Trends and Insights
AI-powered audience analytics boosting dynamic content personalisation
Retailers now replace one-size-fits-all loops with AI engines that adjust messaging in real time when shoppers approach. Computer-vision modules gauge age bracket, gender and engagement length, then trigger creative variants that can lift conversion by as much as 30%. Chains in the United States, United Kingdom, Germany and France link these insights with loyalty-app data to enrich omnichannel campaigns. Agencies pay premium CPMs for such precise exposure, turning store networks into high-margin media channels. Compliance with GDPR shapes rollout pace in Europe, yet vendors embed privacy-by-design workflows that anonymise video frames locally before analysis. These factors keep the digital signage market on a solid medium-term growth path.
5G + edge computing enabling real-time outdoor streaming
Transit authorities in Tokyo, Seoul, Singapore and Sydney use millimetre-wave 5G backbones to push ultra-low-latency video and emergency alerts to outdoor LED boards. On-device edge servers pre-cache high-resolution clips, cutting data transit cost and letting campaigns switch instantly when foot-traffic sensors spike. Studies for Asian transport hubs show productivity gains from 52% to 245% and cost savings up to 90% when 5G replaces legacy fibre. As more metros activate standalone 5G cores, the digital signage market receives an immediate uplift.
Fragmented CMS standards complicating multi-vendor interoperability
Global retailers often juggle screens from several brands yet find no common protocol for scheduling or analytics. The International Telecommunication Union warns that the lack of interoperability slows deployments and raises total ownership cost. Many firms therefore lock into single-vendor ecosystems, limiting competitive bids. Industry alliances are drafting APIs, but diverging roadmaps among vendors keep progress slow. This reality curbs near-term scalability for the digital signage market.
Other drivers and restraints analyzed in the detailed report include:
- EU corporate sustainability mandates accelerating energy-efficient displays
- Post-pandemic hybrid work models driving cloud dashboards
- Cyber-security vulnerabilities spotlighted by ransomware on transit displays
For complete list of drivers and restraints, kindly check the Table Of Contents.
Segment Analysis
Video walls dominated 2024 revenue with 28.1% share due to their immersive impact in control rooms and flagship retail settings. The digital signage market continues to favour their scale for brand theatre and corporate town-hall events. Demand also stays steady for digital posters in quick-serve restaurants because franchisees value simple content swaps.
Kiosks, however, offer the fastest 9.2% CAGR to 2030 as shoppers embrace self-checkout, wayfinding and loyalty enrollment on responsive touchscreens. Retailers in the digital signage market deploy AI modules that recommend add-ons at check-out, nudging ticket size. Transparent LCD enclosures carve a niche in luxury stores and automotive showrooms, merging product visibility with data overlays. Manufacturers now experiment with hybrid rigs that fuse multi-panel video walls and kiosk interaction for transit concourses.
Hardware parts generated 60.7% of 2024 turnover and remain foundational to the digital signage market, covering LED tiles, media players and mounting kits. Falling pixel costs keep capex manageable for refresh cycles every four-to-five years.
Software revenue is growing at a double-digit 10.5% CAGR as companies discover that content orchestration and analytics drive ROI. Cloud dashboards secure fleet uptime through remote diagnostics, while AI schedulers improve campaign relevance. Vendors integrate proof-of-play ledgers so advertisers can audit exposures, raising confidence in the digital signage market.
The Digital Signage Market Report is Segmented by Type (Video Wall, Video Screen, Kiosk, and More), Component (Hardware, Software, and Services), Deployment (On-Premise, Cloud-Based, and Hybrid), Screen Size (Below 32", 32"-52", and More), Location (In-store/Indoor, and Outdoor), End-Use Industry (Retail, Transportation, Hospitality, Corporate, and More), and Geography. The Market Forecasts are Provided in Terms of Value (USD).
Geography Analysis
North America held 33.4% 2024 income, anchored by United States corporate refurbishments that turned lobbies into digital-first showcases. Canadian retailers accelerate checkout modernisation, keeping regional demand steady. The digital signage market here benefits from mature cloud infrastructure that reduces deployment friction.
Asia-Pacific is on an 8.5% CAGR trajectory, propelled by China's city cluster projects, Japan's technology export push, India's mall boom and Southeast Asia's tourism recovery. An integrated supply chain for panels and ICs lowers unit costs, giving regional buyers price latitude that boosts the digital signage market's penetration.
Europe records stable gains supported by ecodesign mandates and high purchasing power. Historic-district signage caps add compliance effort, yet German and Nordic corporates adopt energy-class A displays, offsetting tourist-zone pauses. Eastern European airports compete for hub status through immersive wayfinding walls, expanding the digital signage market eastward.
- NEC Display Solutions Ltd.
- LG Display Co. Ltd.
- Samsung Electronics Co. Ltd.
- Panasonic Corporation
- Sony Group Corporation
- Stratacache
- Planar Systems Inc.
- Hitachi Ltd.
- Barco NV
- Goodview
- Cisco Systems Inc.
- Scala Inc.
- Broadsign International LLC
- Appspace Inc.
- BrightSign LLC
- Mvix Inc.
- Christie Digital Systems USA Inc.
- Daktronics Inc.
- Leyard Optoelectronic Co. Ltd.
- Unilumin Group Co. Ltd.
- JCDecaux SA
- E Ink Holdings Inc.
- Clear Channel Outdoor Holdings Inc.
- Sharp Corporation
Additional Benefits:
- The market estimate (ME) sheet in Excel format
- 3 months of analyst support
TABLE OF CONTENTS
1 INTRODUCTION
- 1.1 Study Assumptions and Market Definition
- 1.2 Scope of the Study
2 RESEARCH METHODOLOGY
3 EXECUTIVE SUMMARY
4 MARKET LANDSCAPE
- 4.1 Market Overview
- 4.2 Market Drivers
- 4.2.1 AI-powered audience analytics boosting dynamic content personalisation in North American and European retail and transit corridors
- 4.2.2 5G + edge computing enabling real-time outdoor streaming across major Asian and Oceanian transport hubs
- 4.2.3 EU corporate sustainability mandates accelerating adoption of energy-efficient MicroLED and e-paper signage
- 4.2.4 Post-pandemic hybrid work models driving cloud-based corporate communication dashboards in the USA
- 4.2.5 Smart-city mega-projects (NEOM, Dubai 2040) integrating large-format digital billboards across the Middle East
- 4.2.6 Retail-media monetisation strategies fuelling video-wall roll-outs by Latin-American big-box chains
- 4.3 Market Restraints
- 4.3.1 Fragmented CMS standards complicating multi-vendor interoperability for global retailers
- 4.3.2 High CAPEX and permitting hurdles for outdoor LED facades in historical European city centres
- 4.3.3 Cyber-security vulnerabilities spotlighted by ransomware on United States transit displays
- 4.3.4 Supply-chain price spikes in specialty driver-ICs for large panels
- 4.4 Industry Ecosystem Analysis
- 4.5 Technological Outlook
- 4.6 Porter's Five Forces Analysis
- 4.6.1 Threat of New Entrants
- 4.6.2 Bargaining Power of Buyers
- 4.6.3 Bargaining Power of Suppliers
- 4.6.4 Threat of Substitutes
- 4.6.5 Intensity of Competitive Rivalry
5 MARKET SIZE AND GROWTH FORECASTS (VALUES)
- 5.1 By Type
- 5.1.1 Video Wall
- 5.1.2 Video Screen
- 5.1.3 Kiosk
- 5.1.4 Transparent LCD Screen
- 5.1.5 Digital Poster
- 5.1.6 Billboard
- 5.1.7 Other Types
- 5.2 By Component
- 5.2.1 Hardware
- 5.2.1.1 LCD/LED Display
- 5.2.1.2 OLED Display
- 5.2.1.3 MicroLED Display
- 5.2.1.4 Media Players
- 5.2.1.5 Controllers
- 5.2.1.6 Projector/Projection Screens
- 5.2.1.7 Other Hardware
- 5.2.2 Software
- 5.2.3 Services
- 5.2.3.1 Installation and Integration
- 5.2.3.2 Managed Services
- 5.2.3.3 Support and Maintenance
- 5.2.1 Hardware
- 5.3 By Deployment
- 5.3.1 On-premise
- 5.3.2 Cloud-based
- 5.3.3 Hybrid
- 5.4 By Screen Size
- 5.4.1 Below 32"
- 5.4.2 32"-52"
- 5.4.3 Above 52"
- 5.4.4 Ultra-large Above 100"
- 5.5 By Location
- 5.5.1 In-store/Indoor
- 5.5.2 Outdoor
- 5.6 By End-use Industry
- 5.6.1 Retail
- 5.6.2 Transportation
- 5.6.3 Hospitality
- 5.6.4 Corporate
- 5.6.5 Education
- 5.6.6 Healthcare
- 5.6.7 Government
- 5.6.8 Sports and Entertainment
- 5.6.9 Banking and Financial Services
- 5.6.10 Manufacturing Facilities
- 5.7 By Geography
- 5.7.1 North America
- 5.7.1.1 United States
- 5.7.1.2 Canada
- 5.7.1.3 Mexico
- 5.7.2 Europe
- 5.7.2.1 Germany
- 5.7.2.2 United Kingdom
- 5.7.2.3 France
- 5.7.2.4 Nordics
- 5.7.2.5 Rest of Europe
- 5.7.3 South America
- 5.7.3.1 Brazil
- 5.7.3.2 Rest of South America
- 5.7.4 Asia-Pacific
- 5.7.4.1 China
- 5.7.4.2 Japan
- 5.7.4.3 India
- 5.7.4.4 South-East Asia
- 5.7.4.5 Rest of Asia-Pacific
- 5.7.5 Middle East and Africa
- 5.7.5.1 Middle East
- 5.7.5.1.1 Gulf Cooperation Council Countries
- 5.7.5.1.2 Turkey
- 5.7.5.1.3 Rest of Middle East
- 5.7.5.2 Africa
- 5.7.5.2.1 South Africa
- 5.7.5.2.2 Rest of Africa
- 5.7.1 North America
6 COMPETITIVE LANDSCAPE
- 6.1 Market Concentration
- 6.2 Strategic Moves
- 6.3 Market Share Analysis
- 6.4 Company Profiles (includes Global level Overview, Market level overview, Core Segments, Financials as available, Strategic Information, Market Rank/Share for key companies, Products and Services, and Recent Developments)
- 6.4.1 NEC Display Solutions Ltd.
- 6.4.2 LG Display Co. Ltd.
- 6.4.3 Samsung Electronics Co. Ltd.
- 6.4.4 Panasonic Corporation
- 6.4.5 Sony Group Corporation
- 6.4.6 Stratacache
- 6.4.7 Planar Systems Inc.
- 6.4.8 Hitachi Ltd.
- 6.4.9 Barco NV
- 6.4.10 Goodview
- 6.4.11 Cisco Systems Inc.
- 6.4.12 Scala Inc.
- 6.4.13 Broadsign International LLC
- 6.4.14 Appspace Inc.
- 6.4.15 BrightSign LLC
- 6.4.16 Mvix Inc.
- 6.4.17 Christie Digital Systems USA Inc.
- 6.4.18 Daktronics Inc.
- 6.4.19 Leyard Optoelectronic Co. Ltd.
- 6.4.20 Unilumin Group Co. Ltd.
- 6.4.21 JCDecaux SA
- 6.4.22 E Ink Holdings Inc.
- 6.4.23 Clear Channel Outdoor Holdings Inc.
- 6.4.24 Sharp Corporation
7 MARKET OPPORTUNITIES AND FUTURE OUTLOOK
- 7.1 White-space and Unmet-need Assessment