|
시장보고서
상품코드
1906991
전기자동차 충전소 : 시장 점유율 분석, 업계 동향 및 통계, 성장 예측(2026-2031년)Electric Vehicle Charging Station - Market Share Analysis, Industry Trends & Statistics, Growth Forecasts (2026 - 2031) |
||||||
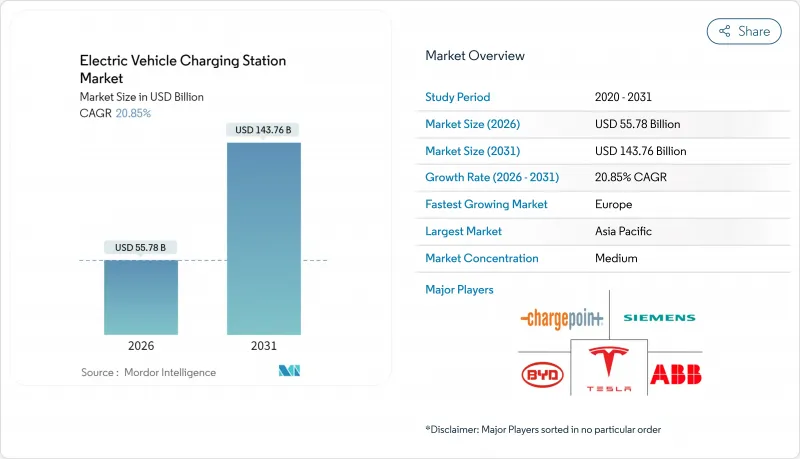
2026년 전기자동차 충전소 시장 규모는 557억 8,000만 달러로 추정되며, 2025년 461억 3,000만 달러에서 성장할 것으로 예상됩니다.
2031년까지의 예측으로는 1,437억 6,000만 달러에 달하고, 2026년부터 2031년에 걸쳐 CAGR 20.85%를 나타낼 전망입니다.
내연기관의 단계적 폐지를 위한 지속적인 정책압력, 총소유비용의 균형화를 앞당기는 급격한 배터리 비용 저하, 주행거리 불안을 해소하는 고속도로 급속충전 회랑의 전개가 수요를 급격히 밀어올리는 핵심적인 요인이 되고 있습니다. 대규모 플릿 사업자는 여러 해에 걸친 전동화 목표를 확정하고 충전기의 고가동률을 보증하는 한편, V2G(차량에서 전력망으로의 전력 공급) 비즈니스 모델이 추가 수익층을 창출해 프로젝트 수익성을 향상시키고 있습니다. 설치 대수에서는 여전히 아시아태평양이 최대이지만, 유럽에서는 국경을 넘은 네트워크 연계를 배경으로 현재 가장 급속한 증가율을 나타내고 있습니다. 북미에서는 NEVI 포뮬러 프로그램과 테슬라사의 슈퍼차저 시스템 외 브랜드 개방이 전개를 가속화함과 동시에 기술 기반에 대한 기대치를 높이고 있습니다. 한편, 쉘 등의 에너지 대기업은 석유 스탠드를 폐쇄하고 자본을 고출력 충전기로 재분배하고 있어 경쟁 격화를 촉진하는 전략적 전환을 나타내고 있습니다.
세계의 전기자동차 충전소 시장 동향과 인사이트
정부 주도 제로 방출 의무화 및 내연 기관차 금지 일정
규제의 기세에 의해 충전 인프라의 전개가 가속하고 있습니다. 각국 정부가 구속력 있는 제로에미션 차 의무화 정책을 실시하고 구체적인 충전 용량 요건을 정하고 있기 때문입니다. EU의 대체 연료 인프라 규제에서는 회원국에 EV 등록 대수에 비례한 충전 용량의 증강을 의무화하고 있습니다. 동시에 캘리포니아의 선진적 클린 플릿 규칙에서는 공공·민간 플릿 사업자에게 업종별 기한까지 제로에미션차로의 이행을 요구하고 있습니다. 중국 국가발전개혁위원회는 2024년 고속도로 서비스 지역의 충전 인프라를 확충해 충전소 3,000기와 주차 공간 5,000대분을 추가했습니다. 이에 따라 이 나라의 신에너지차 시장 침투율 40.9%를 지원하고 있습니다. 사우디아라비아가 2025년까지 5만기의 충전소 설치를 공약하고, 아랍에미리트(UAE)이 2050년까지 전기자동차 또는 하이브리드 자동차의 비율을 50%로 하는 목표를 내걸어 신흥 시장에도 규제 압력이 미치고 있습니다. 이러한 의무화는 예측 가능한 수요 시그널을 낳고 충전 인프라에의 민간 자본 투입을 정당화하는 것입니다. 이로 인해 투자 위험이 줄어들고 시장 확대가 가속화됩니다.
배터리 단가 저하로 총 소유 비용(TCO) 균형화
배터리 비용 절감은 전기자동차가 내연 기관차와 총 소유 비용(TCO)에서 동등한 임계점에 가까워지고 충전 인프라 수요를 촉진하고 있습니다. 주요 조달 계약에서는 리튬 이온 팩 가격이 100달러/kWh를 밑돌고 있으며, 사용 빈도가 높은 부문에서 전기자동차가 가솔린 자동차와 동등한 비용 경쟁력을 획득하는 데 도움이 되고 있습니다. 실리콘 카바이드 인버터와 같은 부품 혁신은 충전 효율을 높이고 에너지 손실을 줄이고 사업자에게 설치 kW 당 대응 가능한 차량 수를 증가시킵니다. 또한 저렴한 배터리는 차량 그룹 전체에 자본 지출을 분산시키는 교환 스테이션 모델을 가능하게 하고 전기자동차 충전소 업계에서 서비스 형태의 다양화를 촉진합니다. 배터리 비용의 저하와 충전 효율의 향상이 함께 시너지 효과를 낳고, 충전 시간의 단축과 인프라 이용 요건의 저감이 도입 경제성을 가속시킵니다. 특히 상용차량 운영사업자는 이 움직임으로부터 혜택을 받아 배터리 비용의 저하에 의해 소형화·고빈도화된 충전 세션이 가능해져 운영 유연성의 최적화를 도모할 수 있습니다.
150kW 초충전기의 고액 초기 설비 투자
고출력 충전 인프라의 자본 지출 요건은 특히 독립 사업자와 신흥 시장에서 도입 장벽이 됩니다. P3그룹의 유럽 e트랙 충전 인프라 분석에 따르면 2030년까지 4만 5,000기의 공공 충전 포인트와 23만 5,000기의 디포 충전 포인트가 필요할 것으로 예측되며, 높은 초기 자본 지출과 송전망 확장의 장기 승인 프로세스가 주요 과제로 확인되었습니다. 캘리포니아주 에너지 위원회의 조사에 따르면 직류 급속 충전소은 자금 조달면에서 큰 과제에 직면하고 있으며, 채산성을 높이기 위해서는 수요 요금 경감에 의한 연간 4,300달러의 절약 효과와 태양광 발전 통합에 의한 4,780-6,000달러의 절약 효과가 필요합니다. 대형 차량용으로 최대 3.75MW를 공급할 수 있는 메가와트급 충전 시스템의 도입에는 설치 장소마다 100만 달러를 넘는 대규모 전기 인프라의 업그레이드가 요구됩니다. 특히 높은 설비투자(CAPEX) 요건은 이용률이 투자를 정당화하지 못할 가능성이 있는 지역이나 서비스가 미치지 못한 지역에서의 도입을 제약하고, 충전 인프라의 가용성에 지리적인 격차를 창출하고 있습니다.
부문 분석
2025년 시점에서 승용차가 전기자동차 충전소 시장의 88.45%를 차지했지만, 상용차는 2031년까지 연평균 복합 성장률(CAGR) 52.20%로 가장 급속한 성장을 나타내고 있으며, 이것은 플릿 전동화 의무에 따른 인프라 요건을 반영한 것입니다. 버스는 중요한 상용 부문이며, 도시의 대기질 규제와 예측 가능한 운행 루트 패턴에 의해 충전 인프라의 최적 배치가 가능해지기 때문에 전동화가 가속하고 있습니다. 이륜차는 신흥 시장에서 보급이 진행되고 있으며, 특히 인도에서는 배터리 교환 모델이 경제적으로 효과적인 것으로 입증되었습니다. 트럭은 무게 제약과 운영 요구 사항에서 가장 진보된 충전 인프라를 필요로 하며, 고출력 충전 시스템 및 저장소 기반 솔루션의 혁신을 추진하고 있습니다.
상용차의 전기화는 충전 인프라 투자를 정당화하는 기간 수요를 창출합니다. 함대 사업자는 예측 가능한 사용 패턴을 제공하고 승용차보다 높은 전력 요구 사항을 갖기 때문입니다. CharIN은 오슬로에서 개최된 EVS35에서 메가와트 충전 시스템을 공식적으로 발표하여 상용차가 디젤 차량과 동등한 운용 성능을 달성할 수 있는 최대 3.75MW의 충전 용량 기준을 확립했습니다. 승용차용 인프라는 상용차 도입으로 혜택을 누릴 수 있습니다. 충전 회랑의 공유화에 의해 단위당 인프라 비용이 삭감되어 차종을 불문하고 네트워크 이용률이 향상되기 때문입니다.
직류 충전소은 2025년 시점에서 전기자동차 충전소 시장의 77.95%의 점유율을 유지했고 예측 기간 동안 CAGR 53.10%를 나타낼 전망입니다. 이것은 충전 세션 시간의 단축과 처리 능력 향상을 목표로 하는 사업자 전략이 견인한 것입니다. 오클리지 국립연구소는 무선 충전 기술에서 획기적인 성과를 달성했으며, 5인치 에어 갭을 두고 승용차에 96%의 효율로 100kW의 전력 전송을 실증했습니다. 이것은 기존의 커넥터 충전에 혁신을 가져올 수 있습니다. 22kW 미만의 AC 충전은 주로 주택 및 직장용 용도에 이용되며, 장시간 주차 시간이 저속 충전에 대응할 수 있는 한편, 이용 빈도가 낮은 설치 환경에서의 비용 우위성을 유지합니다. 상용차용 메가와트급 충전 시스템의 등장으로 전용 전기 인프라와 냉각 시스템을 필요로 하는 독자적인 초고전력 카테고리가 형성되고 있습니다.
SAE 인터내셔널은 무선식 소형 EV 충전에 관한 새로운 기준을 발표했습니다. 여기에는 서로 다른 공급업체의 하드웨어 간 상호 호환성을 제공하는 차동 유도 위치결정 시스템(DIPOS)이 포함되어 최대 93%의 효율을 달성합니다. 무선 충전 기술은 마모 및 파괴 행위의 위험이 있는 물리적 커넥터를 제거하여 사용자 편의에 대한 우려를 해결하고 인프라 유지보수 요구 사항을 줄입니다. 고출력 충전 시스템으로의 전환은 사업자의 경제성을 반영합니다. 충전 시간이 단축됨에 따라 특히 토지 비용이 높기 때문에 고속 충전이 정당화되는 교통량이 많은 곳에서 스테이션 이용률 향상과 투자 수익률 개선이 가능합니다.
지역별 분석
아시아태평양은 2025년 60.10%의 점유율로 전기자동차 충전소 시장을 선도했습니다. 중국에서 1,282만기의 공공 커넥터와 연간 25%의 설치 증가가 이를 지원하고 있습니다. 국가 프로그램에 의해 현재 6,000곳의 고속도로 서비스 지역에 설비가 정비되어 장거리 커버율이 이 나라에 있어서 40.9%의 신에너지차 판매 구성비를 반영하고 있습니다. 일본에서는 대형 트럭용 메가와트급 시스템의 도입이 선행하고, 인도에서는 이륜차용 배터리 교환 스테이션이 저비용 이동 수요에 의한 충전기 밀도 향상의 가능성을 나타내고 있습니다. 한국은 무역마찰 속에서 대체 배터리 재료 공급국으로서의 지위를 확립하고 있으며, 호주는 광대한 도시간 거리를 메우기 위해 원격지 회랑 사이트에 자금을 제공합니다.
유럽은 2031년까지 연평균 복합 성장률(CAGR) 40.50%로 지역에서 가장 급속한 성장을 보였습니다. 스파크 얼라이언스는 25개국에 11,000개의 고출력 커넥터를 통합하여 투명한 가격 설정과 100% 재생 가능 전력을 제공합니다. 독일은 2030년까지 100만기 이상의 신규 충전 포인트 설치를 계획하고 있으며, 이는 인프라 할당을 EV 등록 대수에 연동시키는 EU 규제에 따른 것입니다. 노르웨이는 세계 최고의 인구당 충전기 수를 유지하고 프랑스는 저금리 대출로 민간 설치를 촉진하고 있습니다. 영국은 2035년부터 가솔린차 신규 판매 금지 정책 외에도 공공 충전기에서 결제 카드 상호 운용성을 의무화하고 소비자의 신뢰를 더욱 강화하고 있습니다.
북미에서는 NEVI 계획에 따른 50억 달러의 자금 투입으로 가속화되어 20만 4천의 공공 충전 포트가 정비됩니다. 7개사의 자동차 제조업체가 참가하는 IONNA 사업에서는 3만기의 고출력 커넥터가 추가되어 테슬라·슈퍼차저의 다른 브랜드 대응 개수에 의해 2030년까지 60억-120억 달러의 추가 수익이 전망됩니다. 업계를 가로지르는 협력은 충전과 소매 시설의 협력을 추진하고 유럽의 서비스 스테이션 전략을 반영한 형태가 됩니다.
기타 혜택 :
- 엑셀 형식 시장 예측(ME) 시트
- 애널리스트 지원(3개월간)
자주 묻는 질문
목차
제1장 서론
- 조사 전제조건 및 시장 정의
- 조사 범위
제2장 조사 방법
제3장 주요 요약
제4장 시장 상황
- 시장 개요
- 시장 성장 촉진요인
- 정부 주도의 제로 에미션 의무화와 내연 기관차 금지 스케줄
- 배터리 단가($/kWh)의 저하에 의한 총 소유 비용(TCO)의 균형화
- 고속도로 급속 충전 회랑의 세계의 정비
- 물류 대기업에 의한 전기자동차 도입 계획의 급증
- 그리드 서비스 수익화(V2G/V2X) 비즈니스 모델
- AI 최적화에 의한 충전기 설치의 개선이 가동률 향상에 기여
- 시장 성장 억제요인
- 150kW 초충전기에서 고액의 초기 설비 투자 비용
- 불균일한 허가 취득 및 전력 회사 접속의 스케줄
- SiC MOSFET의 원재료 공급 부족
- 네트워크 접속형 충전기의 사이버 보안 취약점
- 규제 상황
- Porter's Five Forces
- 신규 참가업체의 위협
- 구매자의 협상력
- 공급기업의 협상력
- 대체품의 위협
- 경쟁 기업 간 경쟁 관계
제5장 시장 규모와 성장 예측(금액)
- 차량 유형별
- 승용차
- 상용차
- 버스 및 장거리 버스
- 충전기 유형별
- 교류 충전소
- 직류 충전소
- 소유 모델별
- 공공
- 개인 - 주거용
- 개인 - 차량 및 직장
- 설치 장소별
- 가정
- 목적지 및 소매점
- 고속도로 및 대중교통
- 차량 기지
- 커넥터 표준별
- CCS
- CHAdeMO
- GB/T
- Tesla NACS
- 무선
- 지역별
- 북미
- 미국
- 캐나다
- 기타 북미
- 남미
- 브라질
- 칠레
- 기타 남미
- 유럽
- 독일
- 영국
- 프랑스
- 노르웨이
- 이탈리아
- 스페인
- 네덜란드
- 폴란드
- 오스트리아
- 러시아
- 기타 유럽
- 아시아태평양
- 중국
- 일본
- 인도
- 한국
- 인도네시아
- 베트남
- 필리핀
- 호주
- 뉴질랜드
- 기타 아시아태평양
- 중동 및 아프리카
- 사우디아라비아
- 아랍에미리트(UAE)
- 이집트
- 튀르키예
- 남아프리카
- 기타 중동 및 아프리카
- 북미
제6장 경쟁 구도
- 시장 집중도
- 전략적 동향
- 시장 점유율 분석
- 기업 프로파일
- ABB Ltd.
- ChargePoint Inc.
- Tesla Inc.
- Siemens AG
- Schneider Electric Corporation
- Shell Plc.
- ENGIE SA(EVBox)
- BYD Motors Inc.
- Tritium Charging Inc.
- Blink Charging o.
- Delta Electronics Inc.
- Kempower Oyj
- Electrify America, LLC
- IONITY GmbH
- Leviton Manufacturing Co. Inc.
제7장 시장 기회와 향후 전망
KTH 26.01.20Electric vehicle charging station market size in 2026 is estimated at USD 55.78 billion, growing from 2025 value of USD 46.13 billion with 2031 projections showing USD 143.76 billion, growing at 20.85% CAGR over 2026-2031.
Continuous policy pressure to phase out internal-combustion engines, steep battery cost declines that bring total ownership parity forward, and the roll-out of highway fast-charging corridors that neutralize range anxiety are the core forces keeping demand on a steep climb. Large fleet operators are locking in multi-year electrification targets, guaranteeing high charger utilization, while vehicle-to-grid business models create additional revenue layers that lift project returns. Asia-Pacific still accounts for most installations, but Europe now supplies the fastest incremental growth on the back of cross-border network alliances. In North America, the NEVI Formula Program and the opening of Tesla's Supercharger system to other brands accelerate deployment while raising baseline technology expectations. Meanwhile, energy majors like Shell are closing petroleum stations and reallocating capital toward high-power chargers, signaling a strategic shift that tightens competitive intensity.
Global Electric Vehicle Charging Station Market Trends and Insights
Government-backed Zero-emission Mandates and ICE-ban Timelines
Regulatory momentum accelerates charging infrastructure deployment as governments implement binding zero-emission vehicle mandates with specific charging capacity requirements. The EU's Alternative Fuels Infrastructure Regulation mandates that member states increase charging capacity proportionally to EV registrations. At the same time, California's Advanced Clean Fleets Rule requires public and private fleet operators to transition to zero-emission vehicles by sector-specific deadlines. China's National Development and Reform Commission expanded highway service area charging infrastructure by adding 3,000 charging piles and 5,000 parking spaces in 2024, supporting the country's 40.9% new energy vehicle market penetration. Saudi Arabia's commitment to 50,000 charging stations by 2025 and the UAE's target of 50% electric or hybrid vehicles by 2050 extend regulatory pressure to emerging markets. These mandates create predictable demand signals that justify private capital deployment in charging infrastructure, reducing investment risk and accelerating market expansion.
Falling Battery $/kWh Driving TCO Parity
Battery cost reductions approach the critical threshold where electric vehicles achieve total cost of ownership parity with internal combustion engines, catalyzing charging infrastructure demand. Lithium-ion pack prices now edge below USD 100/kWh in leading procurement contracts, helping electric cars reach cost parity with petrol equivalents in usage-heavy segments. Component innovations such as silicon-carbide inverters raise charging efficiency and lower energy losses, allowing operators to serve more vehicles per installed kilowatt. Cheaper batteries also enable swap-station models that spread capex across fleets, broadening service formats within the electric vehicle charging station industry. The convergence of falling battery costs and improved charging efficiency creates a compounding effect where reduced charging times and lower infrastructure utilization requirements accelerate deployment economics. Commercial fleet operators particularly benefit from this dynamic, as reduced battery costs enable smaller, more frequent charging sessions that optimize operational flexibility.
High Upfront CAPEX for More Than 150 kW Chargers
Capital expenditure requirements for high-power charging infrastructure create deployment barriers, particularly for independent operators and emerging markets. The P3 Group analysis of European eTruck charging infrastructure forecasts 45,000 public and 235,000 depot charging points needed by 2030, with high initial capital expenditures and lengthy approval processes for grid expansions identified as primary challenges. The California Energy Commission research demonstrated that DC fast charging stations face significant financing challenges, with potential annual savings of USD 4,300 from demand charge mitigation and USD 4,780 to USD 6,000 from solar integration required to improve viability. The deployment of megawatt charging systems, capable of delivering up to 3.75 MW for heavy-duty vehicles, requires substantial electrical infrastructure upgrades exceeding USD 1 million per installation site. High CAPEX requirements particularly constrain deployment in rural and underserved areas where utilization rates may not justify investment, creating geographic disparities in charging infrastructure availability.
Other drivers and restraints analyzed in the detailed report include:
- Global Build-out of Highway Fast-charging Corridors
- Surging Fleet-Electrification Commitments from Logistics Giants
- Uneven Permitting and Utility Interconnection Timelines
For complete list of drivers and restraints, kindly check the Table Of Contents.
Segment Analysis
Passenger cars commanded 88.45% of the electric vehicle charging station market share in 2025, yet commercial vehicles exhibit the fastest growth at 52.20% CAGR through 2031, reflecting the infrastructure requirements for fleet electrification mandates. Buses represent a critical commercial segment where electrification accelerates due to urban air quality mandates and predictable route patterns that enable optimized charging infrastructure deployment. Two-wheelers gain traction in emerging markets where battery swapping models prove economically viable, particularly in India. Trucks require the most sophisticated charging infrastructure due to weight constraints and operational demands, driving innovation in high-power charging systems and depot-based solutions.
Commercial vehicle electrification creates anchor demand that justifies charging infrastructure investment, as fleet operators provide predictable utilization patterns and higher power requirements than passenger vehicles. CharIN officially launched the Megawatt Charging System at EVS35 in Oslo, establishing standards for charging capacities up to 3.75 MW that enable commercial vehicles to achieve operational parity with diesel counterparts. Passenger car infrastructure benefits from commercial vehicle deployment as shared charging corridors reduce per-unit infrastructure costs and improve network utilization rates across vehicle categories.
DC charging station maintained 77.95% of the electric vehicle charging station market share in 2025, while it accelerated at 53.10% CAGR during the forecast period, driven by operator strategies to reduce charging session duration and increase throughput. Oak Ridge National Laboratory achieved a breakthrough in wireless charging technology, demonstrating 100-kW power transfer to passenger vehicles with 96% efficiency across a five-inch air gap, potentially disrupting traditional connector-based charging. AC charging below 22 kW serves primarily residential and workplace applications where longer dwell times accommodate slower charging speeds, while maintaining cost advantages for installations with lower utilization requirements. The emergence of megawatt charging systems for commercial vehicles creates a distinct ultra-high-power category that requires specialized electrical infrastructure and cooling systems.
SAE International published new standards for wireless light-duty EV charging, including the Differential Inductive Positioning System that enables cross-compatibility among different suppliers' hardware with up to 93% efficiency. Wireless charging technology addresses user convenience concerns and reduces infrastructure maintenance requirements by eliminating physical connectors that experience wear and vandalism. The transition toward higher-power charging systems reflects operator economics. Reduced charging times enable higher station utilization and improved return on investment, particularly in high-traffic locations where land costs justify premium charging speeds.
The Electric Vehicle Charging Station Market Report is Segmented by Vehicle Type (Passenger Cars, Commercial Vehicles, and More), Charger Type (AC Charging Station, and DC Charging Station), Ownership Model (Public, and More), Installation Site (Home, and More), Connector Standard (CCS, and More), and Geography. The Market Forecasts are Provided in Terms of Value (USD).
Geography Analysis
Asia-Pacific leads the electric vehicle charging station market with a 60.10% share in 2025, supported by China's 12.82 million public connectors and a 25% annual installation increase. National programs now equip 6,000 highway service areas, ensuring long-distance coverage mirrors the country's 40.9% new-energy vehicle sales mix. Japan pioneers megawatt systems for heavy trucks, while India's two-wheeler battery-swapping hubs show how low-cost mobility needs can accelerate charger density. South Korea is positioning itself as an alternative battery-material supplier amid trade tensions, and Australia funds remote-area corridor sites to bridge its vast intercity distances.
Europe shows the fastest regional growth at 40.50% CAGR to 2031. The Spark Alliance integrates 11,000 high-power connectors across 25 countries, offering transparent pricing and 100% renewable electricity. Germany's plan for more than 1 million new charging points by 2030 aligns with EU regulations that tie infrastructure quotas to EV registrations. Norway retains the world's highest per-capita charger count, while France uses low-interest loans to spur private deployments. UK policy bans sales of most new petrol cars from 2035 and now mandates payment-card interoperability at public chargers, further strengthening consumer confidence.
North America accelerates through the NEVI Formula's USD 5 billion funding, enabling 204,000 public ports. The seven-automaker IONNA venture will add 30,000 high-power connectors, and the retrofitting of Tesla Superchargers for multi-brand use could generate USD 6-12 billion in additional revenue by 2030. Cross-industry alliances link charging to retail amenities, mirroring European service-station strategies.
- ABB Ltd.
- ChargePoint Inc.
- Tesla Inc.
- Siemens AG
- Schneider Electric Corporation
- Shell Plc.
- ENGIE SA (EVBox)
- BYD Motors Inc.
- Tritium Charging Inc.
- Blink Charging o.
- Delta Electronics Inc.
- Kempower Oyj
- Electrify America, LLC
- IONITY GmbH
- Leviton Manufacturing Co. Inc.
Additional Benefits:
- The market estimate (ME) sheet in Excel format
- 3 months of analyst support
TABLE OF CONTENTS
1 Introduction
- 1.1 Study Assumptions and Market Definition
- 1.2 Scope of the Study
2 Research Methodology
3 Executive Summary
4 Market Landscape
- 4.1 Market Overview
- 4.2 Market Drivers
- 4.2.1 Government-backed zero-emission mandates and ICE-ban timelines
- 4.2.2 Falling battery $/kWh driving TCO parity
- 4.2.3 Global build-out of highway fast-charging corridors
- 4.2.4 Surging fleet-electrification commitments from logistics giants
- 4.2.5 Grid-services monetisation (V2G/V2X) business models
- 4.2.6 AI-optimised charger siting improving utilisation rates
- 4.3 Market Restraints
- 4.3.1 High upfront CAPEX for More Than 150 kW chargers
- 4.3.2 Uneven permitting and utility interconnection timelines
- 4.3.3 Raw-material bottlenecks for SiC MOSFETs
- 4.3.4 Cyber-security vulnerabilities in networked chargers
- 4.4 Regulatory Landscape
- 4.5 Porter's Five Forces
- 4.5.1 Threat of New Entrants
- 4.5.2 Bargaining Power of Buyers
- 4.5.3 Bargaining Power of Suppliers
- 4.5.4 Threat of Substitutes
- 4.5.5 Competitive Rivalry
5 Market Size and Growth Forecasts (Value (USD))
- 5.1 By Vehicle Type
- 5.1.1 Passenger Cars
- 5.1.2 Commercial Vehicles
- 5.1.3 Buses and Coaches
- 5.2 By Charger Type
- 5.2.1 AC Charging Station
- 5.2.2 DC Charging Station
- 5.3 By Ownership Model
- 5.3.1 Public
- 5.3.2 Private - Residential
- 5.3.3 Private - Fleet/Workplace
- 5.4 By Installation Site
- 5.4.1 Home
- 5.4.2 Destination/Retail
- 5.4.3 Highway/Transit
- 5.4.4 Fleet Depot
- 5.5 By Connector Standard
- 5.5.1 CCS
- 5.5.2 CHAdeMO
- 5.5.3 GB/T
- 5.5.4 Tesla NACS
- 5.5.5 Wireless
- 5.6 By Geography
- 5.6.1 North America
- 5.6.1.1 United States
- 5.6.1.2 Canada
- 5.6.1.3 Rest of North America
- 5.6.2 South America
- 5.6.2.1 Brazil
- 5.6.2.2 Chile
- 5.6.2.3 Rest of South America
- 5.6.3 Europe
- 5.6.3.1 Germany
- 5.6.3.2 United Kingdom
- 5.6.3.3 France
- 5.6.3.4 Norway
- 5.6.3.5 Italy
- 5.6.3.6 Spain
- 5.6.3.7 Netherlands
- 5.6.3.8 Poland
- 5.6.3.9 Austria
- 5.6.3.10 Russia
- 5.6.3.11 Rest of Europe
- 5.6.4 Asia-Pacific
- 5.6.4.1 China
- 5.6.4.2 Japan
- 5.6.4.3 India
- 5.6.4.4 South Korea
- 5.6.4.5 Indonesia
- 5.6.4.6 Vietnam
- 5.6.4.7 Philippines
- 5.6.4.8 Australia
- 5.6.4.9 New Zealand
- 5.6.4.10 Rest of Asia-Pacific
- 5.6.5 Middle East and Africa
- 5.6.5.1 Saudi Arabia
- 5.6.5.2 United Arab Emirates
- 5.6.5.3 Egypt
- 5.6.5.4 Turkey
- 5.6.5.5 South Africa
- 5.6.5.7 Rest of Middle East and Africa
- 5.6.1 North America
6 Competitive Landscape
- 6.1 Market Concentration
- 6.2 Strategic Moves
- 6.3 Market Share Analysis
- 6.4 Company Profiles (includes Global level Overview, Market level overview, Core Segments, Financials as available, Strategic Information, Market Rank/Share, Products and Services, and Recent Developments)
- 6.4.1 ABB Ltd.
- 6.4.2 ChargePoint Inc.
- 6.4.3 Tesla Inc.
- 6.4.4 Siemens AG
- 6.4.5 Schneider Electric Corporation
- 6.4.6 Shell Plc.
- 6.4.7 ENGIE SA (EVBox)
- 6.4.8 BYD Motors Inc.
- 6.4.9 Tritium Charging Inc.
- 6.4.10 Blink Charging o.
- 6.4.11 Delta Electronics Inc.
- 6.4.12 Kempower Oyj
- 6.4.13 Electrify America, LLC
- 6.4.14 IONITY GmbH
- 6.4.15 Leviton Manufacturing Co. Inc.
7 Market Opportunities and Future Outlook
- 7.1 White-space and Unmet-Need Assessment