
|
시장보고서
상품코드
1851439
가상 망막 디스플레이 시장 : 점유율 분석, 산업 동향, 통계, 성장 예측(2025-2030년)Virtual Retinal Display - Market Share Analysis, Industry Trends & Statistics, Growth Forecasts (2025 - 2030) |
||||||
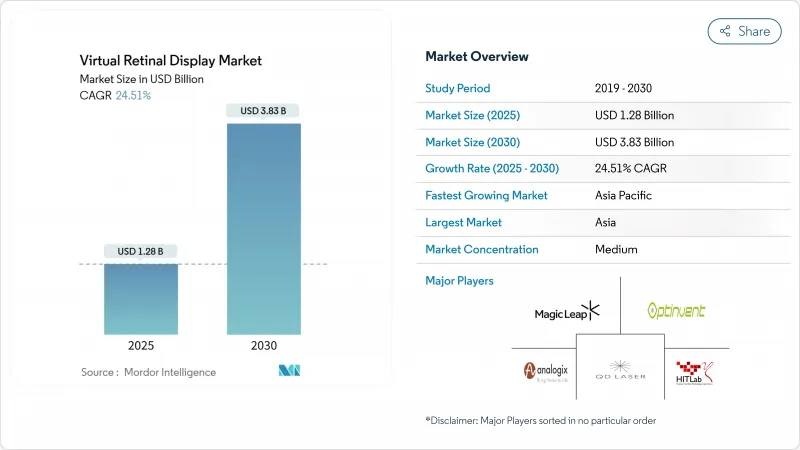
세계의 가상 망막 디스플레이 시장 규모는 2025년 12억 8,000만 달러로, 2030년에는 38억 3,000만 달러에 이를 것으로 예상되며 CAGR은 24.51%를 기록할 것으로 보입니다.
경량 망막 투영은 실리콘 포토닉스의 비용이 낮아지고, 군으로부터의 수주가 가속되고 있는 것, 선진국의 헬스케어 프로바이더가 시각 케어의 워크플로우를 디지털화하고 있는 등으로부터, 실험적 랩에서 주류 생산으로 이행하고 있습니다. 스크린 기반에서 스크린리스 증강현실 아키텍처로의 전환은 시야각과 환경 빛의 제한을 없애는 동시에 안경 등급의 폼 팩터를 가능하게 합니다. 미국 육군 병사용 컬러 MicroLED 이니셔티브와 일본의 노인 시력 재활 보조금 등의 조달 프로그램이 수요를 견인하고 있습니다. 한편 부품 제조업체는 컨트롤러, 레이저 및 도파관을 소형화하여 전력 예산을 줄이고 가전 채널을 개척하고 있습니다.
세계 가상 망막 디스플레이 시장 동향과 통찰
군용 스마트 헬멧의 초소형 니어 아이 디스플레이 수요 급증
방어 프로그램에서는 야간 감지기에 보이지 않으면서 낮에는 밝은 디스플레이가 우선합니다. 미국 육군의 Light Secure Special Warfare Display 프로젝트는 망막을 직접 조사하고 외광 누출을 없애는 프로토타입에 자금을 제공합니다. Kopin의 750만 달러 이상의 군인 컬러 MicroLED 계약은 견고한 망막 투영이 현장에서 사용하기 위한 크기, 무게 및 전력 목표를 충족하는 방법을 명확하게 보여줍니다.
저시력 환자용 망막 투영형 보조구가 일본과 네덜란드에서 급속히 보급
무작위화 시험을 통해 망막 투영형 레이저 안경은 렌즈를 사용할 수 없는 곳에서도 시력을 개선하는 것으로 나타났으며, 일본의 보험사와 독일의 클리닉은 하이엔드 시스템의 상환을 시작했습니다. 합리화된 EU-MDR 승인과 스위스의 폭넓은 보험 적용은 프리미엄 치료 장비를 지원하고 제조업체가 의료에 초점을 맞춘 설계를 우선하도록 촉구합니다.
고단가 레이저 스캐너 ASP가 400달러의 AR 글래스 가격 이하의 BOM 압력을 유발
RGB 레이저 엔진은 화합물 반도체 웨이퍼와 정밀 MEMS 스캐너가 대량 생산에 적합하지 않기 때문에 여전히 디바이스 총 비용의 40%를 차지하고 있습니다. 자동차 업계의 경험에서 AEC-Q100 미러도 비슷한 가격 경직성을 보여주고 있으며, 소비자 브랜드는 광학 부품에 보조금을 내거나 USD 400 이하의 가격 목표를 배워야합니다.
부문 분석
디스플레이 광원 소자, 주로 RGB 레이저와 MicroLED 엔진은 2024년 가상 망막 디스플레이 시장 점유율의 34.5%를 차지했습니다. 그 이점은 광학 효율과 배터리 수명이 직접 연결되어 있기 때문입니다. 시선 추적 및 캘리브레이션 모듈은 CAGR 26.7%로 급증하고 있습니다. 시선 추적의 가상 망막 디스플레이 시장 규모는 MEMS 미러 공급 제약이 계속되고 통합자가 소프트웨어 중심의 고정밀 모니터링을 향해 확대될 것으로 예측됩니다. 텍사스 기기의 DLPC8445 컨트롤러는 4K UHD를 구동하면서 90% 축소하여 백엔드 실리콘이 프론트엔드 레이저와 보조를 맞추고 있음을 증명합니다.
투명 도파관과 망막 프로젝터를 융합시키는 DigiLens와 Avegant와 같은 협업을 통해 광 결합기와 도파관은 진보하고 있습니다. 한편 Q-Pixel의 10,000 PPI 가변 다색 LED는 정렬 공차를 낮추고 수율을 향상시키는 단일 픽셀 아키텍처를 시사합니다. 수직 통합이 깊어짐에 따라 이미터와 제어 전자 장치를 모두 제어하는 부품 공급업체는 지속 가능한 마진을 획득했습니다.
AR 스마트 글라스는 2024년 가상 망막 디스플레이 시장 매출의 41%를 차지해 하드웨어 카테고리의 핵심 역할을 굳혔습니다. 이식형 및 저시력 에이드는 고령화와 보험사의 상환으로 보급이 가속화되고 2030년까지의 CAGR은 27.2%를 보일 것으로 보입니다. 치료 보조기구의 가상 망막 디스플레이 시장 규모는 임상 증거가 계속 확대되고 있기 때문에 상승 할 전망입니다. Quanta Computer의 Vuzix에 대한 5백만 달러의 추가 투자와 같은 투자는 도파관 처리량을 향상시키고 수탁 제조의 영향력을 높일 수 있습니다.
독립형 망막 투영 헤드셋은 장시간의 임무에서 전용 파워 팩이 정당화되는 방어 및 산업 시뮬레이션의 틈새 시장에서 존속하고 있습니다. 차량용 HUD는 텍사스 기기가 2025년 3월에 DLP4620S-Q1 차량용 마이크로 미러를 발표했음에도 불구하고 수량 확대를 억제하고 있습니다. 시장 편향은 소비자의 편의성과 전문가의 전문성을 보여주며 공급업체는 두 로드맵의 균형을 맞추어야 합니다.
지역 분석
아시아태평양은 2024년에 27.8%의 수익 점유율을 차지하며, 2030년까지 매년 27.6%의 성장이 예측되고 있습니다. 이것은 타의 추종을 불허하는 반도체 팹, 광학 연마 공급망 및 국내 소비자의 욕구를 반영합니다. 중국의 주조 인센티브는 레이저 다이의 가격을 밀어 내리고 일본의 건강 관리 시스템은 노화성 변성증 치료 장치를 적극적으로 도입하고 있습니다. 한국의 디스플레이 대기업은 OLED의 능력과 MicroLED의 파일럿 라인을 조합하고, 대만은 백엔드의 패키징 수율을 향상시킵니다.
북미는 방위 예산과 대학의 연구 개발을 활용하고 있습니다. 가상 망막 디스플레이 시장은 미국 육군의 잇따른 microLED 계약과 CHIPS-Act가 지원하는 실리콘 포토닉스 팹으로부터 혜택을 받아 중요한 광학 부품이 현지화됩니다. 캐나다는 의료기기 심사가 합리화되었기 때문에 치료제 출시를 위한 퍼스트 인 리전으로서 매력적이며, 멕시코의 마키라도라 코리더는 북미 내에 수출하기 위한 무관세 최종 어셈블리를 제공합니다.
유럽은 여전히 규제 페이스메이커입니다. Class 1 레이저 규제는 Valeda 광 바이오 모듈레이션의 선례와 결합하여 제조업체가 세계적으로 모방할 수 있는 예측 가능한 프레임 워크를 제공합니다. 독일과 스위스는 정밀 광학 기계 가공과 의료 기술 자금을 융합시켜 고가치 의료용 디스플레이에 맞춘 생태계를 육성하고 있습니다. 북유럽의 조기 도입 기업은 라이프 스타일 지향 AR 안경을 테스트하고 배터리 수명과 인체 공학적 피드백 루프를 제공합니다. EU의 에너지 지령은 또한 공급업체를 저전력 설계로 향하게 하고 지속가능성을 중시하는 시장에서 유럽 기업에게 영향력을 주고 있습니다.
기타 혜택:
- 엑셀 형식 시장 예측(ME) 시트
- 3개월간의 애널리스트 서포트
목차
제1장 서론
- 조사의 전제조건과 시장의 정의
- 조사 범위
제2장 조사 방법
제3장 주요 요약
제4장 시장 상황
- 시장 개요
- 시장 성장 촉진요인
- 군용 스마트 헬멧에 초소형 니어 아이 디스플레이 수요 급증
- 망막 투영형 보조구의 저시력 환자에 대한 보급이 일본과 독일에서 급속히 진행
- 미국에서 실리콘 포토닉스의 비용 저하가 견인하는 스크린 베이스에서 스크린리스로의 AR 웨어러블 전환
- EU에서 시력 보호 클래스 1 레이저 규제가 소비자의 보급을 촉진
- AI 시선 추적 모듈의 통합이 북미의 몰입형 훈련 시뮬레이터를 뒷받침
- 시장 성장 억제요인
- 고단가 레이저 스캐너 ASP가 400달러의 AR 글래스 가격 이하의 BOM 압력을 유발
- 이식형 및 치료용 VRD의 복잡한 FDA 및 MDR 패스웨이
- 게임 체험을 제한하는 RGB 레이저 엔진의 지연과 스펙클 아티팩트
- 헤드업 디스플레이용 차재 그레이드 MEMS 미러(AEC-Q100)공급 부족
- 생태계 분석
- 기술의 전망
- Porter's Five Forces 분석
- 공급기업의 협상력
- 구매자의 협상력
- 신규 참가업체의 위협
- 대체품의 위협
- 경쟁 기업간 경쟁 관계
제5장 시장 규모와 성장 예측
- 컴포넌트별
- 디스플레이 광원(RGB 레이저, 마이크로 LED, OLED)
- MEMS 스캐닝 유닛
- 드라이버 및 제어 일렉트로닉스
- 시선 추적 및 캘리브레이션 모듈
- 광결합기 및 도파관
- 기타
- 제품 유형별
- 독립형 망막 투영 헤드셋
- 증강현실 스마트 글라스
- 자동차용 헤드업 디스플레이
- 이식형 및 저시력 에이드
- 기타
- 용도별
- 의료 및 생명과학
- 항공우주 및 방위
- 가전 및 게임
- 자동차 및 운수
- 산업, 교육, 교육
- 해상도별
- HD(최대 720p)
- 풀 HD(1080p)
- 2K-4K
- 4K 이상
- 지역별
- 북미
- 미국
- 캐나다
- 멕시코
- 유럽
- 독일
- 영국
- 프랑스
- 북유럽 국가
- 기타 유럽
- 남미
- 브라질
- 기타 남미
- 아시아태평양
- 중국
- 일본
- 인도
- 동남아시아
- 기타 아시아태평양
- 중동 및 아프리카
- 중동
- GCC
- 튀르키예
- 기타 중동
- 아프리카
- 남아프리카
- 기타 아프리카
- 북미
제6장 경쟁 구도
- 시장 집중도
- 전략적 동향
- 시장 점유율 분석
- 기업 프로파일
- Avegant Corporation
- QD Laser, Inc.
- Magic Leap, Inc.
- Texas Instruments Incorporated
- Himax Technologies, Inc.
- eMagin Corporation
- Vuzix Corporation
- OmniVision Technologies, Inc.
- Sony Group Corporation
- Kopin Corporation
- STMicroelectronics NV
- MicroVision, Inc.
- SeeYa Technology Co., Ltd.
- Syndiant, Inc.
- DigiLens Inc.
- Lumus Ltd.
- Mojo Vision Inc.
- Analogix Semiconductor, Inc.
- Jenoptik AG
- Corning Incorporated
- Optivent
- Human Interface Technology Laboratory
제7장 시장 기회와 장래의 전망
JHS 25.11.13The virtual retinal display market size is is estimated reached USD 1.28 billion in 2025 and is expected to attain USD 3.83 billion by 2030, registering a 24.51% CAGR.

Light-weight retinal projection is moving from experimental labs to mainstream production because silicon-photonics costs are declining, military orders are accelerating, and healthcare providers in developed economies are digitizing vision-care workflows. Transitioning from screen-based to screen-less augmented-reality architecture removes viewing-angle and ambient-light limits while enabling glasses-grade form factors. Procurement programs such as the U.S. Army's soldier color MicroLED initiative and Japan's aged-care vision rehabilitation funding are pulling demand forward. Meanwhile, component makers are shrinking controllers, lasers, and waveguides, which lowers power budgets and opens consumer electronics channels.
Global Virtual Retinal Display Market Trends and Insights
Surging Demand for Ultra-Compact Near-Eye Displays in Military Smart Helmets
Defense programs prioritize displays invisible to night-vision detectors yet bright in daylight. The U.S. Army's Light Secure Special Warfare Display project funds prototypes that illuminate the retina directly, eliminating outward light leakage. Kopin's soldier color MicroLED contracts worth more than USD 7.5 million underscore how ruggedized retinal projection meets size, weight, and power targets for field use.
Rapid Adoption of Retinal Projection Aids for Low-Vision Patients across Japan and DACH
Randomized trials show retinal laser eyewear improves acuity where lenses fail, prompting Japan's insurers and German clinics to reimburse high-end systems. Streamlined EU-MDR approvals and generous coverage in Switzerland support premium therapeutic devices, encouraging manufacturers to prioritize health-care-focused designs.
High Per-Unit Laser Scanner ASPs Causing BOM Pressures below USD 400 AR Glass Price-Point
RGB laser engines still consume up to 40% of total device cost because compound-semiconductor wafers and precision MEMS scanners lack mass-volume scale. Automotive experience shows similar price rigidity for AEC-Q100 mirrors, meaning consumer brands must subsidize optics or forego sub-USD 400 price targets.
Other drivers and restraints analyzed in the detailed report include:
- Shift from Screen-Based to Screen-Less AR Wearables Driven by Silicon-Photonics Cost Drops in U.S.
- Vision-Safe Class-1 Laser Regulations Enabling Wider Consumer Adoption in EU
- Complex FDA and MDR Pathways for Implantable/Therapeutic VRDs
For complete list of drivers and restraints, kindly check the Table Of Contents.
Segment Analysis
Display Light Source elements, chiefly RGB laser and MicroLED engines, accounted for 34.5% of virtual retinal display market share in 2024. Their dominance stems from the direct link between optical efficiency and battery life. Eye-Tracking & Calibration Modules are expanding fastest at 26.7% CAGR, fueled by AI-enabled gaze analytics. The virtual retinal display market size for Eye-Tracking is expected to widen as MEMS mirrors remain supply-constrained, nudging integrators toward software-centric precision monitoring. Texas Instruments' DLPC8445 controller shrinks by 90% while driving 4K UHD, proving backend silicon keeps pace with front-end lasers.
Optical Combiners and Waveguides are advancing through collaborations such as DigiLens and Avegant, which merge transparent waveguides with retinal projectors. Meanwhile, Q-Pixel's 10,000 PPI tunable polychromatic LEDs hint at single-pixel architectures that could lower alignment tolerances and yield gains. As vertical integration deepens, component vendors that control both emitters and control electronics command sustainable margins.
AR Smart Glasses delivered 41% of virtual retinal display market revenue in 2024, cementing their role as the anchor hardware category. Implantable/Low-Vision Aids, though smaller today, will post a 27.2% CAGR to 2030 as aging populations and insurer reimbursement accelerate uptake. The virtual retinal display market size for therapeutic aids is poised to climb because clinical evidence keeps expanding. Investments such as Quanta Computer's additional USD 5 million in Vuzix improve waveguide throughput, signaling contract manufacturing's growing influence.
Standalone Retinal Projection Headsets persist in defense and industrial simulation niches where long-mission runtimes justify dedicated power packs. Automotive HUDs await qualified MEMS mirrors, which restrains volume scaling despite Texas Instruments' new DLP4620S-Q1 automotive micromirror introduction through Mouser in March 2025. Market skews show consumer convenience versus professional specialization, and suppliers must balance the two roadmaps.
The Virtual Retinal Display Market Report is Segmented by Component (Display Light Source, MEMS Scanning Unit, and More), Product Type (Standalone Retinal Projection Headsets, Augmented-Reality Smart Glasses, and More), Application (Medical and Life Sciences, Aerospace and Defense, and More), Resolution (HD (Upto 720p), Full HD (1080p), and More), and Geography. The Market Forecasts are Provided in Terms of Value (USD).
Geography Analysis
Asia-Pacific held 27.8% revenue share in 2024 and is forecast to compound 27.6% annually through 2030, reflecting unmatched semiconductor fabs, optics polishing supply chains, and domestic consumer appetites. China's foundry incentives push down laser-die pricing, and Japan's healthcare system actively deploys therapeutic devices for age-related degeneration. South Korea's display giants couple OLED competencies with MicroLED pilot lines, while Taiwan tightens backend packaging yields.
North America leverages defense budgets and university R&D. The virtual retinal display market benefits from the U.S. Army's successive microLED contracts and CHIPS-Act-backed silicon-photonics fabs that localize critical optics. Canada offers streamlined medical-device reviews, making it an attractive first-in-region for therapeutic launches, and Mexico's maquiladora corridors provide tariff-free final assembly for export within North America.
Europe remains regulatory pacesetter. Class-1 laser regulations, coupled with the Valeda photobiomodulation precedent, furnish predictable frameworks that manufacturers can replicate globally. Germany and Switzerland merge precision optics machining with med-tech funding, fostering an ecosystem tailored to high-value medical displays. Nordic early-adopters test lifestyle-oriented AR eyewear, providing feedback loops for battery life and ergonomics. EU energy directives additionally steer suppliers toward low-power designs, giving European players leverage in sustainability-minded markets.
- Avegant Corporation
- QD Laser, Inc.
- Magic Leap, Inc.
- Texas Instruments Incorporated
- Himax Technologies, Inc.
- eMagin Corporation
- Vuzix Corporation
- OmniVision Technologies, Inc.
- Sony Group Corporation
- Kopin Corporation
- STMicroelectronics N.V.
- MicroVision, Inc.
- SeeYa Technology Co., Ltd.
- Syndiant, Inc.
- DigiLens Inc.
- Lumus Ltd.
- Mojo Vision Inc.
- Analogix Semiconductor, Inc.
- Jenoptik AG
- Corning Incorporated
- Optivent
- Human Interface Technology Laboratory
Additional Benefits:
- The market estimate (ME) sheet in Excel format
- 3 months of analyst support
TABLE OF CONTENTS
1 INTRODUCTION
- 1.1 Study Assumptions and Market Definition
- 1.2 Scope of the Study
2 RESEARCH METHODOLOGY
3 EXECUTIVE SUMMARY
4 MARKET LANDSCAPE
- 4.1 Market Overview
- 4.2 Market Drivers
- 4.2.1 Surging Demand for Ultra-Compact Near-Eye Displays in Military Smart Helmets
- 4.2.2 Rapid Adoption of Retinal Projection Aids for Low-Vision Patients across Japan and DACH
- 4.2.3 Shift from Screen-Based to Screen-Less AR Wearables Driven by Silicon-Photonics Cost Drops in U.S.
- 4.2.4 Vision-Safe Class-1 Laser Regulations Enabling Wider Consumer Adoption in EU
- 4.2.5 Integration of AI Eye-Tracking Modules Boosting Immersive Training Simulators in North America
- 4.3 Market Restraints
- 4.3.1 High Per-Unit Laser Scanner ASPs Causing BOM Pressures below USD 400 AR Glass Price-Point
- 4.3.2 Complex FDA and MDR Pathways for Implantable/Therapeutic VRDs
- 4.3.3 Latency and Speckle Artifacts in RGB-Laser Engines Limiting Gaming Experience
- 4.3.4 Shortage of Automotive-Grade MEMS Mirrors (AEC-Q100) for Head-Up Displays
- 4.4 Industry Ecosystem Analysis
- 4.5 Technological Outlook
- 4.6 Porter's Five Forces Analysis
- 4.6.1 Bargaining Power of Suppliers
- 4.6.2 Bargaining Power of Buyers
- 4.6.3 Threat of New Entrants
- 4.6.4 Threat of Substitutes
- 4.6.5 Intensity of Competitive Rivalry
5 MARKET SIZE AND GROWTH FORECASTS (VALUES)
- 5.1 By Component
- 5.1.1 Display Light Source (RGB Laser, Micro-LED, OLED)
- 5.1.2 MEMS Scanning Unit
- 5.1.3 Driver and Control Electronics
- 5.1.4 Eye-Tracking and Calibration Module
- 5.1.5 Optical Combiner and Waveguide
- 5.1.6 Others
- 5.2 By Product Type
- 5.2.1 Standalone Retinal Projection Headsets
- 5.2.2 Augmented-Reality Smart Glasses
- 5.2.3 Automotive Head-Up Displays
- 5.2.4 Implantable/Low-Vision Aids
- 5.2.5 Others
- 5.3 By Application
- 5.3.1 Medical and Life Sciences
- 5.3.2 Aerospace and Defense
- 5.3.3 Consumer Electronics and Gaming
- 5.3.4 Automotive and Transportation
- 5.3.5 Industrial, Education and Training
- 5.4 By Resolution
- 5.4.1 HD (Upto 720p)
- 5.4.2 Full HD (1080p)
- 5.4.3 2K-4K
- 5.4.4 Above 4K
- 5.5 By Geography
- 5.5.1 North America
- 5.5.1.1 United States
- 5.5.1.2 Canada
- 5.5.1.3 Mexico
- 5.5.2 Europe
- 5.5.2.1 Germany
- 5.5.2.2 United Kingdom
- 5.5.2.3 France
- 5.5.2.4 Nordics
- 5.5.2.5 Rest of Europe
- 5.5.3 South America
- 5.5.3.1 Brazil
- 5.5.3.2 Rest of South America
- 5.5.4 Asia-Pacific
- 5.5.4.1 China
- 5.5.4.2 Japan
- 5.5.4.3 India
- 5.5.4.4 South-East Asia
- 5.5.4.5 Rest of Asia-Pacific
- 5.5.5 Middle East and Africa
- 5.5.5.1 Middle East
- 5.5.5.1.1 Gulf Cooperation Council Countries
- 5.5.5.1.2 Turkey
- 5.5.5.1.3 Rest of Middle East
- 5.5.5.2 Africa
- 5.5.5.2.1 South Africa
- 5.5.5.2.2 Rest of Africa
- 5.5.1 North America
6 COMPETITIVE LANDSCAPE
- 6.1 Market Concentration
- 6.2 Strategic Moves
- 6.3 Market Share Analysis
- 6.4 Company Profiles (includes Global Level Overview, Market Level Overview, Core Segments, Financials as available, Strategic Information, Market Rank/Share for key companies, Products and Services, and Recent Developments)
- 6.4.1 Avegant Corporation
- 6.4.2 QD Laser, Inc.
- 6.4.3 Magic Leap, Inc.
- 6.4.4 Texas Instruments Incorporated
- 6.4.5 Himax Technologies, Inc.
- 6.4.6 eMagin Corporation
- 6.4.7 Vuzix Corporation
- 6.4.8 OmniVision Technologies, Inc.
- 6.4.9 Sony Group Corporation
- 6.4.10 Kopin Corporation
- 6.4.11 STMicroelectronics N.V.
- 6.4.12 MicroVision, Inc.
- 6.4.13 SeeYa Technology Co., Ltd.
- 6.4.14 Syndiant, Inc.
- 6.4.15 DigiLens Inc.
- 6.4.16 Lumus Ltd.
- 6.4.17 Mojo Vision Inc.
- 6.4.18 Analogix Semiconductor, Inc.
- 6.4.19 Jenoptik AG
- 6.4.20 Corning Incorporated
- 6.4.21 Optivent
- 6.4.22 Human Interface Technology Laboratory
7 MARKET OPPORTUNITIES AND FUTURE OUTLOOK
- 7.1 White-Space and Unmet-Need Assessment
