
|
시장보고서
상품코드
1851524
소규모 LNG : 시장 점유율 분석, 산업 동향, 통계, 성장 예측(2025-2030년)Small-scale LNG - Market Share Analysis, Industry Trends & Statistics, Growth Forecasts (2025 - 2030) |
||||||
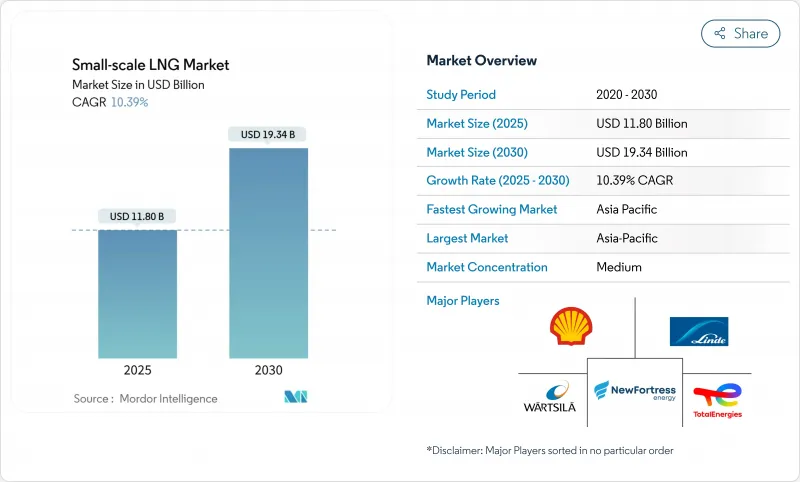
소규모 LNG 시장 규모는 2025년에 118억 달러로 추정되고, 2030년에는 193억 4,000만 달러에 이를 것으로 예상되며, 예측 기간(2025-2030년)의 CAGR은 10.39%를 나타낼 전망입니다.

수요는 석유·디젤에서 천연가스로의 전환을 진행하는 산업계와 원격지의 커뮤니티에 의해 추진되어 개발자는 좌초가스를 수익화하고 건설 스케줄을 단축하는 조립식 플랜트를 전개합니다. 1MTPA 이하의 용량에 최적화된 액화 기술, 대형 운송에서의 LNG 이용 확대, 주요 경제국의 규제 우대 조치가 견조한 자본 형성을 지원하고 있습니다. 세계 에너지 메이저와 민첩한 전문가들이 뛰어난 자산 확보, 전략적 제휴, 밸류체인 전반에 걸친 독자적인 기술 플랫폼의 확립을 경쟁하고, 경쟁이 격화되고 있습니다. 지정학적 불확실성 증가와 단기계약으로의 축족 이행으로 인해 스팟 가격의 변동성이 높아지고 있지만, 전력, 선박, 트럭 운송 등의 분야에서 LNG의 채용이 계속되고 있으며, 지속적인 성장 기회가 예상되고 있습니다.
세계의 소규모 LNG 시장 동향과 인사이트
IMO와 FuelEU의 해상 유황 상한 규제 강화가 해상 LNG 벙커링 채용을 가속
IMO와 FuelEU Maritime 패키지에 의해 설정된 새로운 황과 온실가스 규제는 선박 운항자가 탄소 컴플라이언스 비용 상승을 피하기 위해 LNG를 채택하도록 장려합니다. EU 배출량 거래 제도는 EU 항구에 기항하는 대형 선박의 CO2 배출량에 가격을 붙이게 되고, FuelEU의 규칙은 2025년까지 탄소 강도를 2% 삭감할 것을 요구하고 있지만 LNG 연료선은 라이프사이클 배출량이 76.3-92.3gCO2e/MJ이기 때문에 2034년 세계 벙커 수요는 2023년에 1,290만 톤에 이르렀고, 2024년 말까지 56척의 LNG 벙커 선대가 이를 지원했습니다. 선주는 기록적인 듀얼 연료의 신조선 주문과 리노베이션으로 이에 부응하여 유럽의 항구 전체에서 육상 로딩 암, 저온 호스, 안전 프로토콜에 대한 투자를 촉진하고 있습니다.
원격지 채광 및 오프 그리드 발전을위한 모듈 형 액화 플랜트의 신속한 구축
스키드나 바지에 탑재된 공장 생산형의 액화 플랜트는 파이프라인망이 드문드문 지역에서의 진입 장벽을 낮추고 있습니다. 베이커 퓨즈는 설치 면적을 줄이고 현장 작업 및 모듈 제조 중복을 가능하게 하는 항공 전용 터빈 트레인과 전기 모터 구동 장치의 수주가 증가하고 있음을 주목하고 있습니다. 인도네시아의 파일럿 프로그램은 원격지의 디젤 화력 발전소에 LNG를 공급함으로써 평준화 발전 비용을 55-60% 절감할 수 있음을 보여주었습니다. 모듈식 접근법은 플레어 가스의 수익화를 목표로 하는 아프리카 광산업자에게도 똑같이 매력적이며 디젤 수입에 비해 투자 회수 기간이 짧습니다.
사하라 이남의 아프리카에서 드문 ISO 탱크 백홀 물류
나이지리아의 150 tcf 확인 가스 매장량은 ISO 탱크 플릿이 가난한 도로망과 최소한의 양방향 무역 흐름에 직면하고 있기 때문에 아직 충분히 활용되지 못하고 있습니다. 리턴 카고의 부족으로 인해 사업자는 빈 컨테이너의 재배치를 강요하고 트립 당 비용이 증가하고 내륙 주 시장 경쟁력이 떨어지고 있습니다. 지역 에너지 기관은 LNG가 주택 및 소규모 상업 분야에서 바이오매스를 대체하기 위해 복합 운송 회랑과 조화된 세관 절차의 필요성을 강조합니다.
부문 분석
액화 터미널은 2024년 수익의 62.5%를 차지하며 파이프라인이 없는 곳에서 가스 수익화에 있어서 매우 중요한 역할을 반영했습니다. 소규모 LNG 시장 규모의 이 부분은 자본 비용과 에너지 효율의 균형을 이루는 단순화된 SMR 공정 트레인에 의해 지원됩니다. 미국만으로도 마이크로LNG의 생산능력을 닛산 230만갤런까지 끌어올릴 계획을 가지고 있습니다. 액화 설비가 차지하는 소규모 LNG 시장 점유율은 재기화 설비가 급속히 성장함에 따라 약간 하락할 것으로 예상되지만, 광산 및 지방 유틸리티의 새로운 비전화 수요를 고려하면 절대적인 처리량이 증가할 것으로 보입니다.
부체식 저장·재기화 유닛의 파도가 병행하여 밀려오고 있어 신흥 바이어의 수입 옵션이 재구축되고 있습니다. FSRU 시운전에 필요한 비용은 3억 달러, 시운전 기간은 1-3년으로, 육상 대체 시설을 훨씬 밑돌아 2030년까지의 CAGR은 14%를 나타낼 전망입니다. 얕은 선체와 연결식 태그 보트 등의 기술 혁신을 통해 이전에는 도달할 수 없었던 하천과 해안 근처의 정박지에 접근할 수 있습니다. 개발자들은 이러한 유닛을 파워바지 및 모듈식 결합 사이클 플랜트와 결합하여 아프리카, 남아시아, 카리브해 국가에서의 오프테이크를 증가시킬 수 있습니다.
도로를 이용한 배송은 파이프라인 그리드에서 벗어난 장소로의 배송 능력 덕분에 2024년 수익의 52.5%를 차지했습니다. 스타빌리스 솔루션즈사만으로도 4만 3,000대의 트럭으로 4억 2,000만 갤런 이상을 운송하고 있어 이 '가상 파이프라인' 모델의 회복력을 실증하고 있습니다. 비용 경쟁력은 모듈식 저온 펌프, 표준 ISO 탱크 인터페이스 및 턴어라운드 시간을 최적화하는 GPS 연동 플릿 스케줄링 툴에 기인합니다.
벙커링은 CAGR 14.5%로 가장 급격한 성장을 나타내며 LNG 듀얼 연료선을 우대하는 저황 해상 규칙이 뒷받침하고 있습니다. LNG는 현재 198 항구에서 사용할 수 있으며 벙커 선대는 56척의 전문선으로 구성되어 있습니다. 공급 체인은 항구 레이아웃 및 선박 일정에 따라 트럭에서 선박으로, 선박에서 선박으로, 파이프라인에서 선박으로 배송하는 방법을 점점 더 결합합니다.
소규모 LNG 시장 보고서는 유형별(액화 터미널, 재기화 터미널), 공급 형태별(트럭, 환적·벙커링, 파이프라인·철도, ISO 컨테이너), 용도별(운송, 발전, 기타), 최종 사용자별(유틸리티·IPP, 석유 및 가스 업스트림 사업자, 기타), 지역별(북미, 아프리카, 아시아·아시아)로 구분됩니다.
지역 분석
아시아태평양은 2024년 세계 수익의 47.5%를 창출했고 2030년까지 최고의 CAGR 16%를 유지할 것으로 예측됩니다. 이 지역의 수입 능력은 2022년 1,527만 톤/년부터 2025년에는 2,300만 톤/년이 될 것으로 예측됩니다. 중국은 2024년 78.64톤의 LNG를 수입하여 '푸른 회랑' 급유 노드를 적극적으로 전개했습니다. 인도네시아는 소규모 LNG가 고속 디젤을 최대 60% 미만으로 낮추고 수백 개의 섬 송전망으로 가는 길을 열어 이 모델을 뒷받침합니다.
유럽은 엄격한 탄소 규제와 러시아산 가스로부터의 다양화로 시장 가치의 약 25%를 차지했습니다. 이 대륙에는 28개의 대규모 수입 터미널과 8개의 소규모 시설이 있으며, 총 227bcm의 재가스 공급 능력은 2024년 수요의 40%에 해당합니다. 북유럽 클러스터는 해상 운송에서 최첨단 환경 입찰을 도입하고 있으며, 로테르담, 제브루헤, 클라이페다 등의 항구는 지역의 벙커링 네트워크를 지원합니다. EU의 가스 공급 전체에서 차지하는 LNG의 비율은 2021년 이후 2배 이상으로 증가하고 있어 유연한 이동식 터미널의 안정적인 베이스 로드가 되고 있습니다.
북미는 매출의 약 20%를 차지하고 미국은 기술 리더이자 최대 수출국입니다. 미국의 LNG 수출 능력은 2018년 이후 3배로 증가하고 2030년까지 허가된 프로젝트에서 거의 2배로 증가합니다. 이 지역의 소규모 LNG 시장은 셰일 가스의 풍부, 세금 공제, 트럭 및 철도 연료로서의 LNG 채용의 가속화에 힘입어 2018년 4억 9,900만 갤런에서 2030년에는 19억 갤런으로 상승했습니다. 캐나다와 멕시코 개발자들은 원격지 광산과 산업 단지를 연결하는 모듈식 플랜트를 모색하고 있습니다.
나머지 수요는 라틴아메리카, 중동 및 아프리카로 나뉩니다. 라틴아메리카의 성장 중심은 브라질, 칠레, 도미니카 공화국에서 부체식 수입 솔루션을 통해 LNG-전력 프로젝트를 신속하게 시작할 수 있습니다. 중동에서는 풍부한 가스 원료를 활용하여 주로 원격지에서의 유전 조업이나 섬의 관광 시설에 소규모 스케일 LNG를 사용하고 있습니다. 아프리카는 물류의 격차에 제약을 받고 가장 보편적이지 않은 지역이지만, 나이지리아와 모잠비크는 운송 병목 현상이 완화되면 상당한 업사이드가 예상됩니다.
기타 혜택 :
- 엑셀 형식 시장 예측(ME) 시트
- 3개월의 애널리스트 지원
목차
제1장 서론
- 조사 전제조건과 시장 정의
- 조사 범위
제2장 조사 방법
제3장 주요 요약
제4장 시장 상황
- 시장 개요
- 시장 성장 촉진요인
- IMO와 FuelEU의 해상 유황 상한 규제 강화가 해상 LNG 벙커링 도입을 가속(유럽)
- 원격지 채굴과 오프 그리드 발전을 위한 모듈식 액화 플랜트의 급속한 건설(아시아태평양)
- 중국의 「파랑의 회랑」계획에 있어서 대형 트럭의 LNG 변화
- 카리브해와 중미의 마이크로그리드의 LNG 전력으로 전환
- 소규모 LNG 미국 인플레이션 억제법에 있어서 설비에 대한 세제 우대 조치
- 북유럽의 LNG 버스·페리 보조금 제도가 벙커링 수요를 견인
- 시장 성장 억제요인
- 사하라 이남의 아프리카에서 드문 ISO 탱크 백홀 물류
- 0.05MTPA 이하 플랜트에서는 보일 오프와 재액화의 높은 비용
- 브라질에 있어서 이동식 액화 설비의 단편적인 허가 틀
- 러시아와 우크라이나의 분쟁이 스팟 LNG의 지정학적 리스크 프리미엄 증가
- 공급망 분석
- 규제 전망
- 기술 전망
- Porter's Five Forces
- 공급기업의 협상력
- 구매자의 협상력
- 신규 참가업체의 위협
- 대체품의 위협
- 경쟁 기업 간 경쟁 관계
제5장 시장 규모와 성장 예측
- 유형별
- 액화 터미널(소형, 초소형, 소규모)
- 재기화 터미널(육상 및 해상 FSRU)
- 공급 형태별
- 트럭
- 파이프라인 및 철도
- 환적 및 벙커링(선박 간 및 육상-선박 간)
- ISO 컨테이너
- 용도별
- 운송(도로 및 해상 벙커링)
- 산업용 원료
- 발전
- 기타 용도
- 최종 사용자별
- 전력회사 및 독립발전 사업자(IPP)
- 석유 및 가스 상류 사업자
- 제조업
- 상업 및 지자체
- 지역별
- 북미
- 미국
- 캐나다
- 멕시코
- 유럽
- 영국
- 독일
- 프랑스
- 스페인
- 북유럽 국가
- 러시아
- 기타 유럽
- 아시아태평양
- 중국
- 인도
- 일본
- 한국
- 말레이시아
- 태국
- 인도네시아
- 베트남
- 호주
- 기타 아시아태평양
- 남미
- 브라질
- 아르헨티나
- 콜롬비아
- 기타 남미
- 중동 및 아프리카
- 아랍에미리트(UAE)
- 사우디아라비아
- 카타르
- 이집트
- 남아프리카
- 기타 중동 및 아프리카
- 북미
제6장 경쟁 구도
- 시장 집중도
- 전략적 움직임(M&A, 파트너십, PPA)
- 시장 점유율 분석(주요 기업의 시장 순위/점유율)
- 기업 프로파일
- Linde plc
- Wartsila Oyj Abp
- Baker Hughes Co.
- Honeywell UOP
- Chart Industries Inc.
- Black & Veatch
- New Fortress Energy LLC
- Shell plc
- TotalEnergies SE
- Eni SpA
- PJSC Gazprom
- Novatek PJSC
- Gasum Oy
- Engie SA
- Anthony Veder Group NV
- Stolt-Nielsen Gas Ltd
- Eagle LNG Partners
- Guanghui Energy Co.
- Equinor ASA
- Pavilion Energy Pte Ltd
제7장 시장 기회와 향후 전망
KTH 25.11.21The Small-scale LNG Market size is estimated at USD 11.80 billion in 2025, and is expected to reach USD 19.34 billion by 2030, at a CAGR of 10.39% during the forecast period (2025-2030).
Demand is propelled by industrial and remote communities that are switching from oil and diesel to natural gas, while developers monetize stranded gas and deploy prefabricated plants that shorten construction schedules. Liquefaction technologies optimized for capacities below 1 MTPA, the widening use of LNG in heavy-duty transport, and regulatory incentives in major economies underpin robust capital formation. Competition is intensifying as global energy majors and agile specialists race to secure prime assets, form strategic alliances, and embed proprietary technology platforms across the value chain. Heightened geopolitical uncertainty and the pivot to short-term contracting have raised spot-price volatility, yet continued LNG adoption across power, marine, and trucking segments points to sustained growth opportunities.
Global Small-scale LNG Market Trends and Insights
Tightening IMO & FuelEU Maritime Sulphur Caps Accelerating Marine LNG Bunkering Adoption
New sulphur and greenhouse-gas limits set by the IMO and the FuelEU Maritime package are encouraging vessel operators to adopt LNG to avoid rising carbon compliance costs. The EU Emissions Trading System now prices CO2 from large ships calling at EU ports, and the FuelEU rule requires a 2% cut in carbon intensity by 2025, a target that LNG-fueled ships can meet through 2034 thanks to life-cycle emissions between 76.3-92.3 gCO2e/MJ. Global bunkering demand reached 12.9 million t in 2023, supported by a fleet of 56 LNG bunker vessels by end-2024. Shipowners are responding with record dual-fuel new-build orders and retrofits, driving investments in shore-side loading arms, cryogenic hoses, and safety protocols across European ports.
Rapid Build-Out of Modular Liquefaction Plants for Remote Mining & Off-Grid Power
Factory-fabricated liquefiers mounted on skids or barges are lowering entry barriers in regions where pipeline grids are sparse. Baker Hughes notes rising orders for aeroderivative turbine trains and electric-motor drives that shrink footprints and allow site work to overlap with module fabrication. Indonesia's pilot program showed that supplying remote diesel-fired power plants with LNG can cut levelized generation costs by 55-60% and still yield delivered prices of 10.35-11.28 USD/MMBtu. The modular approach is equally attractive to African miners seeking to monetize flare gas, yielding shorter payback horizons relative to diesel imports.
Sparse ISO-Tank Back-Haul Logistics in Sub-Saharan Africa
Nigeria's 150 tcf of proven gas reserves remain underutilized as ISO-tank fleets face poor road links and minimal two-way trade flows. A lack of return cargo forces operators to reposition empty containers, inflating per-trip costs and eroding the competitiveness of the small-scale LNG market in landlocked states. Regional energy agencies highlight the need for multimodal corridors and harmonized customs procedures before LNG can displace biomass in residential and small commercial segments.
Other drivers and restraints analyzed in the detailed report include:
- Heavy-Duty Truck Fleet Shift to LNG in China's "Blue Corridor" Program
- Caribbean & Central-American Micro-Grid Conversions to LNG-to-Power
- High Boil-Off & Re-Liquefaction Costs Below 0.05 MTPA Plants
For complete list of drivers and restraints, kindly check the Table Of Contents.
Segment Analysis
Liquefaction terminals generated 62.5% of 2024 revenue, reflecting their pivotal role in gas monetization where pipelines are absent. This portion of the small-scale LNG market size is supported by simplified SMR process trains that balance capital cost and energy efficiency. Developers in the United States alone plan to lift combined micro-LNG capacity to 2.3 million gallons per day. The small-scale LNG market share held by liquefaction facilities is expected to decline slightly as regasification assets grow faster, yet absolute throughput will rise given new off-grid demand from mines and rural utilities.
A parallel wave of floating storage and regasification units is reshaping import options for emerging buyers. FSRUs require USD 300 million and 1-3 years to commission, far below onshore alternatives, and are forecast to post a 14% CAGR through 2030. Innovations such as shallow-draft hulls and articulated tug barges allow access to rivers and near-shore anchorages once deemed unreachable. Developers pair these units with power barges or modular combined-cycle plants, unlocking incremental offtake in Africa, South Asia, and the Caribbean.
Road-based delivery held 52.5% of 2024 revenue thanks to its ability to reach sites beyond pipeline grids. Stabilis Solutions alone has moved more than 420 million gallons via 43,000 truckloads, demonstrating the resilience of this "virtual pipeline" model. Cost competitiveness stems from modular cryogenic pumps, standard ISO-tank interfaces, and GPS-linked fleet scheduling tools that optimize turnaround times.
Bunkering exhibits the sharpest growth at a 14.5% CAGR, propelled by low-sulphur marine rules that favor LNG-dual-fuel ships. LNG is now available in 198 ports, and the bunker fleet stands at 56 specialized vessels-both numbers are poised to multiply as more than 1,200 LNG-capable ships could sail by 2028. Supply chains increasingly blend truck-to-ship, ship-to-ship, and pipeline-to-ship delivery methods to match port layouts and vessel schedules.
The Small-Scale LNG Market Report is Segmented by Type (Liquefaction Terminal and Regasification Terminal), Mode of Supply (Truck, Transshipment and Bunkering, Pipeline and Rail, and ISO Container), Application (Transportation, Power Generation, and Others), End-User (Utilities and IPPs, Oil and Gas Upstream Operators, and Others), and Geography (North America, Europe, Asia-Pacific, South America, and Middle East and Africa).
Geography Analysis
Asia-Pacific generated 47.5% of global revenue in 2024 and is forecast to maintain the highest 16% CAGR through 2030. Regional import capacity rose from 15.27 mtpa in 2022 to an expected 23 mtpa by 2025. China remains the linchpin, importing 78.64 MT of LNG in 2024, while aggressively rolling out "Blue Corridor" refueling nodes. Indonesia corroborates the model by demonstrating that small-scale LNG can undercut high-speed diesel by up to 60%, opening avenues for hundreds of island grids.
Europe accounted for roughly 25% of market value, driven by stringent carbon rules and diversification from Russian gas. The continent hosts 28 large-scale import terminals and 8 small-scale facilities totaling 227 bcm of regas capacity, equivalent to 40% of 2024 demand. The Nordic cluster deploys the most advanced environmental tendering in maritime transport, and ports such as Rotterdam, Zeebrugge, and Klaipeda anchor regional bunkering networks. The EU's share of LNG in overall gas supply has more than doubled since 2021, translating into stable base-load for flexible mobile terminals.
North America contributed roughly 20% of revenue, with the United States as the technology leader and largest exporter. US LNG export capacity has tripled since 2018 and will nearly double again by 2030 on sanctioned projects. The local small-scale LNG market climbed from 499 million gallons in 2018 toward 1.9 billion gallons by 2030, propelled by shale gas abundance, tax credits, and accelerating adoption of LNG as truck and rail fuel. Canadian and Mexican developers also explore modular plants to connect remote mines and industrial parks.
The remainder of demand is split among Latin America, the Middle East, and Africa. Latin America's growth centers on Brazil, Chile, and the Dominican Republic, where floating import solutions allow fast ramp-up of LNG-to-power projects. The Middle East uses small-scale LNG mainly for remote oilfield operations and island tourism complexes, leveraging abundant gas feedstock. Africa remains the least penetrated region, constrained by logistics gaps, yet Nigeria and Mozambique present sizable upside if transport bottlenecks ease.
- Linde plc
- Wartsila Oyj Abp
- Baker Hughes Co.
- Honeywell UOP
- Chart Industries Inc.
- Black & Veatch
- New Fortress Energy LLC
- Shell plc
- TotalEnergies SE
- Eni SpA
- PJSC Gazprom
- Novatek PJSC
- Gasum Oy
- Engie SA
- Anthony Veder Group NV
- Stolt-Nielsen Gas Ltd
- Eagle LNG Partners
- Guanghui Energy Co.
- Equinor ASA
- Pavilion Energy Pte Ltd
Additional Benefits:
- The market estimate (ME) sheet in Excel format
- 3 months of analyst support
TABLE OF CONTENTS
1 Introduction
- 1.1 Study Assumptions & Market Definition
- 1.2 Scope of the Study
2 Research Methodology
3 Executive Summary
4 Market Landscape
- 4.1 Market Overview
- 4.2 Market Drivers
- 4.2.1 Tightening IMO & FuelEU Maritime Sulphur Caps Accelerating Marine LNG Bunkering Adoption (Europe)
- 4.2.2 Rapid Build-out of Modular Liquefaction Plants for Remote Mining & Off-Grid Power (Asia-Pacific)
- 4.2.3 Heavy-Duty Truck Fleet Shift to LNG in China's "Blue Corridor" Program
- 4.2.4 Caribbean & Central-American Micro-grid Conversions to LNG-to-Power
- 4.2.5 Tax Incentives for Small-Scale LNG Equipment under US Inflation Reduction Act
- 4.2.6 Nordic LNG Bus & Ferry Subsidy Schemes Driving Demand for Bunkering
- 4.3 Market Restraints
- 4.3.1 Sparse ISO-Tank Back-haul Logistics in Sub-Saharan Africa
- 4.3.2 High Boil-Off & Re-liquefaction Costs Below 0.05 MTPA Plants
- 4.3.3 Fragmented Permitting Framework for Mobile Liquefiers in Brazil
- 4.3.4 Russia-Ukraine Conflict Raising Geopolitical Risk Premium on Spot LNG
- 4.4 Supply-Chain Analysis
- 4.5 Regulatory Outlook
- 4.6 Technological Outlook
- 4.7 Porter's Five Forces
- 4.7.1 Bargaining Power of Suppliers
- 4.7.2 Bargaining Power of Buyers
- 4.7.3 Threat of New Entrants
- 4.7.4 Threat of Substitutes
- 4.7.5 Intensity of Competitive Rivalry
5 Market Size & Growth Forecasts
- 5.1 By Type
- 5.1.1 Liquefaction Terminal (Micro, Mini, and Small)
- 5.1.2 Regasification Terminal (Onshore and Offshore FSRU)
- 5.2 By Mode of Supply
- 5.2.1 Truck
- 5.2.2 Pipeline and Rail
- 5.2.3 Transshipment and Bunkering (Ship-to-ship and Shore-to-ship)
- 5.2.4 ISO Container
- 5.3 By Application
- 5.3.1 Transportation (Road and Marine Bunkering)
- 5.3.2 Industrial Feedstock
- 5.3.3 Power Generation
- 5.3.4 Other Applications
- 5.4 By End-User
- 5.4.1 Utilities and Independent Power Producers (IPPs)
- 5.4.2 Oil nd Gas Upstream Operators
- 5.4.3 Manufacturing Industries
- 5.4.4 Commercial and Municipal
- 5.5 By Geography
- 5.5.1 North America
- 5.5.1.1 United States
- 5.5.1.2 Canada
- 5.5.1.3 Mexico
- 5.5.2 Europe
- 5.5.2.1 United Kingdom
- 5.5.2.2 Germany
- 5.5.2.3 France
- 5.5.2.4 Spain
- 5.5.2.5 Nordic Countries
- 5.5.2.6 Russia
- 5.5.2.7 Rest of Europe
- 5.5.3 Asia-Pacific
- 5.5.3.1 China
- 5.5.3.2 India
- 5.5.3.3 Japan
- 5.5.3.4 South Korea
- 5.5.3.5 Malaysia
- 5.5.3.6 Thailand
- 5.5.3.7 Indonesia
- 5.5.3.8 Vietnam
- 5.5.3.9 Australia
- 5.5.3.10 Rest of Asia-Pacific
- 5.5.4 South America
- 5.5.4.1 Brazil
- 5.5.4.2 Argentina
- 5.5.4.3 Colombia
- 5.5.4.4 Rest of South America
- 5.5.5 Middle East and Africa
- 5.5.5.1 United Arab Emirates
- 5.5.5.2 Saudi Arabia
- 5.5.5.3 Qatar
- 5.5.5.4 Egypt
- 5.5.5.5 South Africa
- 5.5.5.6 Rest of Middle East and Africa
- 5.5.1 North America
6 Competitive Landscape
- 6.1 Market Concentration
- 6.2 Strategic Moves (M&A, Partnerships, PPAs)
- 6.3 Market Share Analysis (Market Rank/Share for key companies)
- 6.4 Company Profiles (includes Global level Overview, Market level overview, Core Segments, Financials as available, Strategic Information, Products & Services, and Recent Developments)
- 6.4.1 Linde plc
- 6.4.2 Wartsila Oyj Abp
- 6.4.3 Baker Hughes Co.
- 6.4.4 Honeywell UOP
- 6.4.5 Chart Industries Inc.
- 6.4.6 Black & Veatch
- 6.4.7 New Fortress Energy LLC
- 6.4.8 Shell plc
- 6.4.9 TotalEnergies SE
- 6.4.10 Eni SpA
- 6.4.11 PJSC Gazprom
- 6.4.12 Novatek PJSC
- 6.4.13 Gasum Oy
- 6.4.14 Engie SA
- 6.4.15 Anthony Veder Group NV
- 6.4.16 Stolt-Nielsen Gas Ltd
- 6.4.17 Eagle LNG Partners
- 6.4.18 Guanghui Energy Co.
- 6.4.19 Equinor ASA
- 6.4.20 Pavilion Energy Pte Ltd
7 Market Opportunities & Future Outlook
- 7.1 White-Space & Unmet-Need Assessment


