


|
시장보고서
상품코드
1851596
흑연 : 시장 점유율 분석, 산업 동향, 통계, 성장 예측(2025-2030년)Graphite - Market Share Analysis, Industry Trends & Statistics, Growth Forecasts (2025 - 2030) |
||||||
흑연 시장 규모는 2025년에 57억 3,000만 달러로 추정되며 예측 기간(2025-2030년)의 CAGR은 9.89%로, 2030년에는 91억 9,000만 달러에 달할 것으로 예상됩니다.

왕성한 배터리 수요, 철강 제조의 구조 전환, 중요 소재공급망을 현지화하는 노력의 강화가 이 궤도를 총체적으로 지원하고 있습니다. 흑연 산업은 벌크 상품 부문에서 이동성, 전력 및 중산업의 탈탄소화를 지원하는 전략적 재료 분야로의 결정적인 전환을 경험하고 있습니다. 아시아태평양의 천연 자원 집중, 북미와 유럽의 정책적인센티브는 채굴, 가공 및 재활용 자산에 대한 새로운 투자를 촉진하고 있습니다. 동시에 자본 비용 상승과 환경 규제 강화가 책임있는 조달을 보장하면서 위험을 분산시키는 합작 투자를 뒷받침하고 있습니다. 새로운 추론으로는 계약 형태가 장기화되어 현재는 10년 이상에 걸친 오프 테이크 계약이 정기적으로 연결되어 있는 것을 들 수 있습니다.
세계의 흑연 시장 동향과 인사이트
리튬 이온 배터리 산업 수요 증가
현재 흑연 시장 점유율은 배터리 제조업체가 가장 크고, 이 부문의 CAGR은 17% 이상으로 10년 내내 지속적으로 가속한다는 것을 보여주고 있습니다. 전기자동차(EV) 브랜드 간 가격 경쟁의 격화는 애노드의 비용 감응도를 높이고 합성 대체품보다 톤당 수천 달러의 우위를 제공하는 천연 흑연에 대한 선호를 기울이고 있습니다. 합성품의 제조에는 3,000℃의 온도가 필요한 반면, 천연품의 정제는 통상 1,800℃ 이하에서 행해지기 때문입니다. 최근의 입찰 데이터로부터 읽을 수 있는 추론으로서는 자동차 제조업체 각사가, 천연 소재의 ESG 프로파일의 향상과 대용해, 퍼스트 사이클 효율의 약간의 저하를 용인하고 있는 것을 들 수 있습니다.
아시아와 중동에서 철강 생산 증가
배출 감축을 목적으로 하는 전기 아크로(EAF)로의 이동은 초고출력 흑연 전극 수요를 크게 끌어올리고 있습니다. 기계와 자동차 용도가 철강 소비량의 큰 비율을 차지하게 되어, 전극의 내구성과 전도성의 요구가 암묵적으로 높아지고 있습니다. 전극의 순도, 탭 투 탭 시간, 노 전체 에너지 효율과 직접적인 관련이 있기 때문에 전극 공급업체는 황과 질소 함량이 낮음을 증명하고 프리미엄 가격을 실현할 수 있습니다.
엄격한 환경 규제
탄소 가격 규제와 Scope-3 공개의 틀은 생산자에게 재생 가능 전력의 채용을 촉구하고 미국 에너지부가 개발한 저온 촉매 흑연을 시험적으로 도입하도록 촉구하고 있습니다.
부문 분석
천연 흑연은 2024년에는 합성 흑연이 시장의 58.09%를 차지했으며, 현재 우세함에도 불구하고 급속히 점유율을 확대하고 있습니다. 마이크로파 가열과 결합한 가성 베이킹과 같은 신선한 정제 공정은 현재 99.95%의 순도를 제공하여 과거의 성능 차이를 줄이고 있습니다. 명확한 추론은 현재 OEM의 구매 대시보드에 게시된 수명 주기 평가 데이터가 직접 셀 수준의 에너지 밀도가 약간 낮더라도 조달 정책을 천연 흑연으로 기울이고 있다는 것입니다.
바이오매스 유래의 합성 흑연은 채굴된 천연 흑연과 석유 니들 코크스에 대한 의존성을 줄일 수 있기 때문에 공급 안전성에 대한 우려가 높아지고 있습니다. 파일럿 연구에서 리그닌계 전구체로부터 리튬의 삽입에 적합한 층간 간격을 갖는 터보스트라틱 카본을 얻을 수 있다는 것이 확인되었습니다. 새로운 추론으로 천연 플레이크와 바이오 흑연의 이중 조달 전략은 지정 혼란과 탄소 가격 상승에 대한 매력적인 헤지로 부상하고 있습니다.
지역 분석
아시아태평양의 흑연 시장 점유율은 현재 55.42%로, CAGR은 11% 이상으로 가장 빠릅니다. 중국의 이점은 플레이크 그라파이트 광산, 정제 라인, 구상화 플랜트를 단일 물류 통로로 통합한 클러스터에 기인합니다. 인도네시아와 말레이시아와 같은 ASEAN 국가들은 중국의 클러스터 모델을 모방하고 밸류체인의 대체 노드를 만들 것을 기대하고 중류 가산업자를 유치하고 있다는 것이 새로운 추론입니다.
북미는 수입에 의존하는 소비자 기반에서 신흥 생산자 기반으로 전환하고 있는데, 이는 인플레이션 감소법의 세액 공제(적격 양극 부품 비용의 10%를 환불)에 의해 도움이 되고 있습니다. 유럽의 흑연 산업은 자원 공급보다는 규제 리더십에 의해 형성됩니다. 배터리의 재활용 함량에 대한 최소 기준치의 의무화로 인해 기가팩토리는 재활용 업체와 수년간 공급 계약을 체결하게 됩니다.
기타 혜택 :
- 엑셀 형식 시장 예측(ME) 시트
- 3개월간의 애널리스트 지원
목차
제1장 서론
- 조사 전제조건과 시장 정의
- 조사 범위
제2장 조사 방법
제3장 주요 요약
제4장 시장 상황
- 시장 개요
- 시장 성장 촉진요인
- 리튬 이온 배터리 산업 수요 증가
- 아시아와 중동에서 철강 생산 증가
- 흑연 자연순환형 사회에 대한 대처 증가
- 일렉트로닉스 산업에 있어서 전도성 흑연 수요 증가
- 항공우주 및 방위산업에서의 수요 증가
- 시장 성장 억제요인
- 엄격한 환경 규제
- 고품질 천연 흑연의 한정된 공급
- 원재료 가격 변동
- 밸류체인 분석
- 규제와 환경의 전망
- Porter's Five Forces 분석
- 공급기업의 협상력
- 구매자의 협상력
- 신규 참가업체의 위협
- 대체품의 위협
- 경쟁도
제5장 시장 규모와 성장 예측
- 유형별
- 천연 흑연
- 합성 흑연
- 용도별
- 전극
- 내화물, 주조 및 주물
- 배터리
- 윤활유
- 기타 용도(방열재료, 마찰재, 브레이크 라이닝 등)
- 최종 사용자 업계별
- 야금
- 전자부품
- 자동차
- 기타 산업(에너지, 항공우주 및 방위 등)
- 지역별
- 아시아태평양
- 중국
- 인도
- 일본
- 한국
- 기타 아시아태평양
- 북미
- 미국
- 캐나다
- 멕시코
- 유럽
- 독일
- 영국
- 프랑스
- 이탈리아
- 러시아
- 기타 유럽
- 남미
- 브라질
- 아르헨티나
- 기타 남미
- 중동 및 아프리카
- 사우디아라비아
- 남아프리카
- 기타 중동 및 아프리카
- 아시아태평양
제6장 경쟁 구도
- 시장 집중도
- 전략적 동향
- 시장 점유율(%)/랭킹 분석
- 기업 프로파일
- Asbury Carbons
- BTR New Material Group Co., Ltd.
- GrafTech International
- Graphit Kropfmuhl GmbH
- Imerys
- Mason Resources Inc.
- Mersen
- Nippon Kokuen Group
- Northern Graphite
- POCO
- Resonac Holdings Corporation
- SGL Carbon
- Shanghai Shanshan Technology Co., Ltd.
- Syrah Resources Limited
- Tokai Carbon Co., Ltd.
- Triton Minerals Limited
제7장 시장 기회와 향후 전망
KTH 25.11.24The Graphite Market size is estimated at USD 5.73 billion in 2025, and is expected to reach USD 9.19 billion by 2030, at a CAGR of 9.89% during the forecast period (2025-2030).
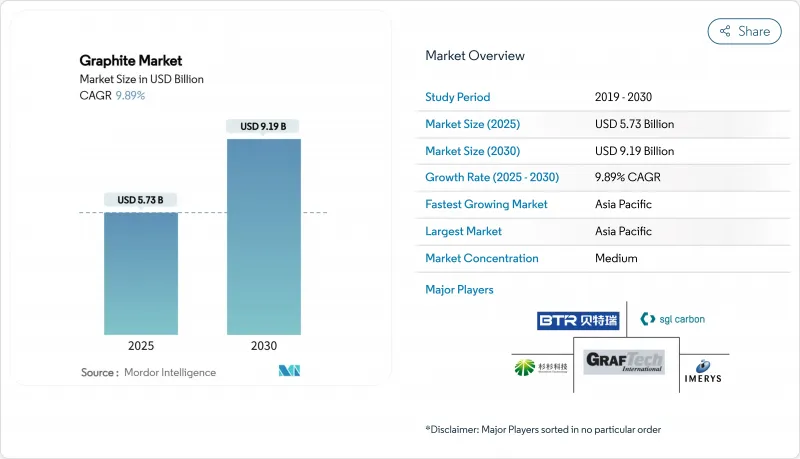
Robust battery demand, structural shifts in steelmaking, and intensifying efforts to localize critical-material supply chains collectively underpin this trajectory. The graphite industry is experiencing a decisive shift from a bulk commodity sector to a strategic materials arena supporting decarbonization across mobility, power, and heavy industry. Natural-resource concentration in Asia-Pacific and policy incentives in North America and Europe are catalyzing new investment in mining, processing, and recycling assets. Simultaneously, the rising cost of capital and stricter environmental scrutiny are encouraging joint ventures that spread risk while ensuring responsible sourcing. A fresh inference that emerges is that contract structures are lengthening off-take agreements now regularly span 10-plus years, signaling buyers' willingness to lock in feedstock security even at higher prices.
Global Graphite Market Trends and Insights
Augmenting Demand from the Lithium-ion Battery Industry
Battery manufacturers now account for the single largest slice of the graphite market share, and the segment's 17%-plus CAGR indicates sustained acceleration through the decade. Intensifying price competition among electric-vehicle (EV) brands magnifies the cost sensitivity of anodes, tilting preference toward natural graphite that offers a multithousand-dollar per-tonne advantage over synthetic alternatives. This cost gradient is widening as energy prices rise, because synthetic production requires temperatures of 3,000 °C, whereas natural purification usually runs below 1,800 °C. One inference observable from recent tender data is that automakers are accepting slightly lower first-cycle efficiency in exchange for natural graphite's better ESG profile, illustrating how carbon-footprint metrics have become commercially material.
Increase in Steel Production in Asia and the Middle East
The shift toward electric-arc furnaces (EAF) for emissions abatement is materially lifting demand for ultra-high-power graphite electrodes. Machinery and automotive applications now drive a larger share of steel consumption, implicitly elevating electrode durability and conductivity requirements. A fresh inference is that electrode suppliers can certify lower sulfur and nitrogen contents, secure premium price realizations because EAF operators see a direct link between electrode purity, tap-to-tap time, and overall furnace energy efficiency.
Stringent Environmental Regulations
Carbon-pricing regimes and Scope-3 disclosure frameworks are prompting producers to adopt renewable power and to pilot low-temperature catalytic graphitization developed by the U.S. Department of Energy, which halves energy use and compresses production cycles from weeks to hours.
Other drivers and restraints analyzed in the detailed report include:
- Increase in Natural Graphite Recycling Initiatives
- Growing Demand from the Electronics Industry
- Limited Availability of High-Quality Natural Graphite
For complete list of drivers and restraints, kindly check the Table Of Contents.
Segment Analysis
Natural graphite is rapidly gaining market share despite synthetic graphite's current dominance at 58.09% of the market in 2024. Fresh purification processes such as caustic baking combined with microwave heating now deliver 99.95% purity, closing the historical performance gap. A clear inference is that life-cycle-assessment data, which now feature in OEM purchasing dashboards, are tipping procurement policies in favor of natural graphite even when immediate cell-level energy density is marginally lower.
Supply-security concerns amplify interest in biomass-derived synthetic graphite, which could reduce dependence on mined natural graphite and petroleum needle-coke routes. Pilot studies confirm that lignin-based precursors yield turbostratic carbon with an interlayer spacing conducive to lithium intercalation. The fresh inference is that dual-sourcing strategies, natural flake plus bio-graphite, are surfacing as an attractive hedge against geopolitical disruption and carbon-price escalation.
The Graphite Market Report Segments the Industry by Type (Natural Graphite and Synthetic Graphite), Application (Electrodes, Refractories, Casting, and Foundries, Batteries, Lubricants, and Other Applications), End-User Industry (Metallurgy, Electronic, Automotive, and Other End-User Industries), and Geography (Asia-Pacific, North America, Europe, South America, and Middle-East and Africa).
Geography Analysis
Asia-Pacific currently captures 55.42% graphite market share and registers the fastest regional CAGR at above 11%. China's dominance stems from integrated clusters that combine flake-graphite mines, purification lines, and spheronization plants into a single logistics corridor. A fresh inference is that ASEAN nations such as Indonesia and Malaysia are courting mid-stream processors, hoping to replicate China's cluster model and thus create alternative nodes in the value chain.
North America is transitioning from an import-dependent consumer base to an emerging producer, helped by the Inflation Reduction Act's tax credits that reimburse 10% of qualified anode-component costs. Europe's graphite industry is shaped by regulatory leadership rather than resource endowment. Mandatory minimum recycled-content thresholds in batteries are pushing gigafactories to sign multi-year supply contracts with recyclers.
- Asbury Carbons
- BTR New Material Group Co., Ltd.
- GrafTech International
- Graphit Kropfmuhl GmbH
- Imerys
- Mason Resources Inc.
- Mersen
- Nippon Kokuen Group
- Northern Graphite
- POCO
- Resonac Holdings Corporation
- SGL Carbon
- Shanghai Shanshan Technology Co., Ltd.
- Syrah Resources Limited
- Tokai Carbon Co., Ltd.
- Triton Minerals Limited
Additional Benefits:
- The market estimate (ME) sheet in Excel format
- 3 months of analyst support
TABLE OF CONTENTS
1 Introduction
- 1.1 Study Assumptions and Market Definition
- 1.2 Scope of the Study
2 Research Methodology
3 Executive Summary
4 Market Landscape
- 4.1 Market Overview
- 4.2 Market Drivers
- 4.2.1 Augmenting Demand from the Lithium-ion Battery Industry
- 4.2.2 Increase in Steel Production in Asia and the Middle East
- 4.2.3 Increase in Natural Graphite Recycling Initiatives
- 4.2.4 Growing Demand for Conductive Graphite from Electronics Industry
- 4.2.5 Increasing Demand from Aerospace and Defense Industry
- 4.3 Market Restraints
- 4.3.1 Stringent Environmental Regulations
- 4.3.2 Limited Availability of High-Quality Natural Graphite
- 4.3.3 Fluctuation in Raw Material Prices
- 4.4 Value Chain Analysis
- 4.5 Regulatory and Environmental Outlook
- 4.6 Porter's Five Forces Analysis
- 4.6.1 Bargaining Power of Suppliers
- 4.6.2 Bargaining Power of Buyers
- 4.6.3 Threat of New Entrants
- 4.6.4 Threat of Substitute Products and Services
- 4.6.5 Degree of Competition
5 Market Size and Growth Forecasts (Value and Volume)
- 5.1 By Type
- 5.1.1 Natural Graphite
- 5.1.2 Synthetic Graphite
- 5.2 By Application
- 5.2.1 Electrodes
- 5.2.2 Refractories, Casting and Foundries
- 5.2.3 Batteries
- 5.2.4 Lubricants
- 5.2.5 Other Applications (Thermal Management Materials, Friction Products and Brake Linings,etc.)
- 5.3 By End-user Industry
- 5.3.1 Metallurgy
- 5.3.2 Electronic
- 5.3.3 Automotive
- 5.3.4 Other Industries (Energy, Aerospace and Defence, etc.)
- 5.4 By Geography
- 5.4.1 Asia-Pacific
- 5.4.1.1 China
- 5.4.1.2 India
- 5.4.1.3 Japan
- 5.4.1.4 South Korea
- 5.4.1.5 Rest of Asia-Pacific
- 5.4.2 North America
- 5.4.2.1 United States
- 5.4.2.2 Canada
- 5.4.2.3 Mexico
- 5.4.3 Europe
- 5.4.3.1 Germany
- 5.4.3.2 United Kingdom
- 5.4.3.3 France
- 5.4.3.4 Italy
- 5.4.3.5 Russia
- 5.4.3.6 Rest of Europe
- 5.4.4 South America
- 5.4.4.1 Brazil
- 5.4.4.2 Argentina
- 5.4.4.3 Rest of South America
- 5.4.5 Middle-East and Africa
- 5.4.5.1 Saudi Arabia
- 5.4.5.2 South Africa
- 5.4.5.3 Rest of Middle-East and Africa
- 5.4.1 Asia-Pacific
6 Competitive Landscape
- 6.1 Market Concentration
- 6.2 Strategic Moves
- 6.3 Market Share(%)/Ranking Analysis
- 6.4 Company Profiles (includes Global level Overview, Market level overview, Core Segments, Financials as available, Strategic Information, Market Rank/Share for key companies, Products and Services, and Recent Developments)
- 6.4.1 Asbury Carbons
- 6.4.2 BTR New Material Group Co., Ltd.
- 6.4.3 GrafTech International
- 6.4.4 Graphit Kropfmuhl GmbH
- 6.4.5 Imerys
- 6.4.6 Mason Resources Inc.
- 6.4.7 Mersen
- 6.4.8 Nippon Kokuen Group
- 6.4.9 Northern Graphite
- 6.4.10 POCO
- 6.4.11 Resonac Holdings Corporation
- 6.4.12 SGL Carbon
- 6.4.13 Shanghai Shanshan Technology Co., Ltd.
- 6.4.14 Syrah Resources Limited
- 6.4.15 Tokai Carbon Co., Ltd.
- 6.4.16 Triton Minerals Limited
7 Market Opportunities and Future Outlook
- 7.1 White-space and Unmet-Need Assessment
- 7.2 Increasing Applications of Graphite in Green Technologies
- 7.3 Increasing Graphene Demand and Nuclear Energy
