


|
시장보고서
상품코드
1851604
산업용 배터리 : 시장 점유율 분석, 산업 동향, 통계, 성장 예측(2025-2030년)Industrial Battery - Market Share Analysis, Industry Trends & Statistics, Growth Forecasts (2025 - 2030) |
||||||
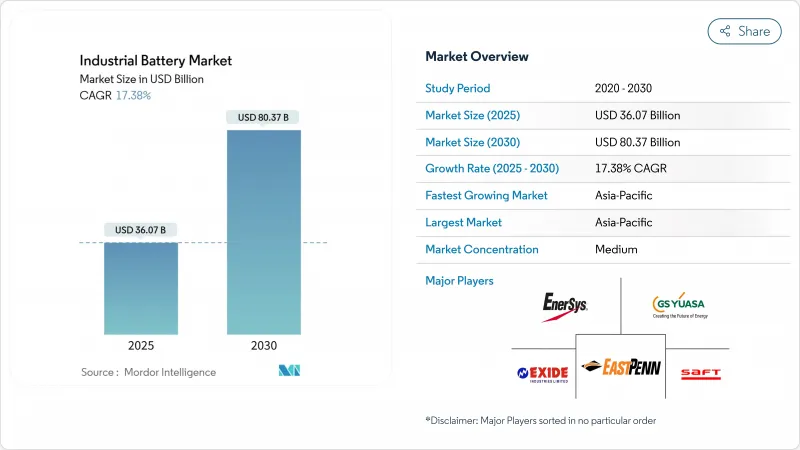
산업용 배터리 시장 규모는 2025년에 360억 7,000만 달러로 추정되고, 2030년에는 803억 7,000만 달러에 이를 것으로 예상되며, 예측 기간(2025-2030년)의 CAGR은 17.38%를 나타낼 전망입니다.
리튬 이온 가격 하락, 그리드 규모의 스토리지 프로젝트 확대, 창고 자동화를 위한 움직임은 배터리를 에너지 전환의 과제에 필수적인 인프라로 자리잡고 있습니다. 미국과 유럽에서는 정책 지원이 강화되어 새로운 제조 능력에 박차를 가하는 한편, 아시아태평양에서는 통합 공급망을 활용하여 비용 리더십을 유지합니다. 선도적인 셀 제조업체는 가와카미에서는 원료로, 강하에서는 시스템 통합으로 전환하고 있으며, 통합은 가속화되고 있습니다. 동시에 2차 양털 모델, 마이크로그리드 전개, 나트륨 이온 대체품의 등장으로 대응 가능한 용도가 확대되어 산업용 배터리 시장의 장기적인 수요를 지원하고 있습니다.
세계의 산업용 배터리 시장 동향과 인사이트
감소하는 리튬 이온 배터리의 비용 곡선
리튬 이온 팩의 평균 가격은 2010년에서 2024년 사이에 89% 하락하여 139달러/kWh가 되었습니다. 세계의 명판 용량은 2020년 95GWh에서 2024년 1,200GWh 이상으로 증가하여 중국의 규모 혜택과 공장 가동률 향상을 촉진하고 있습니다. LG에너지솔루션의 애리조나 복합공장은 2025년부터 연간 생산량을 43GWh 늘리고, 생산비용은 북미 평균을 25% 낮추는 것을 목표로 하고 있습니다. 가격 하락은 설치 기반을 확대하고 설비 투자를 옥스로 전환하고 고객의 도입 위험을 줄이는 배터리 아즈 어 서비스 모델을 가능하게합니다. 가격 하락과 수량 증가의 선순환은 산업용 배터리 시장에서 리튬 이온의 리더십을 확고하게 하는 동시에 10년 후의 나트륨 이온과 솔리드 스테이트의 대량 도입에 대한 길을 열 것으로 예측됩니다.
신재생에너지에 의한 ESS 구축
재생가능에너지 보급률이 30% 이상의 가운데 전력회사가 네트워크를 안정시키기 위해 축전지를 통합하기 때문에 2024년에는 세계 그리드 규모의 축전지 증설은 15GW에 달했습니다. 캘리포니아 주에서도 4.6GWh 상당의 프로젝트가 급피치로 진행되고 있으며, 퀸즐랜드에서는 재생에너지 50%의 목표를 지원하기 위해 300-500MWh의 시스템을 여러 위탁하고 있습니다. 유틸리티 영역을 넘어 산업용 마이크로그리드는 옥상 태양광 발전과 현장 배터리를 결합하여 수요 충전을 줄이고 전력 연속성을 보장합니다. 비용 절감, 모듈형 아키텍처 및 간소화된 조달 프레임워크를 통해 배터리는 주파수 제어 및 용량 준비를 위한 가장 저렴한 솔루션이 되어 산업용 배터리 시장에 구조적인 돌풍을 제공합니다.
중요 광물의 가격 변동
탄산리튬 가격은 2020년부터 2022년에 걸쳐 1,000% 급등한 후, 2024년에는 80% 하락해, 조달 전략과 마진 계획을 혼란시켰습니다. 코발트와 니켈은 또한 콩고 민주 공화국과 인도네시아에서의 지정학적 긴장과 수출 규제에 의해 비슷한 변화를 보이고 있습니다. 미네랄은 리튬 이온 시스템 비용의 최대 50%를 차지하기 때문에 변동은 총 소유 비용 예측에 큰 변동을 초래합니다. 제조업체는 다년간의 인수 계약, 다양한 원료 및 재활용 프로그램을 통해 헤지하고 있지만 중소기업은 균형 시트 압박에 직면하고 있습니다. 나트륨 이온과 철 기반 화학물질의 동향은 그 기술을 가격 충격에 대한 완충재로 자리매김하고, 산업용 배터리 시장의 변동 위험을 완화시키는 상쇄 경향을 낳고 있습니다.
부문 분석
리튬 이온은 2024년에 산업용 배터리 시장 점유율의 51%를 차지해 10년간에 89%의 비용 저하와 우수한 왕복 효율에 지지되었습니다. LFP 제형이 6,000사이클 후에 95%의 용량 유지율을 실현하고, 평생 보유 비용을 1kWh당 0.08달러 이하로 밀어 올리기 때문에 이 분야는 2030년까지 연평균 복합 성장률(CAGR) 18%를 나타낼 것으로 예측되고 있습니다. 나트륨 이온은 CATL의 2024년 발매로 상업 규모에 들어가 재료 비용이 30% 저하되어 거치형 축전지로서 경쟁력을 가지고 있습니다. 플로우 배터리는 8시간 이상의 방전이 필요한 용도로 비계를 굳히고 있습니다. 중국의 100MW/400MWh 바나듐 산화환원 플랜트는 20년의 서비스 수명을 보여줍니다. 니켈 카드뮴과 니켈 수소는 특히 원격지 유전과 같은 -40°C - 70°C 작동이 필수적인 가혹한 환경 틈새에 공급됩니다. 2027년 이후에는 에너지 밀도를 50% 향상시킨 솔리드 스테이트 프로토타입의 파일럿 생산이 예정되어 있어 세계 자동차 제조업체가 공동으로 생산 인정 라인을 지원합니다.
리튬 이온 시스템의 산업용 배터리 시장 규모는 2025년 184억 달러에서 2030년 476억 달러로 확대될 것으로 예측됩니다. 지속적인 스케일 업은 GWh 당 자본 집약도를 낮추고 수직 통합을 촉진하며 전통적인 화학 물질과의 성능 격차를 확대합니다. 동시에 고망간 양극, 실리콘 음극, 고전압 전해질에 관한 기술 혁신은 단가를 더욱 낮추고 리튬 이온의 가치 제안을 더욱 선명하게 할 예정입니다. 공급업체는 코발트, 니켈 및 리튬을 회수하기 위해 기가팩토리에 인접한 재활용 허브에 투자하고 EU의 새로운 스튜어드십 규칙에서 요구되는 서큘러 이코노미의 신용을 지원합니다. 이 복합 효과는 리튬 이온의 리더십을 강화하는 한편, 보완적인 화학물질이 명확하게 정의된 역할을 확보할 수 있게 되어, 산업용 배터리 시장에서의 기술의 다양성을 확보합니다.
산업용 배터리 시장 보고서는 기술별(리튬 이온, 납 축전지, 니켈 베이스, 기타), 용도별(포크리프트 및 동력, 통신 백업, UPS/데이터센터, 그리드 스케일 ESS, 기타), 최종 사용자 산업별(전력 및 유틸리티, 석유 및 가스, 제조 및 창고, 전기 통신, 기타), 지역별(북미, 유럽, 아시아, 태평양)로 구분됩니다.
지역 분석
아시아태평양은 비용 효율적인 기가스케일 공장, 정부 인센티브, 수직 통합 공급망이 견인해 2024년 50%의 매출 점유율을 유지했습니다. 중국은 지역 생산 능력의 3분의 2를 차지하며 단일 공장에서 연간 40GWh를 초과합니다. 일본의 우수한 재료 과학과 한국의 프리미엄 셀에 관한 전문 지식은 지역의 가격을 구미의 벤치마크보다 15-20% 낮게 억제하는 견고한 에코시스템을 밝히고 있습니다. 아시아태평양의 산업용 배터리 시장 규모는 CAGR 19.45%로 상승할 전망이며, 이는 국내의 재생에너지 목표, 수출 지향 제조업, 거치형 스토리지와 공통공급망을 공유하는 전기자동차 인프라의 가속에 추진되고 있습니다.
북미는 인플레이션 삭감법의 우대 조치, 국방 지향 공급망 재편, 풍부한 재생 가능 자원으로 2030년까지 가장 급성장하는 선진 지역 중 하나입니다. 2022년부터 2025년까지 LG 에너지 솔루션의 애리조나 공장 55억 달러, 테슬라의 텍사스 공장 2억 달러를 필두로 발표된 투자액은 1,000억 달러를 넘습니다. 연방 정부의 대출 보증 및 생산 세액 공제는 자본의 장애물을 낮추고 주 수준의 신속한 허가는 프로젝트 일정을 단축합니다.
유럽에서는 그린딜 산업계획과 유럽 배터리 얼라이언스를 통해 전략적 자율성을 추구하고 있지만, 높은 에너지 비용과 허가의 복잡성으로 인해 건설이 지연되고 있습니다. 독일, 스웨덴, 헝가리는 대부분의 프로젝트를 받아들이고 있으며, 노르웨이와 핀란드는 저탄소 전력을 활용하여 음극과 양극 가공을 유치하고 있습니다. 중동 및 아프리카는 오프 그리드 태양광 발전과 축전지가 디젤 발전기를 대체하는 아직 시작되었지만 유망한 시장입니다. 남아프리카의 REIPPP 프로그램과 UAE의 스마트 시티 구상이 조기 채용을 뒷받침하고 있습니다. 라틴아메리카의 리튬 트라이앵글은 다운스트림 분야에 대한 투자를 촉구하고 이 지역을 자원의 허브로, 또한 산업용 배터리 시장 전망의 제조 거점으로 자리매김합니다.
기타 혜택 :
- 엑셀 형식 시장 예측(ME) 시트
- 3개월간의 애널리스트 지원
목차
제1장 서론
- 조사 전제조건과 시장 정의
- 조사 범위
제2장 조사 방법
제3장 주요 요약
제4장 시장 상황
- 시장 개요
- 시장 성장 촉진요인
- 저하되는 리튬 이온 전지의 비용 곡선
- 재생에너지에 의한 ESS 구축
- 창고의 자동화와 AGV의 급증
- 데이터센터의 직류 마이크로그리드
- 통신 타워의 보관 의무
- OEM 주도의 세컨드라이프리스 모델
- 시장 성장 억제요인
- 크리티컬 미네랄의 가격 변동
- 납 축전지 오염 규제
- 고체 기술의 "모습"효과
- BESS 화재 위험 보험 비용 상승
- 전지/원재료 가격 동향과 예측
- 수출입 분석
- 공급망 분석
- 규제 상황
- 기술 전망
- Porter's Five Forces
- 공급기업의 협상력
- 구매자의 협상력
- 신규 참가업체의 위협
- 대체품의 위협
- 기업 간 경쟁 관계
제5장 시장 규모와 성장 예측
- 기술별
- 리튬 이온
- 납축전지
- 니켈 베이스
- 기타(유동 배터리, 나트륨 이온 포함)
- 용도별
- 지게차 및 동력 장치
- 통신 백업
- UPS/데이터센터
- 그리드 규모 ESS
- 기타(자동 유도 차량, 철도 및 해양 포함)
- 최종 사용자 업계별
- 전력 및 유틸리티
- 석유 및 가스
- 제조 및 창고업
- 통신
- 기타(운송 및 물류 포함)
- 지역별
- 북미
- 미국
- 캐나다
- 멕시코
- 유럽
- 독일
- 프랑스
- 영국
- 이탈리아
- 스페인
- 북유럽 국가
- 러시아
- 기타 유럽
- 아시아태평양
- 중국
- 일본
- 인도
- 한국
- ASEAN 국가
- 기타 아시아태평양
- 남미
- 브라질
- 아르헨티나
- 기타 남미
- 중동 및 아프리카
- 아랍에미리트(UAE)
- 사우디아라비아
- 남아프리카
- 기타 중동 및 아프리카
- 북미
제6장 경쟁 구도
- 시장 집중도
- 전략적 움직임(M&A, 파트너십, PPA)
- 시장 점유율 분석(주요 기업의 시장 순위/점유율)
- 기업 프로파일
- EnerSys
- East Penn Manufacturing
- Exide Industries
- GS Yuasa Corp.
- Saft Groupe SA
- Amara Raja Batteries
- Panasonic Energy
- CATL
- BYD Co. Ltd.
- LG Energy Solution
- Samsung SDI
- Johnson Controls
- Leoch Int'l
- JYC Battery
- Narada Power
- Crown Battery
- Hoppecke Batteries
- NorthStar Battery
- Trojan Battery
- Vision Group
제7장 시장 기회와 향후 전망
KTH 25.11.24The Industrial Battery Market size is estimated at USD 36.07 billion in 2025, and is expected to reach USD 80.37 billion by 2030, at a CAGR of 17.38% during the forecast period (2025-2030).

Falling lithium-ion prices, expanding grid-scale storage projects, and the march toward warehouse automation position batteries as indispensable infrastructure for energy-transition agendas. Heightened policy support in the United States and Europe spurs fresh manufacturing capacity, while Asia-Pacific leverages integrated supply chains to keep cost leadership. Consolidation is gathering speed as leading cell makers move upstream into raw materials and downstream into systems integration to secure margins, offset mineral price volatility, and comply with tightening safety standards. At the same time, second-life leasing models, micro-grid deployments, and the rise of sodium-ion alternatives are widening the addressable pool of applications and anchoring long-term demand for the industrial battery market.
Global Industrial Battery Market Trends and Insights
Declining Lithium-Ion Battery Cost Curve
Average lithium-ion pack prices fell 89% between 2010 and 2024 to USD 139 /kWh and are trending toward the USD 100 /kWh tipping point that unlocks mass industrial adoption. Global nameplate capacity rose from 95 GWh in 2020 to more than 1,200 GWh in 2024, driving scale economies and higher factory utilization in China. LG Energy Solution's Arizona complex will add 43 GWh of annual output from 2025, targeting production costs 25% below prevailing North American averages. Lower prices widen the installed base, enabling battery-as-a-service models that shift capex to opex and reduce customer adoption risk. The virtuous loop of falling prices and rising volumes is expected to solidify lithium-ion's leadership within the industrial battery market while paving the way for high-volume sodium-ion and solid-state introductions later in the decade.
Renewable-Powered ESS Build-Outs
Global grid-scale battery additions reached 15 GW in 2024, as utilities integrate storage to stabilize networks with renewable penetration above 30%. California alone fast-tracked 4.6 GWh worth of projects, while Queensland commissioned multiple 300-500 MWh systems to back its 50% renewables target. Beyond the utility domain, industrial micro-grids pair rooftop solar with on-site batteries to shave demand charges and guarantee power continuity. Cost declines, modular architectures, and streamlined procurement frameworks make batteries the least-cost solution for frequency control and capacity reserves, yielding a structural tailwind for the industrial battery market.
Critical-Mineral Price Volatility
Lithium carbonate prices spiked 1,000% from 2020-2022 before sliding 80% in 2024, disrupting procurement strategies and margin planning. Cobalt and nickel exhibit similar gyrations driven by geopolitical tensions and export restrictions in the Democratic Republic of Congo and Indonesia. Minerals account for up to 50% of lithium-ion system cost; volatility, therefore, translates into wide swings in projected total cost of ownership. Manufacturers hedge through multi-year offtake agreements, diversified feedstock, and recycling programs, but smaller players face balance-sheet pressure. Prospectors of sodium-ion and iron-based chemistries position their technologies as buffers against price shocks, creating a countervailing trend that tempers volatility risk for the industrial battery market.
Other drivers and restraints analyzed in the detailed report include:
- Warehouse Automation & AGVs Surge
- DC Micro-Grids in Data Centres
- Lead-Acid Pollution Regulations
For complete list of drivers and restraints, kindly check the Table Of Contents.
Segment Analysis
Lithium-ion captured 51% of the industrial battery market share in 2024, underpinned by an 89% decade-long cost plunge and superior round-trip efficiency. The segment is projected to expand at an 18% CAGR to 2030 as LFP formulations deliver 95% capacity retention after 6,000 cycles, pushing the lifetime cost of ownership below USD 0.08 per kWh delivered. Sodium-ion enters commercial scale via CATL's 2024 launch, offering 30% lower material costs and competitive performance for stationary storage. Flow batteries hold a foothold in applications requiring more than eight-hour discharge; a 100 MW/400 MWh vanadium redox plant in China illustrates bankable 20-year lifespans. Nickel-cadmium and nickel-metal hydride supply harsh-environment niches where -40 °C to 70 °C operation is essential, notably in remote oilfields. Solid-state prototypes promising 50% higher energy density line up for pilot production after 2027, with global automakers backing production qualification lines jointly.
The industrial battery market size for lithium-ion systems is forecast to climb from USD 18.4 billion in 2025 to USD 47.6 billion by 2030. Continuous scale-up dampens capital intensity per GWh, encourages vertical integration, and widens the performance gap with legacy chemistries. Simultaneously, innovation on high-manganese cathodes, silicon anodes, and high-voltage electrolytes intends to further trim unit costs and sharpen lithium-ion's value proposition. Suppliers invest in Gigafactory-adjacent recycling hubs to harvest cobalt, nickel, and lithium, underpinning circular-economy credentials required under new EU stewardship rules. The combined effect cements lithium-ion's leadership while allowing complementary chemistries to secure clearly defined roles, ensuring technology diversity within the industrial battery market.
The Industrial Battery Market Report is Segmented by Technology (Lithium-Ion, Lead-Acid, Nickel-Based, and Others), Application (Forklift and Motive Power, Telecom Backup, UPS/Data Centres, Grid-Scale ESS, and Others), End-User Industry (Power and Utilities, Oil and Gas, Manufacturing and Warehousing, Telecom, and Others), and Geography (North America, Europe, Asia-Pacific, South America, and Middle East and Africa).
Geography Analysis
Asia-Pacific retained a 50% revenue share in 2024, driven by cost-efficient giga-scale factories, government incentives, and vertically integrated supply chains. China accounts for two-thirds of regional capacity, with single plants exceeding 40 GWh annually. Japan's material science prowess and South Korea's premium cell expertise reveal a robust ecosystem that keeps regional prices 15-20% below Western benchmarks. Asia-Pacific's industrial battery market size is set to climb at a 19.45% CAGR, fueled by domestic renewables targets, export-oriented manufacturing, and accelerating electric-vehicle infrastructure that shares common supply chains with stationary storage.
North America is one of the fastest-growing developed regions, through 2030, due to the Inflation Reduction Act incentives, defense-oriented supply-chain reshoring, and abundant renewable resources. Between 2022-2025, announced investments exceed USD 100 billion, led by LG Energy Solution's USD 5.5 billion Arizona plant and Tesla's USD 200 million megafactory in Texas. Federal loan guarantees and production tax credits lower capital hurdles, while state-level fast-track permits compress project timelines.
Europe pursues strategic autonomy via the Green Deal Industrial Plan and European Battery Alliance, yet high energy costs and permitting complexity slow build-out. Germany, Sweden, and Hungary host most projects; Norway and Finland leverage low-carbon power to attract anode and cathode processing. The Middle East and Africa represent nascent but promising markets as off-grid solar plus storage displaces diesel generators; South Africa's REIPPP programme and the UAE's smart-city ambitions drive early adoption. Latin America's lithium triangle stimulates downstream investment discussions, positioning the region as a resource hub and a future manufacturing base for the industrial battery market.
- EnerSys
- East Penn Manufacturing
- Exide Industries
- GS Yuasa Corp.
- Saft Groupe SA
- Amara Raja Batteries
- Panasonic Energy
- CATL
- BYD Co. Ltd.
- LG Energy Solution
- Samsung SDI
- Johnson Controls
- Leoch Int'l
- JYC Battery
- Narada Power
- Crown Battery
- Hoppecke Batteries
- NorthStar Battery
- Trojan Battery
- Vision Group
Additional Benefits:
- The market estimate (ME) sheet in Excel format
- 3 months of analyst support
TABLE OF CONTENTS
1 Introduction
- 1.1 Study Assumptions & Market Definition
- 1.2 Scope of the Study
2 Research Methodology
3 Executive Summary
4 Market Landscape
- 4.1 Market Overview
- 4.2 Market Drivers
- 4.2.1 Declining lithium-ion battery cost curve
- 4.2.2 Renewable-powered ESS build-outs
- 4.2.3 Warehouse automation & AGVs surge
- 4.2.4 DC micro-grids in data centres
- 4.2.5 Telecom tower storage mandates
- 4.2.6 OEM-driven 2nd-life leasing models
- 4.3 Market Restraints
- 4.3.1 Critical-mineral price volatility
- 4.3.2 Lead-acid pollution regulations
- 4.3.3 Solid-state tech "wait-and-see" effect
- 4.3.4 Rising BESS fire-risk insurance costs
- 4.4 Battery/Raw-Material Price Trends & Forecast
- 4.5 Import and Export Analysis
- 4.6 Supply-Chain Analysis
- 4.7 Regulatory Landscape
- 4.8 Technological Outlook
- 4.9 Porter's Five Forces
- 4.9.1 Bargaining Power of Suppliers
- 4.9.2 Bargaining Power of Buyers
- 4.9.3 Threat of New Entrants
- 4.9.4 Threat of Substitutes
- 4.9.5 Competitive Rivalry
5 Market Size & Growth Forecasts
- 5.1 By Technology
- 5.1.1 Lithium-ion
- 5.1.2 Lead-acid
- 5.1.3 Nickel-based
- 5.1.4 Others (incl. Flow Battery, Sodium-ion)
- 5.2 By Application
- 5.2.1 Forklift and Motive Power
- 5.2.2 Telecom Backup
- 5.2.3 UPS/Data Centres
- 5.2.4 Grid-Scale ESS
- 5.2.5 Others (incl Automated Guided Vehicles, Rail and Marine)
- 5.3 By End-User Industry
- 5.3.1 Power and Utilities
- 5.3.2 Oil and Gas
- 5.3.3 Manufacturing and Warehousing
- 5.3.4 Telecom
- 5.3.5 Others (incl Transportation and Logistics)
- 5.4 By Geography
- 5.4.1 North America
- 5.4.1.1 United States
- 5.4.1.2 Canada
- 5.4.1.3 Mexico
- 5.4.2 Europe
- 5.4.2.1 Germany
- 5.4.2.2 France
- 5.4.2.3 United Kingdom
- 5.4.2.4 Italy
- 5.4.2.5 Spain
- 5.4.2.6 Nordic Countries
- 5.4.2.7 Russia
- 5.4.2.8 Rest of Europe
- 5.4.3 Asia-Pacific
- 5.4.3.1 China
- 5.4.3.2 Japan
- 5.4.3.3 India
- 5.4.3.4 South Korea
- 5.4.3.5 ASEAN Countries
- 5.4.3.6 Rest of Asia-Pacific
- 5.4.4 South America
- 5.4.4.1 Brazil
- 5.4.4.2 Argentina
- 5.4.4.3 Rest of South America
- 5.4.5 Middle East and Africa
- 5.4.5.1 United Arab Emirates
- 5.4.5.2 Saudi Arabia
- 5.4.5.3 South Africa
- 5.4.5.4 Rest of Middle East and Africa
- 5.4.1 North America
6 Competitive Landscape
- 6.1 Market Concentration
- 6.2 Strategic Moves (M&A, Partnerships, PPAs)
- 6.3 Market Share Analysis (Market Rank/Share for key companies)
- 6.4 Company Profiles (includes Global level Overview, Market level overview, Core Segments, Financials as available, Strategic Information, Products & Services, and Recent Developments)
- 6.4.1 EnerSys
- 6.4.2 East Penn Manufacturing
- 6.4.3 Exide Industries
- 6.4.4 GS Yuasa Corp.
- 6.4.5 Saft Groupe SA
- 6.4.6 Amara Raja Batteries
- 6.4.7 Panasonic Energy
- 6.4.8 CATL
- 6.4.9 BYD Co. Ltd.
- 6.4.10 LG Energy Solution
- 6.4.11 Samsung SDI
- 6.4.12 Johnson Controls
- 6.4.13 Leoch Int'l
- 6.4.14 JYC Battery
- 6.4.15 Narada Power
- 6.4.16 Crown Battery
- 6.4.17 Hoppecke Batteries
- 6.4.18 NorthStar Battery
- 6.4.19 Trojan Battery
- 6.4.20 Vision Group
7 Market Opportunities & Future Outlook
- 7.1 White-space & Unmet-Need Assessment
