|
시장보고서
상품코드
1851608
DaaS(Data As A Service) : 시장 점유율 분석, 산업 동향, 통계, 성장 예측(2025-2030년)Data As A Service - Market Share Analysis, Industry Trends & Statistics, Growth Forecasts (2025 - 2030) |
||||||
DaaS(Data As A Service) 시장 규모는 2025년에 248억 9,000만 달러에 이르고, 2030년에는 CAGR 20.0%를 나타내 619억 3,000만 달러로 확대될 것으로 예측됩니다.

기업은 고유 데이터의 수익화, API 퍼스트 딜리버리의 채용, 리프레시 가능한 외부 데이터 세트를 요구하는 AI 모델의 지원을 위해 지출을 가속시킵니다. 실시간 분석 기대, 클라우드 스토리지 단가 하락, 나노데이터 세트 마켓플레이스의 등장이 대응 가능한 기회를 총체적으로 확대하고 있습니다. 91%의 기업이 애널리틱스 투자를 통한 효율성과 의사결정 속도의 구체적인 개선을 꼽고 있으며, 리더십 팀은 측정 가능한 이익을 보고하고 있습니다. BFSI는 초기 도입의 중심이며, 건강 관리는 가장 빠른 궤도를 기록합니다. 또한 기업이 데이터 주권과 비용 관리의 균형을 맞추고 있는 가운데 하이브리드 도입 모델이 급증하고 있습니다. 북미는 최대 수익원을 공급하고 있지만, 데이터 현지화에 관한 법률과 디지털 변환의 과제가 수렴함에 따라 아시아태평양은 성장을 이끌고 있습니다.
세계의 DaaS(Data As A Service) 시장 동향과 인사이트
데이터 중심의 의사 결정으로 기업 이동
통합 데이터 플랫폼을 도입한 기업은 정보 검색 사이클을 3-5배 고속화하여 응답 정밀도를 50-70% 향상시키고 있습니다. 금융기관은 부정방지 프로그램에 의한 큰 이익을 강조하면서도 고급 AI 이용 사례에서의 능력 갭을 인식하고 있어 견고한 데이터 인프라에 대한 지출 증가에 박차를 가하고 있습니다. 경영진이 데이터를 IT 제품이 아닌 전략적 기업 자산으로 취급하면 도입이 가속화됩니다. 따라서 투자는 내부 기록과 프리미엄 외부 피드를 실시간으로 혼합할 수 있는 통합 레이어로 이동합니다. 이것은 스키마에 얽매이지 않는 확장 가능한 서비스에 대한 수요의 지속을 지원합니다.
비정형 데이터의 폭발적 증가와 실시간 분석 수요
비구조화된 컨텐츠는 이미 기업 데이터의 80%를 차지하고 있는 반면, 예산은 낮은 수준에 머물러 있으며 미개척 수익화 풀임이 밝혀졌습니다. AI 지원 데이터 파이프라인을 위한 4,000만 달러의 라운드로 대표되는 비정형 데이터 도구의 벤처 자금 조달은 특수 처리 플랫폼에 대한 신뢰를 보여줍니다. 밀리초 단위로 측정되는 라이브 타임 애널리틱스는 마케팅 실행을 전환 지표를 높이는 슈퍼 개인화로 전환합니다. 검색을 강화한 세대 프레임워크를 채용하는 조직은 AI 환각을 70-90% 삭감했다고 보고하고 있으며, 지속적인 데이터 업데이트 비즈니스 케이스를 강화하고 있습니다. 이러한 동향을 종합하면 DaaS(Data As A Service) 시장의 범위가 넓어지고 벡터 데이터베이스와 스트리밍 파이프라인에 대한 투자가 촉진됩니다.
데이터 프라이버시 및 사이버 보안에 대한 우려
미국에서는 2024년 중반까지 20개 주에서 종합적인 프라이버시법이 제정되어 연방법안에서는 컴플라이언스 비용을 인상하는 전국적인 기준이 도입되었습니다. 기업의 46%가 데이터 품질 목표 달성의 주요 장애물로 프라이버시를 제시합니다. 헬스케어 기업은 클라우드 도입을 확대하면서 환자 데이터 관리를 HIPAA와 일치시켜야 합니다. 의료기관은 클라우드 도입을 확대하는 한편, 환자 데이터의 관리를 HIPAA와 정합시켜야 합니다. 또한, 관할지역에 근거한 거주 의무는 공급자가 여러 지역 내 사본을 유지해야 하며 운영상의 오버헤드를 증가시킵니다. 이러한 요인은 특히 까다로운 산업에서 자동화 및 정책 애즈코드 도구가 성숙할 때까지 클라우드 배포를 억제합니다.
부문 분석
BFSI 부서는 2024년 전체 매출의 28.7%를 차지하며, 엄격한 컴플라이언스 지침과 고급 부정 감지 워크로드를 통해 DaaS(Data As A Service) 시장을 지원했습니다. 헬스케어는 22.5%의 연평균 복합 성장률(CAGR)을 나타내며, 산업별로는 가장 빠릅니다. 이는 병원이 AI를 지원하는 진단과 집단 건강 분석을 채택했기 때문입니다. IT 및 통신사는 네트워크 최적화를 위해 데이터 세트를 통합하고 정부는 안전한 데이터 교환에 의존하는 전자 서비스를 확장합니다. 제조 및 에너지의 기존 기업은 지속적인 센서 피드가 필요한 예측 유지 보수 모델을 개발합니다.
헬스케어 기업은 2024년 클라우드 서비스에 평균 3,800만 달러를 지출했으며, 마이그레이션 결과에 대한 만족도는 72%라고 보고했습니다. 전자 기록, 이미지 저장소, 유전체학의 융합은 비정형 데이터 파이프라인에 대한 수요를 증가시킵니다. 소매업은 실시간 피드를 활용하여 개인화된 추천을 실시해, 쇼핑 바구니의 사이즈를 확대해, 교육 기관은 AI를 짜넣은 학습 플랫폼을 시험적으로 도입하고 있습니다. 이러한 다양한 이용 사례는 DaaS(Data As A Service) 시장의 전략적 관련성을 높이고 있습니다.
퍼블릭 클라우드 인스턴스는 성숙한 보안 인증과 풍부한 관리형 서비스 툴킷의 혜택을 통해 2024년 매출의 54.0%를 획득했습니다. 하지만 하이브리드 클라우드와 멀티클라우드 방식이 CAGR 23.1%로 가장 높은 성장률을 보였습니다. 프라이빗 클라우드 옵션은 특히 금융 및 방어와 같은 대기 시간과 주권이 강조되는 분야에서 뿌리 깊게 남아 있습니다.
2027년까지 90%의 기업이 하이브리드 전략을 실행할 의향을 보여주며, 이는 워크로드의 특성이 탄력성과 감도 측면에서 다르다는 인식이 넓어지고 있음을 반영합니다. 데이터 패브릭 아키텍처와 크로스플레인 제어 레이어는 공급업체에 고정되지 않고 유동적인 움직임을 가능하게 하기 때문에 인기가 높아지고 있습니다. 비용 계산기가 퇴출 부채를 정량화함에 따라 재무 책임자는 분석 테이블을 AI 런타임에 가깝게 배치하는 정책을 요구하게 됩니다. 이러한 시장 개척은 배포의 중립성을 홍보하는 DaaS(Data As A Service) 시장 플랫폼의 대응 가능한 기반을 확대합니다.
지역 분석
북미는 2024년 매출의 39.4%를 차지하며 데이터 인프라 혁신을 갈고 닦는 자본력 있는 구매자와 깊은 벤처 에코시스템을 지원했습니다. AWS에서만 예상되는 420만 명의 세계 고객에게 서비스를 제공하며 이 지역의 클라우드 성숙도를 보여줍니다. 미국의 데이터센터 소비량은 2023년에 176TWh에 이르며, 생성형 AI 워크로드의 보급에 따라 2028년까지 325-580TWh로 증가할 가능성이 있습니다. 캐나다는 주권을 중시하고 있으며, 거주 관련 법률에 따라 국내 시장 노드에 대한 수요를 환기하고 있습니다. 이 지역의 정책 믹스는 안전한 멀티 파티 분석을 지원하는 개인 정보 보호 강화 기술을 장려하고 DaaS(Data As A Service) 시장을 확대합니다.
아시아태평양은 가장 빠르게 확대되고 있으며 CAGR 24.9%를 나타낼 전망입니다. 인도는 디지털 인디어 프로그램과 하이퍼스케일러 지역 출시의 혜택을 받았으며, 일본은 Microsoft와 AWS로부터 차세대 시설을 대상으로 수십억 달러의 약속을 받았습니다. 모바일 서비스는 지역 GDP를 5.3% 밀어 올리고 현지화 중심의 방대한 데이터 세트를 생성합니다. 현지 데이터 마켓플레이스는 레지던시 규칙 하에서 번영하며 세계 공급자 배포 옵션을 형성합니다.
유럽에서는 GDPR(EU 개인정보보호규정)의 틀과 지속가능성의 의무화로 아키텍처의 의사결정이 촉진되어 꾸준한 성장을 이루고 있습니다. Global Switch와 같은 공급업체는 2030년까지 100% 재생 가능한 전력을 사용하기로 약속하며 데이터센터 확장을 녹색 에너지 목표와 일치시킵니다. 프랑스, 독일, 북유럽은 PUE 비율을 줄이는 탄력적인 그리드와 차가운 기후로 용량을 유치하고 있습니다. 남미에서는 재정적 우대조치가 클라우드 사업자를 유치하는 브라질에 성장이 집중하고, 중동 및 아프리카에서는 핀테크의 중심지에 집중하는 선택적인 도입을 볼 수 있습니다. 미국 데이터센터 부하의 80%가 불과 15개 주에 집중되어 집중 위험이 현저해지기 때문에 입지 전략은 여전히 중심적인 구매 기준이 되고 있습니다.
기타 혜택 :
- 엑셀 형식 시장 예측(ME) 시트
- 3개월간의 애널리스트 지원
목차
제1장 서론
- 시장 정의와 조사의 전제
- 조사 범위
제2장 조사 방법
제3장 주요 요약
제4장 시장 상황
- 시장 개요
- 시장 성장 촉진요인
- 데이터 주도의 의사 결정으로의 기업 변화
- 비구조화 데이터의 폭발적 증가와 실시간 분석 수요
- 클라우드 스토리지/컴퓨팅 비용 저하
- AI RAG 프레임워크의 리프레시 가능한 외부 데이터에 대한 의욕
- 지역 데이터 마켓플레이스를 부추기는 데이터 현지화법
- API 퍼스트의 「나노 데이터 세트」수익화 플랫폼
- 시장 성장 억제요인
- 데이터 프라이버시와 사이버 보안에 대한 우려
- 데이터 품질과 상호 운용성의 갭
- 하이퍼스케일러의 에그레스 요금의 상승이 마진을 압박
- 에너지 집약형 데이터 파이프라인의 ESG정사
- 밸류체인 분석
- 중요한 규제 프레임워크의 평가
- 주요 이해관계자의 영향 평가
- 기술 전망
- Porter's Five Forces 분석
- 공급기업의 협상력
- 소비자의 협상력
- 신규 참가업체의 위협
- 대체품의 위협
- 기업 간 경쟁 관계
- 거시경제 요인의 영향
제5장 시장 규모와 성장 예측
- 최종 사용자 업계별
- BFSI
- IT 및 통신 분야
- 정부 및 공공 부문
- 소매 및 전자상거래
- 헬스케어 및 생명과학
- 제조
- 에너지 및 유틸리티
- 교육
- 기타
- 배포 모델별
- 퍼블릭 클라우드
- 프라이빗 클라우드
- 하이브리드/멀티 클라우드
- 데이터 유형별
- 구조화 데이터
- 비구조화 데이터
- 반구조화 데이터
- 최종 사용자 기업 규모별
- 대기업
- 중소기업
- 용도별
- 실시간 운영 분석
- 고객 및 마케팅 인텔리전스
- 리스크 및 컴플라이언스·매니지먼트
- 공급망 및 물류 최적화
- 사기 탐지 및 신용 평가
- 제품 및 가격 분석
- 기타
- 지역별
- 북미
- 미국
- 캐나다
- 멕시코
- 남미
- 브라질
- 아르헨티나
- 기타 남미
- 유럽
- 독일
- 영국
- 프랑스
- 이탈리아
- 스페인
- 러시아
- 기타 유럽
- 아시아태평양
- 중국
- 일본
- 인도
- 한국
- 호주 및 뉴질랜드
- 기타 아시아태평양
- 중동 및 아프리카
- 중동
- 사우디아라비아
- 아랍에미리트(UAE)
- 튀르키예
- 기타 중동
- 아프리카
- 남아프리카
- 나이지리아
- 이집트
- 기타 아프리카
- 북미
제6장 경쟁 구도
- 시장 집중도
- 전략적 동향
- 시장 점유율 분석
- 기업 프로파일
- Bloomberg Finance LP
- Dow Jones and Company, Inc.
- Environmental Systems Research Institute, Inc.
- Equifax Inc.
- FactSet Research Systems Inc.
- IBM Corporation
- Oracle Corporation
- SAP SE
- Thomson Reuters Corporation
- Morningstar, Inc.
- Moody's Analytics, Inc.
- Mastercard Advisors LLC
- S&P Global Inc.
- RELX PLC(LexisNexis Risk Solutions)
- ZoomInfo Technologies Inc.
- Snowflake Inc.
- Experian PLC
- Verisk Analytics, Inc.
- CoreLogic, Inc.
- TransUnion LLC
- NielsenIQ(The Nielsen Company LLC)
- SafeGraph Inc.
- GapMaps Pty Ltd.
- Apify Technologies sro
제7장 시장 기회와 앞으로의 동향
- 백스페이스와 미충족 수요(Unmet Needs) 평가
The Data as a Service market size reached USD 24.89 billion in 2025 and is projected to advance to USD 61.93 billion by 2030, reflecting a robust 20.0% CAGR.
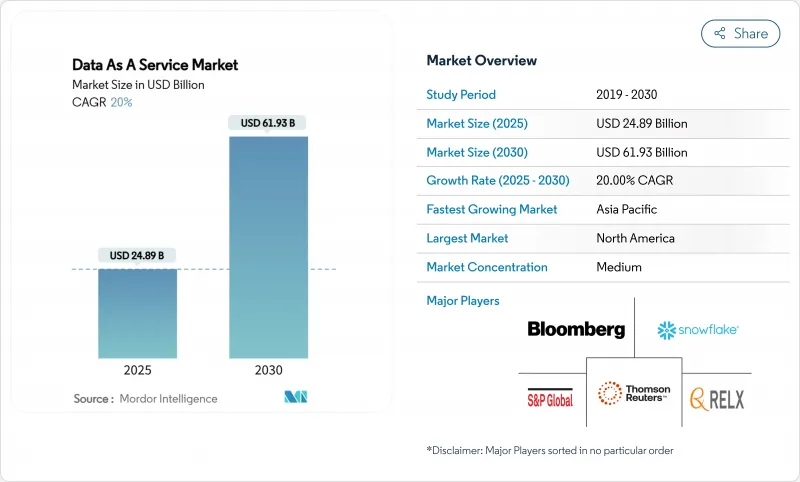
Enterprises accelerate spending to monetize proprietary data, adopt API-first delivery, and support AI models that demand refreshable external datasets. Real-time analytics expectations, falling unit costs for cloud storage, and the rise of nanodataset marketplaces collectively widen the addressable opportunity. Leadership teams report measurable gains, with 91% of firms citing tangible improvements in efficiency and decision speed from analytics investments. Sector growth remains uneven: BFSI anchors early adoption, healthcare records the fastest trajectory, and hybrid deployment models surge as organizations balance data sovereignty with cost control. North America supplies the largest revenue pool, yet Asia-Pacific leads in growth as data-localization laws and digital transformation agendas converge.
Global Data As A Service Market Trends and Insights
Enterprise Shift Toward Data-Driven Decision-Making
Organizations that embed unified data platforms record information-retrieval cycles that are three to five times faster and response-accuracy improvements of 50-70% . Finance institutions highlight strong returns from anti-fraud programs yet acknowledge capability gaps in advanced AI use cases, spurring incremental spending on robust data infrastructure. Adoption accelerates as executives treat data as a strategic corporate asset rather than an IT by-product. Investment therefore shifts toward integration layers able to blend internal records with premium external feeds in real time. The driver supports sustained demand for scalable, schema-agnostic services across verticals.
Explosion of Unstructured Data and Real-Time Analytics Demand
Unstructured content already represents 80% of enterprise data while attracting disproportionately low budgets, underscoring an untapped monetization pool. Venture financing in unstructured-data tooling-exemplified by a USD 40 million round for AI-ready data pipelines-signals confidence in specialized processing platforms . Live-time analytics, measured in milliseconds, has shifted marketing execution toward hyper-personalization that raises conversion metrics. Organisations adopting retrieval-augmented generation frameworks report 70-90% reductions in AI hallucinations, reinforcing the business case for continuous data refresh. Collectively these trends widen the scope of the Data as a Service market and encourage investment in vector databases and streaming pipelines.
Data-Privacy and Cybersecurity Concerns
Twenty US states enacted comprehensive privacy statutes by mid-2024, and a proposed federal bill would introduce nationwide standards that raise compliance costs. Forty-six percent of enterprises cite privacy as their primary impediment to data-quality goals. Sector-specific rules add complexity: healthcare organisations must align patient-data controls with HIPAA while scaling cloud adoption. Jurisdiction-based residency mandates force providers to maintain multiple in-region copies, increasing operational overhead. These factors temper uptake, especially in highly regulated verticals, until automation and policy-as-code tooling mature.
Other drivers and restraints analyzed in the detailed report include:
- Falling Cloud Storage and Compute Costs
- AI RAG Frameworks' Appetite for Refreshable External Data
- Data-Quality and Interoperability Gaps
For complete list of drivers and restraints, kindly check the Table Of Contents.
Segment Analysis
The BFSI sector retained 28.7% of overall revenue in 2024, anchoring the Data as a Service market through stringent compliance mandates and sophisticated fraud-detection workloads. Healthcare logged a 22.5% CAGR, the fastest among industries, as hospitals embrace AI-supported diagnostics and population-health analytics. IT and telecommunications firms integrate datasets for network optimisation, while governments expand e-services that depend on secure data exchanges. Manufacturing and energy incumbents deploy predictive-maintenance models requiring continuous sensor feeds.
Healthcare organisations spent an average USD 38 million on cloud services in 2024 and reported 72% satisfaction with migration outcomes. The convergence of electronic health records, imaging repositories, and genomics drives demand for unstructured-data pipelines. Retailers leverage real-time feeds for personalised recommendations that raise basket sizes, whereas education institutions pilot AI-infused learning platforms. These varied use cases reinforce the strategic relevance of the Data as a Service market.
Public-cloud instances captured 54.0% of 2024 revenue, benefiting from mature security certifications and rich managed-service toolkits. Hybrid and multi-cloud approaches, however, post the strongest growth at 23.1% CAGR as organisations optimise data placement to mitigate egress fees and satisfy residency requirements. Private-cloud options persist where latency and sovereignty hold sway, notably in finance and defence.
Ninety percent of enterprises intend to run hybrid strategies by 2027, reflecting widespread recognition that workload characteristics vary in elasticity and sensitivity. Data-fabric architectures and cross-plane control layers thus rise in popularity, enabling fluid movement without vendor lock-in. As cost calculators quantify egress liabilities, finance chiefs lobby for placement policies that keep analytic tables close to AI runtimes. These developments enlarge the addressable base for Data as a Service market platforms that advertise deployment neutrality.
Data As A Service Market Report is Segmented by End-User Industry (BFSI, IT and Telecommunications, and More), Deployment Model (Public Cloud, Private Cloud, Hybrid/Multi-cloud), Data Type (Structured Data, Unstructured Data, Semi-Structured Data), End-User Enterprise Size (Large Enterprises, and More), Application (Real-Time Operational Analytics, and More), and Geography. The Market Forecasts are Provided in Terms of Value (USD).
Geography Analysis
North America held 39.4% of 2024 revenue, sustained by well-capitalised buyers and deep venture ecosystems that refine data-infrastructure innovations. AWS alone serves an estimated 4.2 million global customers, illustrating the region's cloud maturity. United States data-centre consumption reached 176 TWh in 2023 and could rise to 325-580 TWh by 2028 as generative-AI workloads proliferate. Canada emphasises sovereignty, stimulating demand for in-country marketplace nodes that comply with residency statutes. The regional policy mix encourages privacy-enhancing technologies that underpin secure multi-party analytics and broaden the Data as a Service market.
Asia-Pacific records the fastest expansion, advancing at a 24.9% CAGR as governments channel capital toward digital corridors and cloud zones. India benefits from the Digital India programme and hyperscaler region launches, while Japan secures multi-billion-dollar commitments from Microsoft and AWS for next-generation facilities. Mobile services add 5.3% to regional GDP, creating a vast stream of localisation-driven datasets . Local data-marketplaces thrive under residency rules, shaping deployment choices for global providers.
Europe posts steady gains as the GDPR framework and sustainability mandates steer architectural decisions. Providers like Global Switch commit to 100% renewable electricity usage by 2030, aligning data-centre expansions with green-energy goals. France, Germany, and the Nordics attract capacity through resilient grids and cool climates that trim PUE ratios. South America's growth concentrates in Brazil where fiscal incentives entice cloud operators, whereas the Middle East and Africa see selective uptake clustered in fintech hubs. Location strategy remains a core purchase criterion as 80% of US data-centre load resides in just 15 states, revealing concentration risks.
- Bloomberg Finance L.P.
- Dow Jones and Company, Inc.
- Environmental Systems Research Institute, Inc.
- Equifax Inc.
- FactSet Research Systems Inc.
- IBM Corporation
- Oracle Corporation
- SAP SE
- Thomson Reuters Corporation
- Morningstar, Inc.
- Moody's Analytics, Inc.
- Mastercard Advisors LLC
- S&P Global Inc.
- RELX PLC (LexisNexis Risk Solutions)
- ZoomInfo Technologies Inc.
- Snowflake Inc.
- Experian PLC
- Verisk Analytics, Inc.
- CoreLogic, Inc.
- TransUnion LLC
- NielsenIQ (The Nielsen Company LLC)
- SafeGraph Inc.
- GapMaps Pty Ltd.
- Apify Technologies s.r.o.
Additional Benefits:
- The market estimate (ME) sheet in Excel format
- 3 months of analyst support
TABLE OF CONTENTS
1 INTRODUCTION
- 1.1 Market Definition and Study Assumptions
- 1.2 Scope of the Study
2 RESEARCH METHODOLOGY
3 EXECUTIVE SUMMARY
4 MARKET LANDSCAPE
- 4.1 Market Overview
- 4.2 Market Drivers
- 4.2.1 Enterprise shift toward data-driven decision-making
- 4.2.2 Explosion of unstructured data and real-time analytics demand
- 4.2.3 Falling cloud storage/compute costs
- 4.2.4 AI RAG frameworks' appetite for refreshable external data
- 4.2.5 Data-localization laws fuelling regional data marketplaces
- 4.2.6 API-first ''nano-datasets'' monetisation platforms
- 4.3 Market Restraints
- 4.3.1 Data-privacy and cybersecurity concerns
- 4.3.2 Data-quality and interoperability gaps
- 4.3.3 Rising hyperscaler egress fees compressing margins
- 4.3.4 ESG scrutiny of energy-intensive data pipelines
- 4.4 Value Chain Analysis
- 4.5 Evaluation of Critical Regulatory Framework
- 4.6 Impact Assessment of Key Stakeholders
- 4.7 Technological Outlook
- 4.8 Porter's Five Forces Analysis
- 4.8.1 Bargaining Power of Suppliers
- 4.8.2 Bargaining Power of Consumers
- 4.8.3 Threat of New Entrants
- 4.8.4 Threat of Substitutes
- 4.8.5 Intensity of Competitive Rivalry
- 4.9 Impact of Macro-economic Factors
5 MARKET SIZE AND GROWTH FORECASTS (VALUE)
- 5.1 By End-User Industry
- 5.1.1 BFSI
- 5.1.2 IT and Telecommunications
- 5.1.3 Government and Public Sector
- 5.1.4 Retail and E-commerce
- 5.1.5 Healthcare and Life Sciences
- 5.1.6 Manufacturing
- 5.1.7 Energy and Utilities
- 5.1.8 Education
- 5.1.9 Others
- 5.2 By Deployment Model
- 5.2.1 Public Cloud
- 5.2.2 Private Cloud
- 5.2.3 Hybrid / Multi-cloud
- 5.3 By Data Type
- 5.3.1 Structured Data
- 5.3.2 Unstructured Data
- 5.3.3 Semi-structured Data
- 5.4 By End-user Enterprise Size
- 5.4.1 Large Enterprises
- 5.4.2 Small and Medium Enterprises
- 5.5 By Application
- 5.5.1 Real-time Operational Analytics
- 5.5.2 Customer and Marketing Intelligence
- 5.5.3 Risk and Compliance Management
- 5.5.4 Supply-Chain and Logistics Optimisation
- 5.5.5 Fraud Detection and Credit Scoring
- 5.5.6 Product and Pricing Analytics
- 5.5.7 Others
- 5.6 By Geography
- 5.6.1 North America
- 5.6.1.1 United States
- 5.6.1.2 Canada
- 5.6.1.3 Mexico
- 5.6.2 South America
- 5.6.2.1 Brazil
- 5.6.2.2 Argentina
- 5.6.2.3 Rest of South America
- 5.6.3 Europe
- 5.6.3.1 Germany
- 5.6.3.2 United Kingdom
- 5.6.3.3 France
- 5.6.3.4 Italy
- 5.6.3.5 Spain
- 5.6.3.6 Russia
- 5.6.3.7 Rest of Europe
- 5.6.4 Asia-Pacific
- 5.6.4.1 China
- 5.6.4.2 Japan
- 5.6.4.3 India
- 5.6.4.4 South Korea
- 5.6.4.5 Australia and New Zealand
- 5.6.4.6 Rest of Asia-Pacific
- 5.6.5 Middle East and Africa
- 5.6.5.1 Middle East
- 5.6.5.1.1 Saudi Arabia
- 5.6.5.1.2 United Arab Emirates
- 5.6.5.1.3 Turkey
- 5.6.5.1.4 Rest of Middle East
- 5.6.5.2 Africa
- 5.6.5.2.1 South Africa
- 5.6.5.2.2 Nigeria
- 5.6.5.2.3 Egypt
- 5.6.5.2.4 Rest of Africa
- 5.6.1 North America
6 COMPETITIVE LANDSCAPE
- 6.1 Market Concentration
- 6.2 Strategic Moves
- 6.3 Market Share Analysis
- 6.4 Company Profiles (includes Global level Overview, Market level overview, Core Segments, Financials as available, Strategic Information, Market Rank/Share for key companies, Products and Services, and Recent Developments)
- 6.4.1 Bloomberg Finance L.P.
- 6.4.2 Dow Jones and Company, Inc.
- 6.4.3 Environmental Systems Research Institute, Inc.
- 6.4.4 Equifax Inc.
- 6.4.5 FactSet Research Systems Inc.
- 6.4.6 IBM Corporation
- 6.4.7 Oracle Corporation
- 6.4.8 SAP SE
- 6.4.9 Thomson Reuters Corporation
- 6.4.10 Morningstar, Inc.
- 6.4.11 Moody's Analytics, Inc.
- 6.4.12 Mastercard Advisors LLC
- 6.4.13 S&P Global Inc.
- 6.4.14 RELX PLC (LexisNexis Risk Solutions)
- 6.4.15 ZoomInfo Technologies Inc.
- 6.4.16 Snowflake Inc.
- 6.4.17 Experian PLC
- 6.4.18 Verisk Analytics, Inc.
- 6.4.19 CoreLogic, Inc.
- 6.4.20 TransUnion LLC
- 6.4.21 NielsenIQ (The Nielsen Company LLC)
- 6.4.22 SafeGraph Inc.
- 6.4.23 GapMaps Pty Ltd.
- 6.4.24 Apify Technologies s.r.o.
7 MARKET OPPORTUNITIES AND FUTURE TRENDS
- 7.1 White-space and Unmet-need Assessment