
|
시장보고서
상품코드
1939748
디지털 트윈(DT) : 시장 점유율 분석, 업계 동향과 통계, 성장 예측(2026-2031년)Digital Twin (DT) - Market Share Analysis, Industry Trends & Statistics, Growth Forecasts (2026 - 2031) |
||||||
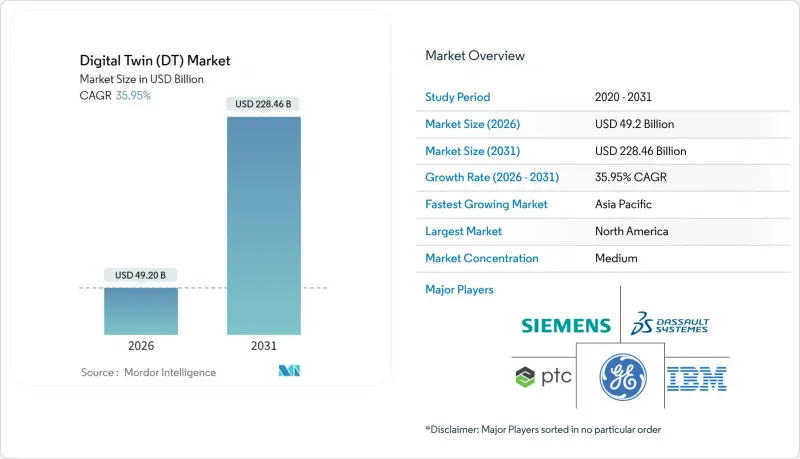
디지털 트윈 시장은 2025년에 361억 9,000만 달러로 평가되었으며, 2026년 492억 달러에서 2031년까지 2,284억 6,000만 달러에 달할 것으로 예측됩니다.
예측 기간(2026-2031년) 동안 CAGR은 35.95%로 예상됩니다.

산업 IoT 플랫폼의 성숙, 엣지 AI의 광범위한 도입, 안전에 중요한 인프라에 대한 규제 요건 등이 호재로 작용할 것으로 보입니다. 스마트 팩토리에 대한 투자로 제조업이 가장 큰 응용 분야로 자리매김하고 있지만, 가혹한 운영 환경에서 자산 건전성을 개선하고자 하는 생산자들의 수요로 인해 석유 및 가스 분야가 가장 높은 성장세를 보이고 있습니다. 지역별로는 북미가 선두를 유지하고 있지만, 중국, 인도, 일본의 공공 프로그램이 대규모 디지털화에 자금을 투입하면서 아시아태평양이 그 격차를 좁혀가고 있습니다. 현재 지출의 대부분은 솔루션이 차지하고 있지만, 기업들이 통합 노하우를 요구하면서 서비스 분야도 빠르게 확대되고 있습니다. 클라우드 도입은 온프레미스보다 높은 성장률을 보이고 있으며, 이는 원격 데이터 관리의 안전성과 확장 가능한 아키텍처에 대한 신뢰가 높아졌음을 보여줍니다. 사이버 보안 취약성과 물리 기반 모델링 인력 부족이 성장 전망을 억제하는 요인으로 작용하고 있지만, 도입의 주요 방향성을 바꾸지는 못하고 있습니다.
세계 디지털 트윈(DT) 시장 동향 및 인사이트
산업용 IoT 플랫폼의 빠른 성장
광범위한 IIoT 도입으로 실시간 데이터가 공급되고, 디지털 모델과 공장 현장의 동기화가 유지되고 있습니다. 지멘스는 2024년 Xcelerator 생태계의 강점을 바탕으로 디지털 사업 매출이 전년 대비 22% 증가한 90억 유로(97억 2,000만 달러)를 기록할 것으로 예상하고 있습니다. 하니웰의 Forge 플랫폼은 하루 30억 개 이상의 데이터 포인트를 처리하며, 고객 공장의 계획되지 않은 다운타임을 35%까지 줄였습니다. OPC UA 및 MQTT와 같은 표준화된 프로토콜은 통합 마찰을 줄이고, 공장이 몇 달이 아닌 몇 주 만에 디지털 트윈을 도입할 수 있게 해줍니다. 그 결과, 꾸준한 비용 절감, 신속한 근본 원인 분석, 보다 예측 가능한 용량 계획을 실현할 수 있습니다.
디바이스 레벨에서의 엣지/AI 추론 확대
분석 처리를 클라우드에서 엣지로 전환하여 지연을 줄이고 데이터 주권을 유지합니다. 마이크로소프트와 지멘스가 공동 개발한 산업용 기반 모델은 자산 수준에서 추론을 수행하여 이상 징후를 감지할 때 밀리초 단위의 응답을 가능하게 합니다. 아우디는 현재 엣지에 배치된 트윈을 통해 가상 PLC를 운영하여 실제 생산 라인의 사이클 타임 최적화를 실현하고 있습니다. 로컬 시뮬레이션에서는 예외 데이터만 업스트림로 전송되기 때문에 대역폭 소비도 억제됩니다. 전용 칩과 컨테이너화된 런타임은 2차 공급업체의 구축 비용을 더욱 절감하고, 가치사슬 전반에 걸쳐 AI 지원 트윈의 보급을 가속화하고 있습니다.
IT/OT 스택 전반의 사이버 물리 보안 취약성
스페인 국립사이버보안연구소는 IT와 OT를 연결하는 트윈이 공격 대상 영역을 확대하여 프로세스 컨트롤러를 데이터 무결성 위협에 노출시킨다고 지적했습니다. 최근 랜섬웨어 피해로 인해 제조업체는 트윈 데이터 레이크의 정화 작업을 위해 며칠간 생산 중단을 해야 했습니다. 제로 트러스트 아키텍처의 통합과 직원 교육으로 인해 평균 18개월의 도입 지연이 발생하고 있습니다. 멀티테넌트 트윈은 협업 속도를 저하시키지 않으면서 파트너 액세스를 세분화해야 하기 때문에 복잡성이 증가하고 있습니다.
부문 분석
2025년 제조업은 디지털 트윈 시장의 35.10%를 차지했습니다. 이는 임베디드 IIoT 센서, 예지보전 프로그램, 지속적 개선 문화에 기인합니다. 자동차 및 전자기기 공장에서는 라인 레벨의 디지털 트윈을 도입하여 택트타임 변동과 품질 및 수율 패턴을 분석하여 폐기율을 두 자릿수 단위로 감소시키고 있습니다. 특히 자원집약적인 야금, 시멘트 사업에서 에너지 효율 향상은 투자 회수 효과를 더욱 높일 수 있습니다. 이 부문은 꾸준히 성장하고 있으며, 타 산업이 추격해오는 상황에서도 물량적 우위를 유지할 것으로 예상됩니다.
석유 및 가스 분야는 현재 규모가 작지만, 해양 사업자의 원격 점검 및 고장 격리 기능에 대한 수요로 인해 2031년까지 CAGR 28.1%로 확대될 것으로 예상됩니다. 업스트림 부문에서는 지진 데이터와 생산 기록을 통합한 저류층 트윈을 도입하여 엔지니어가 시추 장비를 동원하기 전에 유정 개보수 시나리오를 시뮬레이션할 수 있도록 하고 있습니다. 미드스티림 기업에서는 파이프라인 트윈을 누출 감지에 활용하고 있으며, 다운스트림 정유사(예: 쉘)에서는 DNV 기준으로 검증된 트윈 기술을 통해 계획되지 않은 다운타임을 20% 줄인 사례가 있습니다. 정부의 탈탄소화 목표도 도입을 촉진하고 있으며, 트윈 기술은 플레어 최소화 및 열 통합 전략의 최적화에 기여합니다. 두 부문 모두 AI 지원 시나리오 테스트를 통해 트윈은 모니터링에서 의사결정 지원 시스템으로 진화하여 전체 도입 점유율을 확대하고 있습니다.
솔루션 카테고리(소프트웨어 플랫폼, 물리 엔진, 커넥티드 하드웨어)는 기업이 핵심 기능을 확보한 2025년 지출의 62.85%를 차지했습니다. 벤더들은 모델링 라이브러리를 시각화 엔진과 함께 번들로 제공하여 프로세스 엔지니어가 처음부터 코딩하지 않고도 복제본을 구축할 수 있도록 지원하고 있습니다. 라이선싱 모델은 사용량 기반 계층으로 이동하고 있으며, 티어2 공급업체 간의 접근을 확대하고 있습니다.
한편, 서비스 분야는 CAGR 30%로 빠르게 성장하고 있습니다. 도입 컨설팅에서는 데이터 파이프라인 조정, 의미론적 모델 구축, 시뮬레이션 정확도 검증을 수행합니다. 매니지드 서비스 계약은 트윈의 건전성 지표 모니터링, 패치 적용, 드리프트 방지 알고리즘 조정을 통해 자산 소유자에게 예측 가능한 운영 비용을 제공합니다. 성과 기반 계약이 확산되는 가운데(롤스로이스 토탈케어는 트윈 분석을 기반으로 엔진 가동률을 보장), 서비스 파트너는 더 많은 리스크를 감수하고, 청구 시간을 기준으로 하는 것이 아니라 효율성 향상에 연동된 요금 체계를 채택하고 있습니다. 이 모델은 고객 충성도를 강화하고 플랫폼의 지속적인 개선을 촉진합니다.
디지털 트윈 시장 보고서는 애플리케이션(제조업, 에너지/전력, 항공우주/방위 산업, 석유/가스, 자동차, 기타), 구성요소(솔루션/플랫폼, 서비스), 도입 형태(온프레미스, 클라우드), 기업 규모(대기업, 중소기업(SME)), 지역별로 분류되어 있습니다. 지역별로 분류되어 있습니다.
지역별 분석
북미는 인더스트리 4.0의 조기 도입, 대규모 항공우주 프로그램, 산업용 SaaS에 대한 견조한 벤처 자금 조달을 배경으로 2025년 디지털 트윈 시장 매출의 37.95%를 차지할 것으로 예상됩니다. 미국 항공 규제 당국의 시뮬레이션 기반 인증 승인은 항공기 OEM 및 티어1 공급업체들의 광범위한 트윈 투자를 촉진하고 있습니다. 캐나다와 미국의 에너지 대기업들은 강화되는 환경 정책에 따라 메탄 누출률을 낮추기 위해 파이프라인과 LNG 터미널의 트윈화를 도입하고 있습니다. 사이버 보험의 성숙한 프레임워크와 표준화된 데이터 보호 의무로 인해 클라우드 도입이 특히 활발히 진행되고 있습니다.
아시아태평양은 정부 주도의 대형 프로젝트에 힘입어 26.0%의 가장 높은 CAGR을 기록했습니다. 중국의 '디지털 중국 건설 계획'은 신규 인프라에 도시 디지털 트윈 구축을 의무화하여 국내외 벤더를 위한 대형 조달 프로젝트를 창출하고 있습니다. 인도의 'Sangam 디지털 트윈 계획'은 전국적인 통신망 업그레이드에 네트워크 트윈 기능을 통합하여 5G 대응을 위한 전국적인 통신망 업그레이드를 추진하고 있습니다. 일본의 NTT 디지털 트윈 컴퓨팅 이니셔티브는 교통 및 재난 대응 알고리즘에 정보를 제공하는 도시 규모의 복제를 지원합니다. 한국과 싱가포르는 스마트공장-스마트항만 시범사업을 추진하고 있으며, 실시간 탄소발자국 추적을 중요시하고 있습니다. 이 지역의 공급망 중심성으로 인해 이곳에서 얻은 지식은 전 세계 OEM 제조업체에 빠르게 전파될 수 있습니다.
유럽에서는 규제 요건이 핵심 과제로 떠오르며 꾸준히 발전하고 있습니다. 디지털 제품 패스포트는 제조사가 제품 라이프사이클 전반에 걸쳐 이력추적성을 의무적으로 도입해야 하며, 사실상 대량 생산품에 경량화 트윈을 의무적으로 도입해야 합니다. 독일의 '인더스트리 4.0 플랫폼'은 표준화된 관리 쉘 가이드라인을 제공하여 중소기업의 통합 부담을 덜어주고 있습니다. 프랑스는 해군 건조의 경쟁 우위를 유지하기 위해 가상 조선소 트윈에 투자하고 있으며, 북유럽 국가들은 건축 트윈을 활용하여 넷제로 기준을 달성하고 있습니다. 중동 및 아프리카는 미성숙하지만 유망합니다: UAE와 사우디아라비아는 대규모 확장에 앞서 효율성과 지속가능성의 이점을 추구하기 위해 유전 트윈과 거대 프로젝트 도시 트윈의 시범 사업을 시행하고 있습니다.
기타 특전:
- 엑셀 형식의 시장 예측(ME) 시트
- 애널리스트의 3개월간 지원
자주 묻는 질문
목차
제1장 소개
제2장 조사 방법
제3장 주요 요약
제4장 시장 구도
제5장 시장 세분화
제6장 경쟁 구도
제7장 시장 기회와 향후 전망
KSM 26.03.09The digital twin market was valued at USD 36.19 billion in 2025 and estimated to grow from USD 49.2 billion in 2026 to reach USD 228.46 billion by 2031, at a CAGR of 35.95% during the forecast period (2026-2031).
Tailwinds include the maturation of industrial IoT platforms, wider edge-AI deployment, and regulatory requirements for safety-critical infrastructure. Manufacturing remains the largest application thanks to established smart-factory investments, while Oil and Gas shows the strongest growth as producers seek asset-integrity gains in harsh operating conditions. Regionally, North America retains the lead, but Asia-Pacific is closing the gap as public programs in China, India, and Japan channel funding toward large-scale digitalization. Solutions account for most spending today, yet services are scaling quickly as firms seek integration expertise. Cloud deployment is growing faster than on-premises, signaling rising confidence in remote data-management safeguards and scalable architectures. Cyber-security gaps and scarce physics-based modeling talent temper the growth outlook, though they have not altered the primary trajectory of adoption.
Global Digital Twin (DT) Market Trends and Insights
Rapid growth of industrial IoT platforms
Widespread IIoT deployment supplies real-time data that keeps digital models synchronized with factory floors. Siemens reported EUR 9 billion (USD 9.72 billion) digital business revenue in 2024, up 22% on the strength of its Xcelerator ecosystem. Honeywell's Forge platform processes 3 billion+ datapoints daily, cutting unplanned downtime by 35% in client plants. Standardized protocols such as OPC UA and MQTT reduce integration friction, enabling plants to deploy twins in weeks rather than months. The result is steady cost avoidance, quicker root-cause analysis, and more predictable capacity planning.
Expansion of edge/AI inference at the device level
Moving analytics from cloud to edge trims latency and preserves data sovereignty. Microsoft and Siemens co-developed Industrial Foundation Models that run inference at the asset, allowing millisecond-level responses for anomaly detection. Audi now operates virtual PLCs through edge-deployed twins that optimize cycle times in real manufacturing lines. Local simulation also limits bandwidth consumption because only exception of data moves upstream. Specialized chips and containerized runtimes further cut deployment costs for tier-two suppliers, accelerating the spread of AI-ready twins throughout value chains.
Cyber-physical security vulnerabilities across IT/OT stacks
The Spanish National Cybersecurity Institute notes that twins bridging IT and OT widen attack surfaces, exposing process controllers to data-integrity threats. Recent ransomware events forced manufacturers to halt production for days while cleansing twin data lakes. Average deployment delays of 18 months arise as firms integrate zero-trust architectures and train staff. Multi-tenant twins add complexity because partner access must be segmented without slowing collaboration.
Other drivers and restraints analyzed in the detailed report include:
- Regulatory push for asset-intensive industries to digitise safety-critical infrastructure
- Demand for virtual commissioning to cut CAPEX
- Shortage of domain-specific physics-based modelling expertise
For complete list of drivers and restraints, kindly check the Table Of Contents.
Segment Analysis
Manufacturing contributed 35.10% of the digital twin market in 2025 thanks to embedded IIoT sensors, predictive maintenance programs, and continuous-improvement cultures. Automotive and electronics plants deploy line-level twins to analyze takt-time fluctuations and quality-yield patterns, trimming scrap rates by double digits. Energy-efficiency gains add another payback layer, particularly in resource-intensive metallurgy and cement operations. The segment is forecast to expand steadily, preserving its quantitative edge even as other verticals catch up.
Oil and Gas, though smaller today, is projected to grow at a 28.1% CAGR to 2031 as offshore operators require remote inspection and fault-isolation capabilities. The upstream segment deploys reservoir twins that integrate seismic data and production logs, allowing engineers to simulate well-workover scenarios before mobilizing rigs. Midstream companies apply pipeline twins for leak detection, while downstream refineries like Shell have documented 20% unplanned downtime reductions using twins verified by DNV standards. Government decarbonization targets further propel adoption as twins optimize flare minimization and heat-integration strategies. Across both segments, AI-assisted scenario testing elevates twins from monitoring to decision-support systems, reinforcing their share of total deployments.
The solutions category-software platforms, physics engines, and connected hardware-accounted for 62.85% of spending in 2025 as companies acquired core capabilities. Vendors bundle modeling libraries with visualization engines so process engineers can assemble replicas without coding from scratch. Licensing models are shifting to consumption-based tiers, broadening access among tier-two suppliers.
Services, however, are scaling faster at a 30% CAGR. Implementation consultancies align data pipelines, create semantic models, and validate simulation fidelity. Managed-service contracts monitor twin health metrics, apply patches, and tune algorithms for drift, yielding predictable OPEX for asset owners. As outcome-based agreements proliferate-Rolls-Royce TotalCare guarantees engine uptime backed by twin analytics-service partners assume more risk, tying fees to efficiency gains rather than billable hours. This model strengthens customer loyalty and encourages continuous platform enhancements.
The Digital Twin Market Report is Segmented by Application (Manufacturing, Energy and Power, Aerospace and Defense, Oil and Gas, Automotive, and Others), Component (Solutions/Platforms, and Services), Deployment Mode (On-Premises, and Cloud), Enterprise Size (Large Enterprises, and Small and Medium Enterprises (SMEs)), and Geography.
Geography Analysis
North America commanded 37.95% of digital twin market revenue in 2025 driven by early Industry 4.0 rollouts, extensive aerospace programs, and robust venture funding for industrial SaaS. U.S. aviation regulators' acceptance of simulation-based certification has spurred widespread twin investment among aircraft OEMs and Tier-1 suppliers. Energy majors in Canada and the United States deploy pipeline and LNG terminal twins to cut methane leak rates, aligning with tightening environmental policy. Cloud adoption is particularly strong due to mature cyber-insurance frameworks and standardized data-protection mandates.
Asia-Pacific posts the highest CAGR at 26.0%, supported by government megaprojects. China's Digital China Construction plan mandates urban digital twins for new infrastructure, creating large procurement pipelines for domestic and foreign vendors. India's Sangam Digital Twin scheme integrates network twin capability into nationwide telecom upgrades as the country moves toward 6G readiness. Japan's NTT Digital Twin Computing Initiative supports city-scale replicas that feed transportation and disaster-response algorithms. South Korea and Singapore push smart-factory and smart-port pilots, emphasizing real-time carbon-footprint tracking. The region's supply-chain centrality means lessons learned here propagate quickly to global OEMs.
Europe advances steadily as regulatory imperatives take center stage. The digital product passport forces manufacturers to embed traceability across product life cycles, effectively making a lightweight twin mandatory for high-volume goods. Germany's Plattform Industrie 4.0 provides standardized administration shell guidelines, reducing integration overhead for SMEs. France invests in virtual shipyard twins to maintain competitive edge in naval construction, while the Nordics use building twins to meet net-zero codes. The Middle East and Africa remain nascent but promising: the UAE and Saudi Arabia are piloting oil-field twins and giga-project city twins, seeking efficiency and sustainability benefits prior to large-scale expansion.
- ANSYS, Inc.
- AVEVA Group plc
- Bentley Systems, Incorporated
- Cal-Tek S.R.L.
- Cityzenith, Inc.
- Dassault Systemes SE
- General Electric Company
- Hexagon AB
- International Business Machines Corporation
- Lanner Group Limited (Royal HaskoningDHV)
- Mevea Ltd.
- Microsoft Corporation
- Oracle Corporation
- PTC Inc.
- Rescale, Inc.
- Robert Bosch GmbH (Bosch.IO)
- SAP SE
- Schneider Electric SE
- Siemens AG
- Amazon Web Services, Inc.
Additional Benefits:
- The market estimate (ME) sheet in Excel format
- 3 months of analyst support
TABLE OF CONTENTS
1 INTRODUCTION
- 1.1 Study Assumptions and Market Definition
- 1.2 Scope of the Study
2 RESEARCH METHODOLOGY
3 EXECUTIVE SUMMARY
4 MARKET LANDSCAPE
- 4.1 Market Overview
- 4.2 Market Drivers
- 4.2.1 Rapid growth of industrial IoT platforms
- 4.2.2 Expansion of edge/AI inference at the device level
- 4.2.3 Regulatory push for asset-intensive industries to digitise safety-critical infrastructure
- 4.2.4 Demand for virtual commissioning to cut CAPEX in brownfield projects
- 4.2.5 Rise of outcome-based service contracts needing real-time asset replica data
- 4.2.6 Proliferation of digital product passports in EU and U.S.
- 4.3 Market Restraints
- 4.3.1 Cyber-physical security vulnerabilities across IT/OT stacks
- 4.3.2 Shortage of domain-specific physics-based modelling expertise
- 4.3.3 Opaque IP ownership of data generated in federated twins
- 4.3.4 Fragmentation of simulation standards limiting interoperability
- 4.4 Evaluation of Critical Regulatory Framework
- 4.5 Value Chain Analysis
- 4.6 Technological Outlook
- 4.7 Porter's Five Forces
- 4.7.1 Bargaining Power of Suppliers
- 4.7.2 Bargaining Power of Buyers
- 4.7.3 Threat of New Entrants
- 4.7.4 Threat of Substitutes
- 4.7.5 Competitive Rivalry
- 4.8 Impact Assessment of Key Stakeholders
- 4.9 Key Use Cases and Case Studies
- 4.10 Impact on Macroeconomic Factors of the Market
- 4.11 Investment Analysis
5 MARKET SEGMENTATION
- 5.1 By Application
- 5.1.1 Manufacturing
- 5.1.2 Energy and Power
- 5.1.3 Aerospace and Defense
- 5.1.4 Oil and Gas
- 5.1.5 Automotive
- 5.1.6 Others
- 5.2 By Component
- 5.2.1 Solutions/Platforms
- 5.2.2 Services
- 5.3 By Deployment Mode
- 5.3.1 On-premises
- 5.3.2 Cloud
- 5.4 By Enterprise Size
- 5.4.1 Large Enterprises
- 5.4.2 Small and Medium Enterprises (SMEs)
- 5.5 By Geography
- 5.5.1 North America
- 5.5.1.1 United States
- 5.5.1.2 Canada
- 5.5.1.3 Mexico
- 5.5.2 South America
- 5.5.2.1 Brazil
- 5.5.2.2 Argentina
- 5.5.2.3 Rest of South America
- 5.5.3 Europe
- 5.5.3.1 United Kingdom
- 5.5.3.2 Germany
- 5.5.3.3 France
- 5.5.3.4 Italy
- 5.5.3.5 Spain
- 5.5.3.6 Nordics
- 5.5.3.7 Rest of Europe
- 5.5.4 Middle East and Africa
- 5.5.4.1 Middle East
- 5.5.4.1.1 Saudi Arabia
- 5.5.4.1.2 United Arab Emirates
- 5.5.4.1.3 Turkey
- 5.5.4.1.4 Rest of Middle East
- 5.5.4.2 Africa
- 5.5.4.2.1 South Africa
- 5.5.4.2.2 Egypt
- 5.5.4.2.3 Nigeria
- 5.5.4.2.4 Rest of Africa
- 5.5.4.1 Middle East
- 5.5.5 Asia-Pacific
- 5.5.5.1 China
- 5.5.5.2 India
- 5.5.5.3 Japan
- 5.5.5.4 South Korea
- 5.5.5.5 ASEAN
- 5.5.5.6 Australia
- 5.5.5.7 New Zealand
- 5.5.5.8 Rest of Asia-Pacific
- 5.5.1 North America
6 COMPETITIVE LANDSCAPE
- 6.1 Market Concentration
- 6.2 Strategic Moves
- 6.3 Market Share Analysis
- 6.4 Company Profiles (includes Global level Overview, Market level overview, Core Segments, Financials as available, Strategic Information, Market Rank/Share for key companies, Products and Services, and Recent Developments)
- 6.4.1 ANSYS, Inc.
- 6.4.2 AVEVA Group plc
- 6.4.3 Bentley Systems, Incorporated
- 6.4.4 Cal-Tek S.R.L.
- 6.4.5 Cityzenith, Inc.
- 6.4.6 Dassault Systemes SE
- 6.4.7 General Electric Company
- 6.4.8 Hexagon AB
- 6.4.9 International Business Machines Corporation
- 6.4.10 Lanner Group Limited (Royal HaskoningDHV)
- 6.4.11 Mevea Ltd.
- 6.4.12 Microsoft Corporation
- 6.4.13 Oracle Corporation
- 6.4.14 PTC Inc.
- 6.4.15 Rescale, Inc.
- 6.4.16 Robert Bosch GmbH (Bosch.IO)
- 6.4.17 SAP SE
- 6.4.18 Schneider Electric SE
- 6.4.19 Siemens AG
- 6.4.20 Amazon Web Services, Inc.
7 MARKET OPPORTUNITIES AND FUTURE OUTLOOK
- 7.1 White-space and Unmet-need Assessment