|
시장보고서
상품코드
1851978
아시아태평양의 규사 시장 : 시장 점유율 분석, 산업 동향, 통계, 성장 예측(2025-2030년)Asia-Pacific Silica Sand - Market Share Analysis, Industry Trends & Statistics, Growth Forecasts (2025 - 2030) |
||||||
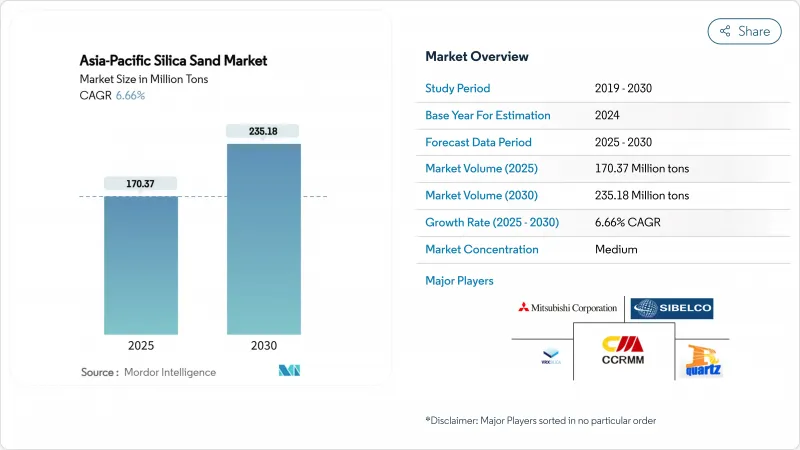
아시아태평양의 규사 시장 규모는 2025년에 1억 7,037만 톤으로 추정되고, 2030년에는 2억 3,518만 톤에 이를 것으로 예측되며, 예측 기간(2025-2030년) CAGR 6.66%로 성장할 전망입니다.

유리제조, 전자공학, 주조 용도, 건축 재료 등 여러 수요 센터가 이 확대를 유지하기 위해 집결하고 있습니다. 이 지역의 급속한 도시화 및 자동차 생산과 함께, 판유리와 용기 유리의 생산량이 증가하고 있기 때문에 유리용 모래는 여전히 주력 제품이 되고 있습니다. 동시에 초고순도 석영(HPQ) 등급은 반도체 제조업체가 3나노미터 이하의 설계 규칙을 추진함에 따라 틈새에서 주류로 전환하고 있습니다. 대기업 종합 광산 회사가 프리미엄 계약을 획득하기 위해 자동화와 환경 컴플라이언스를 가속화하는 반면, 소규모 광산 회사는 규제 강화에 대응하기 위해 고투하고 있기 때문에 경쟁의 치열성이 증가하고 있습니다. 중기 비즈니스 기회는 태양 유리, 첨단 전자 및 동남 아시아 전역에서 장거리 공급 계약을 체결하는 국경을 넘어 인프라 프로젝트에 집중하고 있습니다.
아시아태평양의 규사 시장 동향 및 인사이트
건설용 판유리 및 용기 유리 수요 급증
태국의 동부경제회랑은 2026년까지 연률 3-4%의 건설 성장을 견인해 공공 공사, 상업 시설, 주택용 타워 등의 판유리 및 용기 유리에 대한 수요를 높이고 있습니다. 유리 제조업체는 규사를 원재료 비용의 60% 이상 중요한 비용으로 취급하고 있기 때문에 프로젝트의 수주 잔여 증가는 규사의 상승에 직결됩니다. 2024년의 이익을 악화시킨 재고 조정은 벌써 역전해, ASEAN의 대부분의 제조업체가 2025년 납품분의 주문서가 충실하고 있다고 보고하고 있습니다. ASEAN 연결 비전을 기반으로 한 국경을 넘어서는 인프라 회랑은 말레이시아와 호주에서 중국 내륙부의 플로트 유리 라인으로의 장거리 수송을 촉진하여 유리한 경로의 수송 능력을 강화하고 있습니다. 유리의 생산량은 경제활동에 6-12개월 지연으로 추종하는 것을 고려하면, 이 회복은 적어도 2027년까지 명확한 양적 여지를 나타냅니다. 에너지 효율이 낮은 저철 유리는 그린 빌딩 공정에서 글레이징 기준을 박형화할 수 있어 추가 프리미엄을 확보할 수 있습니다.
EV 및 풍력 발전 주조의 주조 부활
전기자동차의 주조 기술에서는 열팽창 대역이 좁게 지정되는 경우가 많아 파운드리는 입도 분포가 좁고 교정된 규사 블렌드를 요구하게 되었습니다. 2024년에는 세계 생산량의 70%를 차지하는 중국의 청정 에너지 주도로 알루미늄 주조와 덕타일 주철 주조가 활발해졌고, 작년에는 지역 전체에서 약 910만 톤의 주물 모래가 소비되었습니다. 첨단 주조 기계를 보유한 일본과 한국은 태국과 베트남에 턴키 주조 라인을 수출하고 있으며 고급 모래 등급의 지역 수요를 촉진하고 있습니다. 이 효과는 복건성, 제주도, 세부 섬에 집중하는 풍력 터빈 허브를 통해 체인하고, 최종 기계 가공 주물은 나셀 하우징과 허브 어셈블리에 대량의 실리카를 흡수합니다. 2024년에는 2,350억 달러 상당의 투자 파이프라인이 청정 에너지 제조업을 대상으로 하고 있으며, 2030년까지 지속적인 모래 유입을 시사하고 있습니다. 열 충격 성능과 치수 정밀도를 입증하는 생산자는 배터리 및 터빈 OEM에서 다년간 공급 계약을 받았습니다.
불법 및 무규제 모래 채굴 억제
특히 인도에서는 5,200만 명의 근로자가 실리카 먼지에 노출되어 철저한 안전보건 개혁에 박차를 가하고 있습니다. 흡입성 결정질 실리카의 노출 한계치(50마이크로그램/m3)가 새롭게 설정되어, 습식 스크러빙이나 밀폐식 컨베이어 등의 설비 개량이 의무화되었습니다. 중국에서는 당국이 수천 개의 소규모 라이선스를 취소하고 중앙 관리를 통한 할당을 통해 2025년 공급 부족 예측을 63%에서 4%로 줄였습니다. 이러한 단속은 저비용의 경쟁을 배제하는 것이지만, 현지 공급력을 강화하기 위해 시장 경쟁이 더욱 격화되고, 보다 고비용의 생산물에 대한 의존이 강하게 됩니다. 가격 변동은 이미 비공식 스팟 카고와 계약 등급 공급 사이에서 확대되고 있습니다.
부문 분석
유리 등급은 2024년 출하량의 64.36%를 차지하였고, 아시아태평양 규사 시장의 핵심 역할을 명확히 했습니다. 하이퍼 HPQ는 현재는 적은 수량에 불과하지만 CAGR 11.29%로 성장을 지속하고, 2025년 이후 아시아태평양의 규사 시장 규모에서 차지하는 비율을 높일 것으로 예측됩니다.
공급의 안전성은 자동 선광 라인, 광학 선별, 환경 기준을 충족하는 청정 에너지 가마로의 전환에 달려 있습니다. 원자력 수준의 순도를 입증할 수 있는 생산자는 반도체 체인에 진입하고 중견 공급업체는 태양전지와 광학을 타겟으로 합니다. 중순도의 인도네시아산 원료를 일본의 화학침출법으로 업그레이드하는 블렌드 전략이 대두되고 있어, 그린필드 개발 없이 마진을 획득할 수 있는 협력 체제를 나타내고 있습니다.
아시아태평양의 규사 보고서는 등급별(주조 및 제강 등급, 유리 등급 모래, 광학 유리 등급, 기타), 최종 사용자 산업별(유리 제조, 주조, 화학 생산, 건설, 기타), 지역별(중국, 인도, 일본, 한국, 인도네시아, 태국, 말레이시아, 싱가포르, 필리핀, 베트남, 기타 아시아태평양)로 구분되고 있습니다. 시장 예측은 수량(백만 톤)으로 제공됩니다.
기타 혜택 :
- 엑셀 형식 시장 예측(ME) 시트
- 3개월간의 애널리스트 서포트
목차
제1장 서론
- 조사의 전제조건 및 시장 정의
- 조사 범위
제2장 조사 방법
제3장 주요 요약
제4장 시장 상황
- 시장 개요
- 시장 성장 촉진요인
- 건설 주도의 판유리 및 용기 유리 수요 급증
- EV 및 풍력 발전용 주조품의 주조 부활
- ASEAN 전역에서 급속한 인프라 투자
- 에너지 효율이 높은 저철 태양 유리로의 이동
- 인도네시아 반도체용 실리카 하류사업
- 시장 성장 억제요인
- 불법 및 무규제의 모래 채굴의 억제
- 모래를 사용하지 않는 인공 건재에 의한 대체
- 정부에 의한 소규모 광산의 통폐합(라이선스 취소)
- 밸류체인 분석
- Porter's Five Forces 분석
- 공급기업의 협상력
- 구매자의 협상력
- 신규 참가업체의 위협
- 대체품의 위협
- 경쟁 정도
제5장 시장 규모 및 성장 예측
- 등급별
- 주조 및 제강 등급
- 유리 등급 샌드
- 광학 유리 등급
- 중간체 HPQ
- 초고순도 HPQ
- 하이퍼 HPQ
- 최종 사용자 업계별
- 유리 제조
- 파운드리
- 화학생산
- 건설
- 페인트 및 코팅
- 세라믹 및 내화물
- 여과
- 석유 및 가스
- 기타 최종 사용자 산업
- 지역별
- 중국
- 인도
- 일본
- 한국
- 인도네시아
- 태국
- 말레이시아
- 싱가포르
- 필리핀
- 베트남
- 기타 아시아태평양
제6장 경쟁 구도
- 시장 집중도
- 전략적인 동향(M&A, JV, 능력 증강)
- 시장 점유율(%)** 및 랭킹 분석
- 기업 프로파일
- Chongqing Changjiang River Moulding Material Group Co., Ltd.
- Covia Holdings LLC
- Diatreme Resources Limited
- Imerys
- JFE Mineral & Alloy Company,Ltd
- Mangal Minerals
- Mitsubishi Corporation
- Raghav Productivity Enhancers Limited
- Sibelco
- Tochu Corporation
- Tosoh Silica Corporation
- VRX Silica
- Xinyi Golden Ruite Quartz Materials Co., Ltd
- Xinyi Solar Holdings Limited
제7장 시장 기회 및 향후 전망
AJY 25.11.26The Asia-Pacific Silica Sand Market size is estimated at 170.37 million tons in 2025, and is expected to reach 235.18 million tons by 2030, at a CAGR of 6.66% during the forecast period (2025-2030).
Multiple demand centers, including glass manufacturing, electronics, foundry applications, and construction materials, are converging to sustain this expansion. Glass grade sand remains the workhorse because flat and container glass output tracks the region's rapid urbanization and vehicle production. At the same time, hyper-purity quartz (HPQ) grades are transitioning from a niche toward mainstream status as semiconductor manufacturers push below the 3-nanometer design rule. Competitive intensity is rising as large, integrated miners accelerate automation and environmental compliance to lock in premium contracts while smaller operators struggle to meet tightening regulations. Mid-term opportunities cluster around solar glass, advanced electronics, and cross-border infrastructure projects that lock in long-haul supply contracts across Southeast Asia.
Asia-Pacific Silica Sand Market Trends and Insights
Construction-Led Flat and Container Glass Demand Surge
Thailand's Eastern Economic Corridor is driving 3-4% annual construction growth through 2026, lifting demand for flat and container glass across public works, commercial complexes, and residential towers. Glass manufactures treat silica sand as an essential cost component, often exceeding 60% of raw-material expenses, so rising project backlogs translate directly into higher sand uplift. Inventory corrections that hurt 2024 margins have already reversed, with most ASEAN producers reporting fuller order books for 2025 delivery. Cross-border infrastructure corridors under the ASEAN Connectivity vision are boosting long-distance shipments from Malaysia and Australia to inland Chinese float-glass lines, tightening freight capacity on favored routes. Given that glass output trails economic activity with a 6- to 12-month lag, the rebound indicates a clear volume runway through at least 2027. Energy-efficient low-iron variants secure additional premiums because they enable thinner glazing standards in green-building codes.
Foundry Revival for EV and Wind-Power Castings
Electric-vehicle casting technology increasingly specifies narrow thermal-expansion bands, pushing foundries toward calibrated silica sand blends with tighter grain-size distributions. China's clean-energy leadership, 70% of global output in 2024, created a lift in aluminum and ductile-iron casting that consumed roughly 9.1 million tons of foundry sand region-wide last year. Japan and South Korea, home to advanced molding machinery, are exporting turnkey foundry lines into Thailand and Vietnam, prompting localized demand for premium sand grades. The effect cascades through wind-turbine hubs clustered in Fujian, Jeju, and Cebu, where final-machined castings absorb high silica volumes for nacelle housings and hub assemblies. Investment pipelines worth USD 235 billion in 2024 targeted clean-energy manufacturing, signalling durable sand flows into 2030. Producers that certify thermal-shock performance and dimensional accuracy are capturing multiyear supply contracts from battery and turbine OEMs.
Illegal and Unregulated Sand Mining Curbs
Rising enforcement is shrinking unregistered output across riverine deposits, especially in India, where the estimated 52 million-worker cohort exposed to silica dust has spurred sweeping health-and-safety reforms. New exposure limits - 50 µg/m3 for respirable crystalline silica mandate capital upgrades like wet-scrubbing and enclosed conveyors, adding 4-6% to mining opex for compliant operators. In China, authorities canceled thousands of small-scale licenses, reducing projected 2025 supply gaps from 63% to 4% through centrally managed quotas. Such crackdowns eliminate low-cost competition but tighten local availability, reinforcing the Asia-Pacific silica sand market's reliance on compliant, higher-cost output. Price volatility has already widened between informal spot cargoes and contract-grade supplies.
Other drivers and restraints analyzed in the detailed report include:
- Rapid Infrastructure Spending Across ASEAN
- Indonesia's Silica Downstreaming for Semiconductors
- Substitution by Engineered, Sand-Free Building Materials
For complete list of drivers and restraints, kindly check the Table Of Contents.
Segment Analysis
The glass grade segment captured 64.36% of 2024 shipments, underscoring its role as the backbone of the Asia-Pacific silica sand market. Hyper HPQ, though only a sliver of volume today, is projected to post an 11.29% CAGR, raising its stake in the Asia-Pacific silica sand market size from 2025 onward.
Supply security hinges on automated beneficiation lines, optical sorting, and clean-energy kiln conversions that meet environmental benchmarks. Producers able to certify nuclear-level purity enter the semiconductor chain, while mid-tier suppliers target solar and optics. Blending strategies are emerging, where moderate-purity Indonesian feedstock is upgraded via Japanese chemical leaching, showing how collaboration can capture margin without greenfield development.
The Asia-Pacific Silica Sand Report is Segmented by Grade (Foundry/Smelter Grade, Glass Grade Sand, Optical Glass Grade, and More), End-User Industry (Glass Manufacturing, Foundry, Chemical Production, Construction, and More), and Geography (China, India, Japan, South Korea, Indonesia, Thailand, Malaysia, Singapore, Philippines, Vietnam, and Rest of Asia-Pacific). The Market Forecasts are Provided in Terms of Volume (Million Tons).
List of Companies Covered in this Report:
- Chongqing Changjiang River Moulding Material Group Co., Ltd.
- Covia Holdings LLC
- Diatreme Resources Limited
- Imerys
- JFE Mineral & Alloy Company,Ltd
- Mangal Minerals
- Mitsubishi Corporation
- Raghav Productivity Enhancers Limited
- Sibelco
- Tochu Corporation
- Tosoh Silica Corporation
- VRX Silica
- Xinyi Golden Ruite Quartz Materials Co., Ltd
- Xinyi Solar Holdings Limited
Additional Benefits:
- The market estimate (ME) sheet in Excel format
- 3 months of analyst support
TABLE OF CONTENTS
1 Introduction
- 1.1 Study Assumptions and Market Definition
- 1.2 Scope of the Study
2 Research Methodology
3 Executive Summary
4 Market Landscape
- 4.1 Market Overview
- 4.2 Market Drivers
- 4.2.1 Construction-led flat and container glass demand surge
- 4.2.2 Foundry revival for EV and wind-power castings
- 4.2.3 Rapid infrastructure spending across ASEAN
- 4.2.4 Shift to energy-efficient low-iron solar glass
- 4.2.5 Indonesia's silica downstreaming for semiconductors
- 4.3 Market Restraints
- 4.3.1 Illegal and unregulated sand mining curbs
- 4.3.2 Substitution by engineered, sand-free building materials
- 4.3.3 Government drive to consolidate small mines (license cancellations)
- 4.4 Value Chain Analysis
- 4.5 Porter's Five Forces Analysis
- 4.5.1 Bargaining Power of Suppliers
- 4.5.2 Bargaining Power of Buyers
- 4.5.3 Threat of New Entrants
- 4.5.4 Threat of Substitutes
- 4.5.5 Degree of Competition
5 Market Size and Growth Forecasts (Volume)
- 5.1 By Grade
- 5.1.1 Foundry/Smelter Grade
- 5.1.2 Glass Grade Sand
- 5.1.3 Optical Glass Grade
- 5.1.4 Intermediate HPQ
- 5.1.5 Ultra High HPQ
- 5.1.6 Hyper HPQ
- 5.2 By End-user Industry
- 5.2.1 Glass Manufacturing
- 5.2.2 Foundry
- 5.2.3 Chemical Production
- 5.2.4 Construction
- 5.2.5 Paints and Coatings
- 5.2.6 Ceramics and Refractories
- 5.2.7 Filtration
- 5.2.8 Oil and Gas
- 5.2.9 Other End-user Industries
- 5.3 By Geography
- 5.3.1 China
- 5.3.2 India
- 5.3.3 Japan
- 5.3.4 South Korea
- 5.3.5 Indonesia
- 5.3.6 Thailand
- 5.3.7 Malaysia
- 5.3.8 Singapore
- 5.3.9 Philippines
- 5.3.10 Vietnam
- 5.3.11 Rest of Asia-Pacific
6 Competitive Landscape
- 6.1 Market Concentration
- 6.2 Strategic Moves (Mergers and Acquisitions, JVs, Capacity Expansions)
- 6.3 Market Share (%)**/Ranking Analysis
- 6.4 Company Profiles (includes Global level Overview, Market level overview, Core Segments, Financials as available, Strategic Information, Market Rank/Share for key companies, Products and Services, and Recent Developments)
- 6.4.1 Chongqing Changjiang River Moulding Material Group Co., Ltd.
- 6.4.2 Covia Holdings LLC
- 6.4.3 Diatreme Resources Limited
- 6.4.4 Imerys
- 6.4.5 JFE Mineral & Alloy Company,Ltd
- 6.4.6 Mangal Minerals
- 6.4.7 Mitsubishi Corporation
- 6.4.8 Raghav Productivity Enhancers Limited
- 6.4.9 Sibelco
- 6.4.10 Tochu Corporation
- 6.4.11 Tosoh Silica Corporation
- 6.4.12 VRX Silica
- 6.4.13 Xinyi Golden Ruite Quartz Materials Co., Ltd
- 6.4.14 Xinyi Solar Holdings Limited
7 Market Opportunities and Future Outlook
- 7.1 White-space and Unmet-need Assessment