


|
시장보고서
상품코드
1852166
나노 재료 : 시장 점유율 분석, 산업 동향, 통계, 성장 예측(2025-2030년)Nanomaterials - Market Share Analysis, Industry Trends & Statistics, Growth Forecasts (2025 - 2030) |
||||||
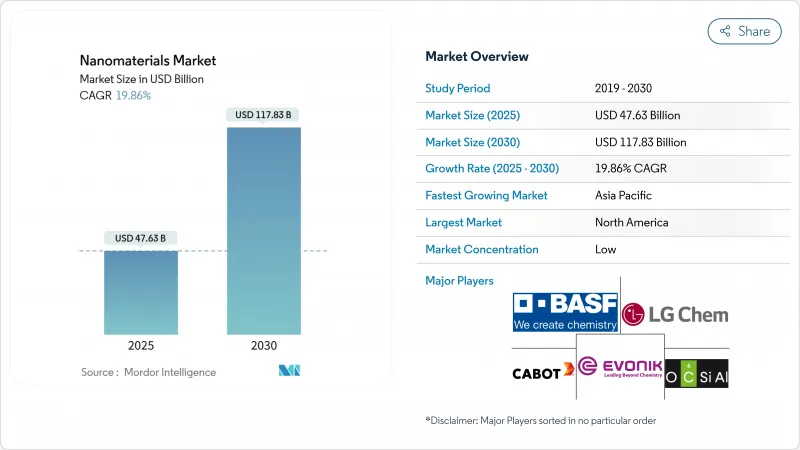
나노 재료 시장 규모는 2025년에 476억 3,000만 달러로 평가되었고, 예측 기간(2025-2030년)의 CAGR은 19.86%를 나타낼 것으로 예측되며, 2030년에 1,178억 3,000만 달러에 달할 전망입니다.
이러한 급격한 상승세는 반도체 연마, mRNA 기반 치료제, 플렉서블 디스플레이, 고효율 수처리 분야에서의 상업적 채택 급증을 반영합니다. 3nm 미만의 지속적인 노드 이동, 기록적인 백신 연구개발 예산, 물 부족 지역의 담수화 시설 확충이 나노 재료 시장에 새로운 동력을 제공하고 있습니다. 탄소 나노튜브 및 그래핀 유도체의 생산 규모 확대는 비용 절감 학습 곡선을 가속화하고 있으며, 공공 부문 나노기술 프로그램은 플랫폼 혁신의 꾸준한 공급망을 뒷받침하고 있습니다. 그럼에도 불구하고 시장은 귀금속 원료의 변동성을 흡수하고, 소규모 진입업체들이 경쟁하기 위해 필요한 원자층 증착 라인의 높은 자본 비용을 억제해야 합니다.
세계의 나노 재료 시장 동향 및 인사이트
아시아 신규 반도체 공장 증가로 반도체 등급 나노 슬러리 수요 급증
아시아 지역의 반도체 제조 시설 확대로 화학적 기계적 평탄화(CMP) 공정에 필수적인 고순도 나노 슬러리에 대한 수요가 전례 없이 증가하고 있습니다. 이 재료들은 3나노미터 이하의 첨단 노드 반도체 제조를 위한 초정밀 연마를 가능하게 합니다. 단일 첨단 팹은 연간 300톤 이상의 나노 슬러리를 소비할 수 있으며, 칩 아키텍처가 더욱 복잡해짐에 따라 수요는 증가하고 있습니다. 또한 TSMC의 400억 달러 규모 애리조나 팹 단지는 아시아를 넘어 새로운 수요 중심지를 창출하고 있습니다.
mRNA 생산 능력 확대로 인한 지질 나노입자 수요
mRNA 백신 및 치료제 응용의 급증에 힘입어 지질 나노입자(LNP) 제조 시장은 폭발적인 성장을 보이고 있습니다. 북미가 LNP 시장을 주도하고 있지만, 유럽 생산 능력에 대한 상당한 투자가 이루어지며 꾸준히 격차를 좁혀가고 있습니다. LNP는 기존의 백신 용도를 넘어 현재 유전자 치료 및 암 치료 분야로 진출하고 있습니다. 최근 혁신은 AI를 활용하여 LNP 제형을 미세 조정함으로써 효능을 높이고 부작용을 최소화하는 것을 목표로 하고 있습니다.
기술비용 상승
탄소 나노튜브와 반도체 등급 금속 산화물의 배치 수율은 여전히 반응기 가동 시간과 에너지 집약도에 민감합니다. 연간 수킬로톤 규모의 생산 능력에서도 단위 생산 비용은 기존 벌크 필러보다 5-10배 높아, 일반 플라스틱과 같은 가격 탄력성 높은 응용 분야에서의 채택을 제한하고 있습니다.
부문 분석
나노입자는 2024년 나노 재료 시장 점유율의 69%를 차지했으며, 이는 촉매, 항균 코팅, 전도성 페이스트 분야에서 확고한 위치를 반영합니다. 이 부문은 지난 10년간 킬로그램당 비용을 절반으로 절감한 성숙한 분무 건조 및 화염 열분해 공정으로 혜택을 보고 있습니다. 한편, 생산량이 그램 단위 CVD에서 연속 부유 촉매 반응기로 전환되면서 나노튜브 하위 부문은 21.15%의 연평균 복합 성장률(CAGR)로 발전하고 있습니다.
나노튜브의 광범위한 적용은 인장 강도를 3배 높이는 꼬인 CNT 실과 수소 저장 용량을 7wt% 이상으로 끌어올리는 철 도핑 구조를 포괄하는 특허 클러스터에 의해 뒷받침됩니다. 나노클레이와 나노와이어는 각각 난연성 폴리머 블렌드와 고주파 RF 장치 수요에 연동되어 10% 중반대의 성장을 기록합니다.
비폴리머 유기 등급(주로 카본 블랙 및 흑연 형태)은 타이어 컴파운드, EMI 차폐 하우징, 전도성 마스터배치 공급으로 2024년 매출 점유율 55%를 기록했습니다. 나노 다공성 카본 블랙은 현재 1,500 m² g?¹ 이상의 표면적을 제공하여 에너지 저장 분야의 흡착 응용을 확대하고 있습니다.
그러나 폴리머 나노 재료는 가장 빠른 19.99% CAGR을 기록하고 있습니다. 스프레이 동결 건조 기술의 발전으로 지질-폴리머 하이브리드가 생산되어 생분해성 캐리어로 자가 조립되며, 이는 약물 전달 연구자들에게 조절 가능한 방출 동역학과 낮은 면역원성을 제공합니다. 코팅 분야에서는 나노 실록산 그래프팅이 실온에서 마모 후 몇 분 내에 광택을 복원하는 자가 치유 성능을 부여합니다.
지역 분석
북미는 2024년 나노 재료 시장 점유율 38.5%를 차지했으며, 이는 380억 달러를 초과하는 연방 연구 개발 지출과 2025년 기록적인 22억 달러의 예산 요청에 힘입은 결과입니다. 이 지역의 반도체 부흥과 mRNA 치료제 분야의 선도적 지위는 초고순도 등급에 대한 지불 의사가 있는 프리미엄 고객 기반을 창출합니다.
아시아태평양 지역은 22.26%의 연평균 성장률(CAGR)로 확장 중이며, 이 속도라면 2030년 이전에 매출이 북미를 넘어설 수 있습니다. 중국의 제14차 5개년 계획은 나노기술을 핵심 기둥으로 명시하여 공공 자금의 연간 두 자릿수 증가를 주도하고 2nm 미만의 최초 팹 건설을 가속화하고 있습니다. 한국과 일본은 OLED 및 배터리 공급망에서 리더십을 유지하는 한편, 인도는 농촌 인구를 위한 저비용 정수 프로젝트에 나노 재료를 활용하고 있습니다.
유럽은 지속가능성과 엄격한 규제 기반의 독특한 프로필을 유지합니다. ‘호라이즌 유럽’ 보조금은 설계 단계부터 안전한 나노 재료를 목표로 하여 수출업체들이 개발 초기 단계에서 생애주기 영향을 인증하도록 유도합니다. 중동은 나노 다공성 막을 적용한 담수화 설비 확장을 추진 중이며, 사우디아라비아는 화력 방식 대비 온실가스 94% 감축을 목표로 합니다. 브라질은 세계 2위의 바이오기술 작물 생산국으로서의 입지를 바탕으로 작물별 맞춤형 나노비료를 통해 남미 지역의 도입을 주도하며 영양소 이용 효율을 높이고 있습니다.
기타 혜택 :
- 엑셀 형식 시장 예측(ME) 시트
- 3개월간의 애널리스트 지원
목차
제1장 서론
- 조사의 전제조건과 시장의 정의
- 조사 범위
제2장 조사 방법
제3장 주요 요약
제4장 시장 상황
- 시장 개요
- 시장 성장 촉진요인
- 아시아 신규 반도체 공장 건설에 힘입은 반도체 등급 나노 슬러리 수요
- 북미 및 유럽 mRNA 백신 생산 능력에 따른 지질 나노입자 수요
- 플렉서블 OLED 라인의 금은 나노 잉크
- 사용량 증가 나노 재료 시장
- GCC 담수화 시설 확대로 인한 나노 다공성 막 수요 증가
- 시장 성장 억제요인
- 기술비용 상승
- 원료 가격 변동
- 고비용 원자층 증착(ALD) 장비로 인한 중소기업 규모 확장 제한
- 밸류체인 분석
- Porter's Five Forces
- 공급기업의 협상력
- 구매자의 협상력
- 신규 참가업체의 위협
- 대체품의 위협
- 경쟁 기업간 경쟁 관계
제5장 시장 규모와 성장 예측
- 제품 유형별
- 나노입자
- 나노메탈
- 금
- 은
- 백금
- 티타늄
- 알루미늄
- 비금속 산화물
- 알루미나
- 산화철
- 산화티탄
- 실리카
- 산화아연
- 복합 산화물
- 인산칼슘
- 희토류 금속 산화물
- 티타네이트리튬
- 수소화 실리카
- 나노섬유
- 나노튜브
- 나노클레이
- 나노와이어
- 나노입자
- 구조 유형별
- 비 고분자 유기 나노 재료
- 카본블랙
- 탄소나노튜브
- 앱타머
- 저분자 OLED
- 활성탄
- 탄소나노튜브 복합재료
- 고분자 나노 재료
- 코팅제 및 접착제
- 트랜스펙션 시약
- 진단 시약
- 약물전달체
- 패브릭 트리트먼트
- 광학 코팅
- 나노 다공성 막
- 유전체 필름
- OLED 필름
- 비 고분자 유기 나노 재료
- 재료 카테고리별
- 탄소 기반
- 금속 기반
- 금속 산화물 및 세라믹 기반
- 고분자 및 지질계
- 최종 사용자 산업
- 건설
- 전자
- 에너지
- 헬스케어
- 퍼스널케어
- 고무
- 기타 최종 사용자 산업
- 지역별
- 아시아태평양
- 중국
- 인도
- 일본
- 한국
- ASEAN
- 기타 아시아태평양
- 북미
- 미국
- 캐나다
- 멕시코
- 유럽
- 독일
- 영국
- 이탈리아
- 프랑스
- 기타 유럽
- 남미
- 브라질
- 아르헨티나
- 기타 남미
- 중동 및 아프리카
- 사우디아라비아
- 남아프리카
- 기타 중동 및 아프리카
- 아시아태평양
제6장 경쟁 구도
- 시장 집중도
- 전략적 동향
- 시장 점유율 분석
- 기업 프로파일
- ACS Material
- American Elements
- Arkema
- Ascensus
- BASF SE
- Cabot Corporation
- Chasm Advanced Materials, Inc.
- Evonik Industries AG
- Jiangsu Cnano Technology Co., Ltd
- LG Chem
- Merck KGaA
- Nano-C
- Nanocyl SA
- NAWAH
- OCSiAl
- QuantumSphere, Inc.
- Raymor Industries Inc.
- Resonac Holdings Corporation
- Solesence
- US Research Nanomaterials, Inc.
- Zyvex Technologies
제7장 시장 기회와 장래의 전망
HBR 25.11.27The Nanomaterials Market size is estimated at USD 47.63 billion in 2025, and is expected to reach USD 117.83 billion by 2030, at a CAGR of 19.86% during the forecast period (2025-2030).

The sharp upswing mirrors a surge of commercial adoption across semiconductor polishing, mRNA-based therapeutics, flexible displays, and high-efficiency water treatment. Continuous node migration below 3 nm, record vaccine research and development budgets, and desalination build-outs in water-stressed regions are giving the nanomaterials market fresh momentum. Production scale-ups in carbon nanotubes and graphene derivatives are intensifying cost-down learning curves, while public-sector nanotechnology programs underpin a steady pipeline of platform innovations. Even so, the market must absorb volatility in precious-metal feedstocks and contain the high capital charges of atomic-layer-deposition lines that smaller entrants need to compete.
Global Nanomaterials Market Trends and Insights
Semiconductor-grade Nano-slurries Fuelled by New Asian Fabs
The rise of semiconductor fabrication facilities in Asia is driving unprecedented demand for high-purity nano-slurries essential for chemical-mechanical planarization (CMP) processes. These materials enable ultra-precise polishing for advanced node semiconductor manufacturing at 3nm and below. A single leading-edge fab can consume over 300 tons of nano-slurries annually, with demand increasing as chip architectures grow more complex. Additionally, TSMC's USD 40 billion Arizona fab complex is creating new demand centers beyond Asia.
Lipid Nanoparticles Demand from mRNA Capacity Build-outs
Fueled by the surge in mRNA vaccine and therapeutic applications, the lipid nanoparticle (LNP) manufacturing market is witnessing explosive growth. While North America holds the lead in the LNP market, European production capacity is seeing significant investments, steadily closing the gap. Beyond their traditional use in vaccines, LNPs are now making inroads into gene therapies and cancer treatments. Recent innovations are harnessing AI to fine-tune LNP formulations, aiming to boost efficacy and minimize side effects.
Higher Costs of Technology
Batch yields for carbon nanotubes and semiconductor-grade metal oxides remain sensitive to reactor uptime and energy intensity. Even at multi-kiloton annual capacity, unit production costs are five to ten times higher than conventional bulk fillers, constraining uptake in price-elastic applications such as commodity plastics.
Other drivers and restraints analyzed in the detailed report include:
- Gold and Silver Nano-inks in Flexible OLED Lines
- Increasing Usage of Nanomaterials in Water Treatment
- Raw Material Price Fluctuation
For complete list of drivers and restraints, kindly check the Table Of Contents.
Segment Analysis
Nanoparticles held 69% of nanomaterials market share in 2024, reflecting their well-established role in catalysts, antimicrobial coatings, and conductive pastes. The segment benefits from mature spray-dry and flame-pyrolysis routes that cut cost per kilogram in half over the past decade. Meanwhile, the nanotubes sub-segment is advancing at a 21.15% CAGR as output shifts from gram-scale CVD to continuous floating-catalyst reactors.
Wider nanotube deployment is supported by patent clusters covering twisted CNT yarns that triple tensile strength and Fe-doped structures that lift hydrogen-storage capacity beyond 7 wt%. Nanoclays and nanowires record mid-teen growth, with demand tied to flame-retardant polymer blends and high-frequency RF devices, respectively.
Non-polymer organic grades, largely carbon black and graphitic forms, posted 55% revenue share in 2024 by supplying tire compounds, EMI-shielding housings, and conductive masterbatches. Nano-porous carbon blacks now deliver surface areas above 1,500 m2 g-1, expanding adsorption applications in energy storage.
Polymeric nanomaterials, however, track the fastest 19.99% CAGR. Advances in spray-freeze-drying techniques yield lipid-polymer hybrids that self-assemble into biodegradable carriers, giving drug-delivery researchers tunable release kinetics and low immunogenicity. In coatings, nano-siloxane grafting imparts self-healing performance that restores gloss after abrasion within minutes at room temperature.
The Nanomaterials Market Report Segments the Industry by Product Type (Nanoparticles, Nanofibers, Nanotubes, and More), Structure Type (Non-Polymer Organic Nanomaterials and Polymeric Nanomaterials), Material Category (Carbon-Based, Metal-Based, and More), End-User Industry (Construction, Electronics, Energy, and More), and Geography (Asia-Pacific, North America, Europe, South America, and Middle East and Africa).
Geography Analysis
North America held 38.5% nanomaterials market share in 2024, anchored by federal research and development outlays exceeding USD 38 billion and a record USD 2.2 billion request for 2025. The region's semiconductor resurgence and leadership in mRNA therapeutics create a premium customer base willing to pay for ultra-high-purity grades.
Asia Pacific is expanding at a 22.26% CAGR, a pace that could lift its revenue past North America before 2030. China's 14th Five-Year Plan lists nanotechnology as a core pillar, driving double-digit annual increases in public funding and accelerating first-time fab builds below 2 nm. South Korea and Japan sustain their leadership in OLED and battery supply chains, while India channels nanomaterials into low-cost water purification projects that serve rural populations.
Europe maintains a distinct profile built on sustainability and regulatory rigor. Horizon Europe grants target safer-by-design nanomaterials, prompting exporters to certify life-cycle impacts early in development. The Middle East scales desalination capacity incorporating nano-porous membranes, with Saudi-Arabia seeking a 94% greenhouse-gas cut relative to thermal methods. Brazil spearheads South American adoption through crop-specific nano-fertilisers that raise nutrient-use efficiency, supported by its standing as the second-largest biotech-crop producer worldwide.
- ACS Material
- American Elements
- Arkema
- Ascensus
- BASF SE
- Cabot Corporation
- Chasm Advanced Materials, Inc.
- Evonik Industries AG
- Jiangsu Cnano Technology Co., Ltd
- LG Chem
- Merck KGaA
- Nano-C
- Nanocyl SA
- NAWAH
- OCSiAl
- QuantumSphere, Inc.
- Raymor Industries Inc.
- Resonac Holdings Corporation
- Solesence
- US Research Nanomaterials, Inc.
- Zyvex Technologies
Additional Benefits:
- The market estimate (ME) sheet in Excel format
- 3 months of analyst support
TABLE OF CONTENTS
1 Introduction
- 1.1 Study Assumptions and Market Definition
- 1.2 Scope of the Study
2 Research Methodology
3 Executive Summary
4 Market Landscape
- 4.1 Market Overview
- 4.2 Market Drivers
- 4.2.1 Semiconductor-grade Nano-slurries Fuelled by New Asian Fabs
- 4.2.2 Lipid Nanoparticles Demand from North-America and Europe mRNA Vaccine Capacity
- 4.2.3 Gold and Silver Nano-inks in Flexible OLED Lines
- 4.2.4 Increasing Usage of Nanomaterials
- 4.2.5 GCC Desalination Build-out Driving Nano-porous Membranes
- 4.3 Market Restraints
- 4.3.1 Higher Costs of Technology
- 4.3.2 Raw Material Price Fluctuation
- 4.3.3 High-Capex Atomic-Layer-Deposition Reactors Limiting SME Scale-up
- 4.4 Value Chain Analysis
- 4.5 Porter's Five Forces
- 4.5.1 Bargaining Power of Suppliers
- 4.5.2 Bargaining Power of Buyers
- 4.5.3 Threat of New Entrants
- 4.5.4 Threat of Substitutes
- 4.5.5 Competitive Rivalry
5 Market Size and Growth Forecasts (Value)
- 5.1 By Product Type
- 5.1.1 Nanoparticles
- 5.1.1.1 Nanometals
- 5.1.1.1.1 Gold
- 5.1.1.1.2 Silver
- 5.1.1.1.3 Platinum
- 5.1.1.1.4 Titanium
- 5.1.1.1.5 Aluminium
- 5.1.1.2 Non-metal Oxides
- 5.1.1.2.1 Alumina
- 5.1.1.2.2 Iron Oxide
- 5.1.1.2.3 Titanium Oxide
- 5.1.1.2.4 Silica
- 5.1.1.2.5 Zinc Oxide
- 5.1.1.3 Complex Oxides
- 5.1.1.3.1 Calcium Phosphate
- 5.1.1.3.2 Rare-earth Metal Oxides
- 5.1.1.3.3 Lithium Titanate
- 5.1.1.3.4 Silica Hydride
- 5.1.2 Nanofibers
- 5.1.3 Nanotubes
- 5.1.4 Nanoclays
- 5.1.5 Nanowires
- 5.1.1 Nanoparticles
- 5.2 By Structure Type
- 5.2.1 Non-polymer Organic Nanomaterials
- 5.2.1.1 Carbon Black
- 5.2.1.2 Carbon Nanotubes
- 5.2.1.3 Aptamers
- 5.2.1.4 Small-Molecule OLED
- 5.2.1.5 Activated Carbon
- 5.2.1.6 Carbon Nanotubes Composites
- 5.2.2 Polymeric Nanomaterials
- 5.2.2.1 Coatings and Adhesives
- 5.2.2.2 Transfection Reagents
- 5.2.2.3 Diagnostic Reagents
- 5.2.2.4 Drug-Delivery Vehicles
- 5.2.2.5 Fabric Treatments
- 5.2.2.6 Optical Coatings
- 5.2.2.7 Nano-porous Filtration Membranes
- 5.2.2.8 Dielectric Films
- 5.2.2.9 OLED Films
- 5.2.1 Non-polymer Organic Nanomaterials
- 5.3 By Material Category
- 5.3.1 Carbon-based
- 5.3.2 Metal-based
- 5.3.3 Metal-oxide and Ceramic-based
- 5.3.4 Polymeric and Lipid-based
- 5.4 End-user Industry
- 5.4.1 Construction
- 5.4.2 Electronics
- 5.4.3 Energy
- 5.4.4 Healthcare
- 5.4.5 Personal Care
- 5.4.6 Rubber
- 5.4.7 Other End-user Industries
- 5.5 Geography
- 5.5.1 Asia-Pacific
- 5.5.1.1 China
- 5.5.1.2 India
- 5.5.1.3 Japan
- 5.5.1.4 South Korea
- 5.5.1.5 ASEAN
- 5.5.1.6 Rest of Asia-Pacific
- 5.5.2 North America
- 5.5.2.1 United States
- 5.5.2.2 Canada
- 5.5.2.3 Mexico
- 5.5.3 Europe
- 5.5.3.1 Germany
- 5.5.3.2 United Kingdom
- 5.5.3.3 Italy
- 5.5.3.4 France
- 5.5.3.5 Rest of Europe
- 5.5.4 South America
- 5.5.4.1 Brazil
- 5.5.4.2 Argentina
- 5.5.4.3 Rest of South America
- 5.5.5 Middle East and Africa
- 5.5.5.1 Saudi Arabia
- 5.5.5.2 South Africa
- 5.5.5.3 Rest of Middle East and Africa
- 5.5.1 Asia-Pacific
6 Competitive Landscape
- 6.1 Market Concentration
- 6.2 Strategic Moves
- 6.3 Market Share Analysis
- 6.4 Company Profiles (includes Global level Overview, Market level overview, Core Segments, Financials, Strategic Information, Market Rank/Share, Products and Services, Recent Developments)
- 6.4.1 ACS Material
- 6.4.2 American Elements
- 6.4.3 Arkema
- 6.4.4 Ascensus
- 6.4.5 BASF SE
- 6.4.6 Cabot Corporation
- 6.4.7 Chasm Advanced Materials, Inc.
- 6.4.8 Evonik Industries AG
- 6.4.9 Jiangsu Cnano Technology Co., Ltd
- 6.4.10 LG Chem
- 6.4.11 Merck KGaA
- 6.4.12 Nano-C
- 6.4.13 Nanocyl SA
- 6.4.14 NAWAH
- 6.4.15 OCSiAl
- 6.4.16 QuantumSphere, Inc.
- 6.4.17 Raymor Industries Inc.
- 6.4.18 Resonac Holdings Corporation
- 6.4.19 Solesence
- 6.4.20 US Research Nanomaterials, Inc.
- 6.4.21 Zyvex Technologies
7 Market Opportunities and Future Outlook
- 7.1 White-space and Unmet-need Assessment
