
|
시장보고서
상품코드
1906032
그리드 스케일 배터리 시장 : 점유율 분석, 업계 동향 및 통계, 성장 예측(2026-2031년)Grid Scale Battery - Market Share Analysis, Industry Trends & Statistics, Growth Forecasts (2026 - 2031) |
||||||
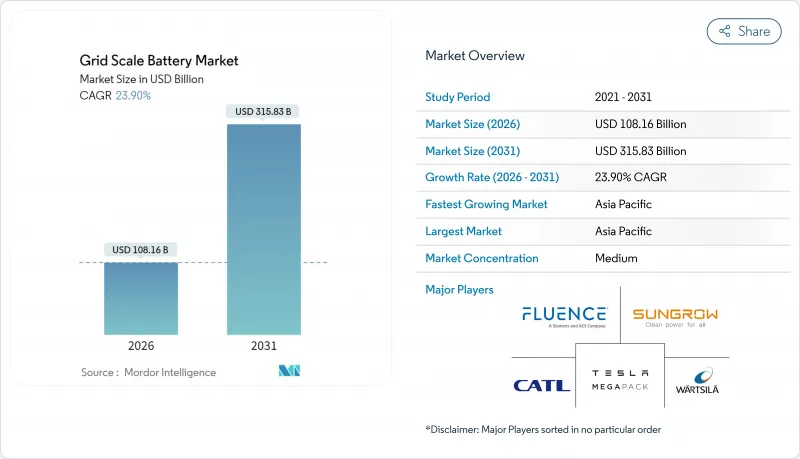
2026년 그리드 스케일 배터리 시장의 규모는 1,081억 6,000만 달러로 추정되며, 2025년 872억 9,000만 달러에서 성장하여, 2031년에는 3,158억 3,000만 달러에 이를 것으로 예측됩니다.
2026년부터 2031년까지는 CAGR 23.9%로 성장할 전망입니다.

리튬이온 기술의 급속한 비용 절감, 신재생에너지 도입 의무기준의 강화, 긴급 송전망의 현대화 프로그램이 전력회사, 개발 사업자, 대규모 에너지 소비자들 사이에서 조달 결정을 가속화하고 있습니다. 2024년에는 유틸리티 규모의 설치 용량이 173GWh에 달하였고, 캘리포니아주와 텍사스주가 2030년까지 적극적인 신재생에너지 목표를 추구하면서 최대 증가분을 차지했습니다. 아시아태평양의 제조 규모와 정책 지원은 비용 우위성을 확고히 하는 반면, 2022년 모스랜딩 화재 등의 성능상 사고는 안전기술 혁신에 대한 업계의 주목을 높이고 있습니다. 투자자들은 주류 리튬이온 설비를 보완하는 장시간 축전 기술에 역대 최고의 자본 유입으로 대응하고 있으며, 이는 프로젝트의 경제성과 수익 누적 전략의 진화를 시사하고 있습니다.
세계의 그리드 스케일 배터리 시장의 동향 및 인사이트
리튬이온 배터리 비용 저하
리튬이온 배터리 팩의 평균 가격은 2023년에 139달러/kWh까지 하락하였으며 1991년 대비 97% 하락했습니다. 제조업체는 2026년말까지 100달러/kWh 미만의 수준을 예상하고 있습니다. 비용 압박의 배경은 중국, 미국, 유럽에서의 기가팩토리 규모 확대, 제조 자동화, 최적화된 공급망입니다. CATL의 Qilin 2.0 및 BYD의 Blade 2.0 플랫폼은 6C 급속 충전과 고에너지 밀도를 제공하여 4시간 시스템의 플랜트 밸런스 비용을 절감합니다. 이러한 개선은 저가의 전력 구매 계약을 가능하게 하고 투자 회수 기간을 단축시켜 금리 변동 중에도 주문 파이프라인을 유지합니다. 단위 경제성이 향상됨에 따라 개발 사업자는 규모의 경제를 누리기 때문에 보다 대규모의 시스템 형식을 선호하는 경향이 커지고 설치 및 시운전에서 학습 곡선을 가속화하고 있습니다.
신재생에너지 통합의 의무화
캘리포니아는 2026년까지 11.5GW의 축전 용량을 목표로 하며, 멕시코에서는 유틸리티 규모의 재생에너지에 5%의 축전 의무를 부과하고 있습니다. 유럽의 'Fit for 55' 패키지는 2024년에 21.9GWh를 넘는 지역 축전 설비의 확충을 추진하였습니다. 정책 수립자는 넷 제로 목표의 달성, 변동성이 있는 태양광 및 풍력 발전의 통합, 가스에 의한 피크 전력 공급 설비의 추가 도입 연기로 인해 축전이 불가결하다고 인식하고 있습니다. 각국의 로드맵은 의무화를 경쟁 입찰이나 기술 중립적인 용량 시장으로 전환하여 개발 사업자가 자금 조달 위험을 줄이는 수익 계약을 확보할 수 있도록 하고 있습니다. 또한 의무화는 프로젝트 오프테이크를 보장하고 시장 리스크를 헤지하는 태양광+축전 하이브리드형 PPA(전력 구입 계약)의 조달을 가속화하고 있습니다.
중요 광물 공급망의 제약
리튬, 코발트, 니켈 수요 예측은 2030년까지 확정 채굴 능력을 상회할 수 있으며, 개발 사업자는 가격 상승이나 납품 지연의 위험에 노출됩니다. 중국은 세계 리튬 정제의 60%, 코발트의 75%를 담당하고, 콩고 민주 공화국(DRC)은 채굴 코발트 생산량의 70%를 차지하기 때문에 지정학적 위험이 집중되고 있습니다. 나트륨 이온 배터리와 철 공기 배터리는 대체 기술로 부상하고 있습니다. 중국은 2024년 세계 최초의 100MWh 나트륨 이온 배터리 공장을 개시하였고 미국 기업은 100시간 지속 가능한 철 공기 배터리 시스템의 시험 운영을 진행하고 있습니다. 업계 컨소시엄은 원료 의존도를 완화하기 위해 다양한 전력 구매 계약 및 재활용 의무화를 추진하기 위해 노력하고 있습니다.
부문 분석
2025년 시점에서 리튬이온 부문은 그리드 스케일 배터리 시장의 91.30%를 차지했으며 796억 8,000만 달러라는 최대 시장 규모에 공헌했습니다. 2031년까지는 연평균 복합 성장률(CAGR) 24.1%로 확대될 것으로 전망됩니다. 피크 가스와의 비용 경쟁력, 높은 왕복 효율, 확립된 공급망이 우수성을 지원합니다. 리튬이온 내에서 거치형 용도로는 인산철 리튬이 니켈 망간 코발트를 능가하여 4,000-6,000 사이클의 수명과 낮은 열폭주 리스크를 제공합니다. 한편, CATL의 2세대 나트륨 이온 모듈은 한랭지에서 실용적인 대안을 제공하며, 제조업체는 2026년까지 상업화를 예상하고 있습니다.
흐름 배터리는 2025년 그리드 스케일 배터리 시장 규모의 3% 미만을 차지하는 데 그쳤지만, 호주, 캘리포니아, 독일의 장시간 축전 입찰에서는 주도적인 지위를 차지하고 있습니다. 바나듐 레독스 시스템은 25년의 수명과 거의 제로에 가까운 열화를 실현하여 프로젝트 수명 기간에서의 MWh당 균등화 비용의 감소를 실현합니다. 2025년에는 신재생에너지 발전의 과잉발전에 대응하는 8시간 이상의 방전시간을 요구하는 전력회사의 수요로 인해 철 공기 배터리 및 아연 하이브리드 캐소드 기술에 대한 벤처 투자가 급증했습니다. 일본의 고체 전지 파일럿 프로젝트에서는 체적 에너지 밀도 향상을 위해 황화물 전해질을 도입하고 있지만, 상업 생산 개시까지는 아직 수년이 필요합니다. 그러므로 화학 조성의 조합은 단일 우위 플랫폼이 아니라 용도 특화형 최적화로 전환하고 있습니다.
그리드 스케일 배터리 시장의 보고서는 배터리 화학(리튬이온, 납축전지, 나트륨계, 흐름 배터리, 기타 신흥 화학계), 용도(주파수 조정, 에너지 중재 및 청구 관리, 부하 시프트와 피크 쉐이빙, 재생에너지의 시간 시프트 등), 지역(북미, 유럽, 아시아태평양, 남미, 중동 및 아프리카)별로 분류되어 있습니다.
지역별 분석
아시아태평양은 2025년에 그리드 스케일 배터리 시장 점유율의 46.20%를 차지하였고, 2026년부터 2031년에 걸쳐 25.2%의 연평균 복합 성장률(CAGR)을 나타낼 전망입니다. 이는 중국의 제조 우위와 수출 지향 정책 인센티브에 의해 지원됩니다. CATL과 BYD와 같은 중국 공급업체는 유럽과 북미에서 수기가와트 규모의 계약을 협상하는 동시에 무역 장벽을 완화하기 위해 지역 조립 공장에 대한 투자를 추진하고 있습니다. 일본의 탈탄소화 로드맵은 2027년까지 100MW의 축전 설비 건설을 향한 연계를 촉진하고, 인도의 생산 연동형 인센티브 제도는 국내 기가팩토리로의 보조금 유도를 실현하고 있습니다. 한국은 하이엔드 고체전지 연구와 수출용 프리미엄 시장을 추구하는 한편 호주는 풍부한 재생에너지를 활용하여 전력 공급 안정화를 위한 축전 설비를 도입하고 있습니다.
북미는 총 도입량으로 2위를 차지하고 있으며, 인플레이션 억제법의 세액 공제와 주 수준의 재생에너지 조달 의무가 추진력이 되고 있습니다. 캘리포니아의 로드맵은 2026년까지 11.5기가와트를 목표로 하고 있으며, 텍사스는 연결계약에서 8기가와트를 돌파하여 지역의 그리드 스케일 배터리 시장 내 규모를 2026년에 293억 달러로 밀어 올릴 전망입니다. FERC에 의한 대기열 개혁은 540기가와트 규모의 축전 관련 프로젝트의 재가동을 목표로 하고 있지만, 계통 연계까지의 평균 소요 기간은 여전히 3년 이상으로 중대한 제한사항이 되고 있습니다. 캐나다는 격오지 지역에서 배터리와 디젤 발전의 하이브리드 시스템에 의한 계통 신뢰성을 우선시하고, 멕시코는 신규 재생에너지 프로젝트에 5%의 축전 설비 의무를 부과함으로써 새로운 수요 파이프라인을 창출하고 있습니다.
유럽에서는 2024년 에너지 안보 문제로 인해 긴급성이 높아졌으며 동년 축전 설비의 설치 용량은 21.9GWh에 달했습니다. 독일 연방네트워크청은 용량 예비력 및 블랙스타트 서비스에서 축전지의 역할을 인식하고 영국 용량 시장에서는 현금 흐름 안정화를 도모하는 15년 계약이 확보되고 있습니다. 남유럽 국가에서는 오후 시간대 발전 억제를 완화하기 위해 유틸리티 규모의 태양광 발전과 축전을 통합하고 있습니다. 북유럽 사업자는 주파수 제어를 강화하기 위해 수력 발전과 축전지를 결합합니다. EU의 청정 에너지 패키지를 기반으로 한 법 정비는 계통 서비스 정의를 통일하고 축전지 서비스의 크로스보더 거래를 촉진하고 있습니다. 규제면의 뒷받침으로 인해 2031년까지 이 지역의 CAGR은 23.2%를 나타낼 것으로 예상되고 있습니다.
기타 혜택
- 시장 예측(ME) 엑셀 시트
- 3개월 애널리스트 서포트
자주 묻는 질문
목차
제1장 서론
- 조사 전제조건 및 시장 정의
- 조사 범위
제2장 조사 방법
제3장 주요 요약
제4장 시장 상황
- 시장 개요
- 촉진요인
- 리튬이온 전지 비용 저하
- 신재생에너지 통합의 의무화
- 송전망의 신뢰성과 회복력에 대한 요구
- 유리한 정책 인센티브(IRA, EU 넷 제로 등)
- 태양광+축전 하이브리드 PPA 및 수익 누적
- 데이터센터용 마이크로그리드에 필요한 안정되고 깨끗한 전력
- 억제요인
- 중요 광물 공급망의 제약
- 축전지의 안전성 및 화재 위험에 관한 우려
- 연계 대기열의 병목
- 부대 서비스 수익의 상쇄 효과
- 공급망 분석
- 규제 상황
- 기술 전망
- Porter's Five Forces
- 공급자의 협상력
- 구매자의 협상력
- 신규 참가업체의 위협
- 대체품의 위협
- 경쟁 기업 간 경쟁 관계
제5장 시장 규모 및 성장 예측
- 전지 화학별
- 리튬이온 배터리(LFP, NMC, NCA)
- 납축전지
- 나트륨계(NAS, 나트륨 이온)
- 흐름 배터리(바나듐, 철, 아연-브롬)
- 기타 신흥화학(금속 공기 배터리, 고체전지)
- 용도별
- 주파수 조정
- 에너지 차익거래 및 청구 관리
- 부하 시프트 및 피크 쉐이빙
- 재생에너지 시간대 시프트
- 송배전 지연
- 블랙스타트 및 그리드 형성 지원
- 지역별
- 북미
- 미국
- 캐나다
- 멕시코
- 유럽
- 독일
- 영국
- 프랑스
- 이탈리아
- 스페인
- 북유럽 국가
- 기타 유럽
- 아시아태평양
- 중국
- 인도
- 일본
- 한국
- ASEAN 국가
- 호주 및 뉴질랜드
- 기타 아시아태평양
- 남미
- 브라질
- 아르헨티나
- 기타 남미
- 중동 및 아프리카
- 사우디아라비아
- 아랍에미리트(UAE)
- 남아프리카
- 이집트
- 기타 중동 및 아프리카
- 북미
제6장 경쟁 구도
- 시장 집중도
- 전략적 동향(M&A, 제휴, 전력 구입 계약)
- 시장 점유율 분석(주요 기업의 시장 순위 및 점유율)
- 기업 프로파일
- Tesla
- Fluence
- Sungrow Power Supply
- Contemporary Amperex Technology(CATL)
- Wartsila
- Panasonic
- LG Energy Solution
- Samsung SDI
- BYD
- East Penn
- GS Yuasa
- Clarios
- AES Corporation
- Powin Energy
- Hitachi Energy
- NEC ES(Koch)
- EnerSys
- ESS Tech
- Ambri
- Redflow
- EnerVenue
제7장 시장 기회 및 미래 전망
CSM 26.01.28The Grid Scale Battery Market size in 2026 is estimated at USD 108.16 billion, growing from 2025 value of USD 87.29 billion with 2031 projections showing USD 315.83 billion, growing at 23.9% CAGR over 2026-2031.
Rapid cost declines in lithium-ion technology, binding renewable-portfolio standards, and urgent grid-modernization programs are accelerating procurement decisions across utilities, developers, and large energy users. Utility-scale installations climbed to 173 GWh in 2024, with California and Texas accounting for the largest additions as both states pursue aggressive 2030 renewable targets. Asia-Pacific's manufacturing scale and policy support have entrenched cost leadership, while performance incidents such as the 2022 Moss Landing fire sharpen industry focus on safety innovation. Investors are responding with record capital flows into long-duration technologies that complement the dominant lithium-ion fleet, signaling an evolution in project economics and revenue stacking strategies.
Global Grid Scale Battery Market Trends and Insights
Declining Lithium-Ion Battery Costs
Average lithium-ion pack prices fell to USD 139/kWh in 2023, a 97% slide since 1991, and manufacturers expect sub-USD 100/kWh levels by 2026. Cost pressure stems from gigafactory scaling, manufacturing automation, and optimized supply chains in China, the United States, and Europe. CATL's Qilin 2.0 and BYD's Blade 2.0 platforms add 6C fast-charging and higher energy densities, reducing balance-of-plant costs for four-hour systems. These improvements unlock lower-priced power-purchase agreements and shorten payback periods, sustaining order pipelines even amid interest-rate volatility. As unit economics improve, developers increasingly favor larger system formats to capture economies of scale, accelerating the learning curve on installation and commissioning practices.
Renewable-Energy Integration Mandates
California seeks 11.5 GW of storage by 2026, Mexico now requires 5% storage in utility-scale renewables, and Europe's Fit-for-55 package drives a regional buildout exceeding 21.9 GWh in 2024. Policymakers view storage as essential for meeting net-zero milestones, integrating variable solar and wind, and postponing gas-peaking additions. National roadmaps are translating mandates into competitive auctions and technology-neutral capacity markets, enabling developers to secure revenue contracts that de-risk financing. Mandates also accelerate procurement of hybrid solar-plus-storage PPAs that guarantee project offtake and hedge merchant risk.
Critical-Mineral Supply-Chain Constraints
Forecast demand for lithium, cobalt, and nickel could outstrip committed mining capacity by 2030, exposing developers to price spikes and delivery delays. China refines 60% of global lithium and 75% of cobalt, while the DRC holds 70% of mined cobalt output, concentrating geopolitical risk. Sodium-ion and iron-air chemistries are emerging alternatives: China commissioned the world's first 100 MWh sodium-ion plant in 2024, and US firms pilot iron-air systems for 100-hour endurance. Industry consortia lobby for diversified offtake agreements and recycling mandates to ease raw-material dependency.
Other drivers and restraints analyzed in the detailed report include:
- Grid Reliability & Resiliency Needs
- Favourable Policy Incentives (IRA, EU Net-Zero)
- Battery-Storage Safety & Fire-Risk Concerns
For complete list of drivers and restraints, kindly check the Table Of Contents.
Segment Analysis
The lithium-ion segment controlled 91.30% of the grid-scale battery market share in 2025 and generated the largest contribution to the grid-scale battery market size at USD 79.68 billion, expanding at a 24.1% CAGR through 2031. Cost parity with peaking gas, high round-trip efficiencies, and established supply chains sustain its position. Within lithium-ion, lithium iron phosphate eclipses nickel manganese cobalt for stationary use, offering 4,000-6,000 cycles and lower thermal-runaway risk. Meanwhile, CATL's second-generation sodium-ion modules promise viable substitution in cold climates, and manufacturers anticipate commercial shipments by 2026.
Flow batteries recorded <3% of the 2025 grid-scale battery market size but lead long-duration tenders in Australia, California, and Germany. Vanadium redox systems deliver 25-year lifespans with near-zero degradation, translating to lower levelized-cost per MWh over project life. Venture investments in iron-air and zinc hybrid-cathode technologies surged in 2025 as utilities seek 8+ hour discharge for renewable over-generation. Solid-state battery pilots in Japan use sulfide electrolytes to improve volumetric energy density, although commercial output remains several years away. The chemistry mix is therefore shifting toward application-specific optimization rather than a single winning platform.
The Grid Scale Battery Market Report is Segmented by Battery Chemistry (Lithium-Ion, Lead-Acid, Sodium-Based, Flow Batteries, and Other Emerging Chemistries), Application (Frequency Regulation, Energy Arbitrage/Bill Management, Load Shifting and Peak Shaving, Renewable-Energy Time-Shifting, and More), and Geography (North America, Europe, Asia-Pacific, South America, and Middle East and Africa).
Geography Analysis
Asia-Pacific held 46.20% of the grid-scale battery market share in 2025 and is on track for a 25.2% CAGR between 2026 and 2031, anchored by China's manufacturing dominance and export-oriented policy incentives. Chinese suppliers such as CATL and BYD negotiate multi-gigawatt contracts in Europe and North America while investing in regional assembly plants to mitigate trade barriers. Japan's decarbonization roadmap triggers partnerships to build 100 MW of storage by 2027, and India's Production Linked Incentive scheme channels subsidies toward local gigafactories. South Korea pursues high-end solid-state research and premium export niches, whereas Australia leverages abundant renewables to install storage for firmed capacity.
North America ranks second in total deployments, catalyzed by the Inflation Reduction Act's tax credits and state-level renewable procurement mandates. California's roadmap targets 11.5 GW by 2026, and Texas exceeds 8 GW in interconnection agreements, propelling the region's grid-scale battery market size to USD 29.3 billion in 2026. Queue reforms by FERC aim to clear 540 GW of pending storage-linked projects, yet interconnection timelines still average more than three years, representing a material headwind. Canada prioritizes grid reliability in remote provinces through battery-diesel hybrid systems, and Mexico enforces a 5% storage requirement for new renewable projects, creating an emerging demand pipeline.
Europe's urgency accelerated after 2024 energy-security disruptions, lifting installed capacity to 21.9 GWh that year. Germany's Bundesnetzagentur recognizes batteries in capacity reserves and black-start services, while the United Kingdom's capacity market secures 15-year contracts that stabilize cash flows. Southern European nations integrate storage with utility-scale solar to mitigate afternoon curtailment, and Nordic operators pair batteries with hydropower to enhance frequency control. Legislation under the EU Clean Energy Package harmonizes grid-service definitions, fostering cross-border trading of battery services. Regulatory tailwinds underpin a 23.2% CAGR for the region through 2031.
- Tesla
- Fluence
- Sungrow Power Supply
- Contemporary Amperex Technology (CATL)
- Wartsila
- Panasonic
- LG Energy Solution
- Samsung SDI
- BYD
- East Penn
- GS Yuasa
- Clarios
- AES Corporation
- Powin Energy
- Hitachi Energy
- NEC ES (Koch)
- EnerSys
- ESS Tech
- Ambri
- Redflow
- EnerVenue
Additional Benefits:
- The market estimate (ME) sheet in Excel format
- 3 months of analyst support
TABLE OF CONTENTS
1 Introduction
- 1.1 Study Assumptions & Market Definition
- 1.2 Scope of the Study
2 Research Methodology
3 Executive Summary
4 Market Landscape
- 4.1 Market Overview
- 4.2 Market Drivers
- 4.2.1 Declining lithium-ion battery costs
- 4.2.2 Renewable-energy integration mandates
- 4.2.3 Grid-reliability & resiliency needs
- 4.2.4 Favourable policy incentives (IRA, EU Net-Zero, etc.)
- 4.2.5 Hybrid solar-plus-storage PPAs & revenue stacking
- 4.2.6 Data-centre micro-grids demand firm clean power
- 4.3 Market Restraints
- 4.3.1 Critical-mineral supply-chain constraints
- 4.3.2 Battery-storage safety & fire-risk concerns
- 4.3.3 Interconnection-queue bottlenecks
- 4.3.4 Ancillary-service revenue cannibalisation
- 4.4 Supply-Chain Analysis
- 4.5 Regulatory Landscape
- 4.6 Technological Outlook
- 4.7 Porter's Five Forces
- 4.7.1 Bargaining Power of Suppliers
- 4.7.2 Bargaining Power of Buyers
- 4.7.3 Threat of New Entrants
- 4.7.4 Threat of Substitutes
- 4.7.5 Competitive Rivalry
5 Market Size & Growth Forecasts
- 5.1 By Battery Chemistry
- 5.1.1 Lithium-ion (LFP, NMC, NCA)
- 5.1.2 Lead-acid
- 5.1.3 Sodium-based (NAS, Sodium-ion)
- 5.1.4 Flow Batteries (Vanadium, Iron, Zinc-Br)
- 5.1.5 Other Emerging Chemistries (Metal-air, Solid-state)
- 5.2 By Application
- 5.2.1 Frequency Regulation
- 5.2.2 Energy Arbitrage/Bill Management
- 5.2.3 Load Shifting and Peak Shaving
- 5.2.4 Renewable-Energy Time-Shifting
- 5.2.5 Transmission and Distribution Deferral
- 5.2.6 Black-Start and Grid-Forming Support
- 5.3 By Geography
- 5.3.1 North America
- 5.3.1.1 United States
- 5.3.1.2 Canada
- 5.3.1.3 Mexico
- 5.3.2 Europe
- 5.3.2.1 Germany
- 5.3.2.2 United Kingdom
- 5.3.2.3 France
- 5.3.2.4 Italy
- 5.3.2.5 Spain
- 5.3.2.6 Nordic Countries
- 5.3.2.7 Rest of Europe
- 5.3.3 Asia-Pacific
- 5.3.3.1 China
- 5.3.3.2 India
- 5.3.3.3 Japan
- 5.3.3.4 South Korea
- 5.3.3.5 ASEAN Countries
- 5.3.3.6 Australia and New Zealand
- 5.3.3.7 Rest of Asia-Pacific
- 5.3.4 South America
- 5.3.4.1 Brazil
- 5.3.4.2 Argentina
- 5.3.4.3 Rest of South America
- 5.3.5 Middle East and Africa
- 5.3.5.1 Saudi Arabia
- 5.3.5.2 United Arab Emirates
- 5.3.5.3 South Africa
- 5.3.5.4 Egypt
- 5.3.5.5 Rest of Middle East and Africa
- 5.3.1 North America
6 Competitive Landscape
- 6.1 Market Concentration
- 6.2 Strategic Moves (M&A, Partnerships, PPAs)
- 6.3 Market Share Analysis (Market Rank/Share for key companies)
- 6.4 Company Profiles (includes Global level Overview, Market level overview, Core Segments, Financials as available, Strategic Information, Products & Services, and Recent Developments)
- 6.4.1 Tesla
- 6.4.2 Fluence
- 6.4.3 Sungrow Power Supply
- 6.4.4 Contemporary Amperex Technology (CATL)
- 6.4.5 Wartsila
- 6.4.6 Panasonic
- 6.4.7 LG Energy Solution
- 6.4.8 Samsung SDI
- 6.4.9 BYD
- 6.4.10 East Penn
- 6.4.11 GS Yuasa
- 6.4.12 Clarios
- 6.4.13 AES Corporation
- 6.4.14 Powin Energy
- 6.4.15 Hitachi Energy
- 6.4.16 NEC ES (Koch)
- 6.4.17 EnerSys
- 6.4.18 ESS Tech
- 6.4.19 Ambri
- 6.4.20 Redflow
- 6.4.21 EnerVenue
7 Market Opportunities & Future Outlook
- 7.1 White-Space & Unmet-Need Assessment

