
|
시장보고서
상품코드
1906056
분자세포유전학 시장 : 점유율 분석, 업계 동향 및 통계, 성장 예측(2026-2031년)Molecular Cytogenetics - Market Share Analysis, Industry Trends & Statistics, Growth Forecasts (2026 - 2031) |
||||||
분자세포유전학 시장은 2025년 31억 8,000만 달러로 평가되었으며, 2026년 34억 7,000만 달러에서 2031년까지 54억 1,000만 달러에 이를 것으로 예측됩니다.
예측기간(2026-2031년)의 CAGR은 9.25%로 예상됩니다.

FDA에 의한 규제 경로 표준화, 종양학에 초점을 맞춘 유전자 검사의 환급 범위 확대, AI와 이미지 기반 유전체학의 급속한 융합이 수요의 상승세를 유지하고 있습니다(fda.gov). 새로운 컴플라이언스 업무 부하에 대응할 수 없는 소규모 검사기관은 통합이 진행되어, 통합 플랫폼 프로바이더에서 경쟁 구도의 변화가 발생하고 있습니다. 표적요법과 연계한 동반진단은 현재는 일상적인 세포유전학적 검사의 상업적 기반을 형성하여 검사 메뉴의 지속적인 확충을 촉진하고 있습니다. 검사기관은 시료량 증가에 대응하기 위해 디지털 전환을 가속화하고 있으며, 핵형 해석 자동화와 클라우드 기반 보고를 통합하는 소프트웨어 솔루션의 두 자릿수 성장을 뒷받침하고 있습니다.
세계의 분자세포유전학 시장의 동향 및 인사이트
암 및 유전성 질환의 유병률 상승
세계 암 발생률의 지속적인 상승에 의해 종양학 클리닉에서의 세포유전학적 검사량은 증가를 계속하고 있습니다. 전체 유전체 시퀀싱의 메타 분석에 의하면 고형 종양 사례의 79%가 염색체 분석에 의해 특정 가능한 치료적으로 의미 있는 유전체 변이를 갖는 것으로 밝혀졌습니다. 중국 남부 및 기타 고유병률 지역의 지중해빈혈 스크리닝 프로그램은 3세대 시퀀싱을 도입하여 전통적인 분석에서 검출할 수 없는 드문 유전자형을 밝혀내고 있습니다. 정밀 종양학이 주류가 됨에 따라, 세포유전학적 분석은 치료 결정 알고리즘에 필수적인 요소가 되었습니다. 그 역할은 진단을 넘어 치료 선택의 지침이 되고 장기적인 암 치료 예산에 포함되고 있습니다.
표적 요법과 동반진단에 대한 관심 증가
2024년에는 FDA가 추가 동반진단을 승인했습니다. 여기에는 PATHWAY HER2 검사를 초저레벨 범주로 확대하고, 최초의 범암 IVD 키트로서 TruSight Oncology Comprehensive의 인가가 포함됩니다. 제약기업은 현재 30건 이상의 동반진단 공동 연구를 추진하고 있으며, 분자 아형에 근거한 적응증의 엄격화에 따라 이 수는 계속 증가하고 있습니다. 제자리 부합법 시스템의 분류가 클래스 III에서 클래스 II로 변경됨에 따라 승인 기간이 단축되어 신흥 기업과 기존 기업 모두의 개발 리스크가 저하되었습니다. 메디케어 적용 범위 확대에 수반하는 병행적인 환급 확대에 의해 지역의 암 진료 시설이 세포유전학적 프로파일링을 표준 치료로 도입하는 움직임이 촉진되고 있습니다. 이러한 정책 전환이 더하여 세포유전학은 일상적인 암 진료 워크플로에 깊숙이 통합되어 검사 메뉴의 혁신이 가속화되고 있습니다.
고처리량 장비 및 FISH 이미저의 높은 자본 비용
자동화된 FISH 스캐너 및 어레이 시스템의 도입은 플랫폼당 미화 100만 달러를 초과할 수 있으며, 중형 검사 기관은 다년간의 감가상각을 부담합니다. AI 탑재 이미지 분석 모듈은 소프트웨어 라이선싱 비용을 추가하여 진입 장벽을 더욱 높입니다. 임대 프로그램이 존재하지만 대부분의 경우 소모품의 최소 구매량을 의무화하여 영업 이익률을 압박합니다. FISH, aCGH, 광학 유전체 매핑을 포괄하는 풀서비스 메뉴 구축을 목표로 하는 시설에서는 자본 부담이 특히 심각합니다.
부문 분석
분자세포유전학 시장에서 소프트웨어는 현재 가장 역동적인 성장 요인이며 예측 CAGR은 12.08%입니다. 2025년에는 키트 및 시약이 수익의 55.02%를 차지했지만, 연구소에서는 새로운 자본을 클라우드 네이티브 해석 기술에 투입하고 있습니다. 이렇게 하면 수동 검토 시간이 절반으로 줄어 분산 사례 로그아웃이 가능합니다. 예를 들면 400만 장의 염색체 이미지로 훈련된 CHROMA 기초 모델이 있습니다. 이 리소스는 현재 자동화된 중기 분열 이미지 분석을 지원하는 기반이 되었습니다. 상용 플랫폼은 하드웨어 교체 없이 지속적인 AI 업데이트를 통합하여 설치된 현미경의 서비스 수명을 연장합니다.
소프트웨어와 병행하여 서비스가 제공되며, 원거리에서 생명공학정보전문가가 사내에 세포유전학자를 보유하지 않는 소규모 시설을 위한 온디맨드 검증을 실시합니다. 소모품은 여전히 필수적이며, 특히 종양특이적 이상에 대응하는 일회용 프로브 세트가 중요합니다. 그러나 클라우드, AI, 마이크로서비스 과금 시스템의 융합으로 지출 패턴이 꾸준히 변화하고 있습니다. 장비 자체는 중요하지만 업그레이드는 소프트웨어 중심이며 수익 구성은 디지털 분야로 전환하고 있습니다. 결과적으로 분자세포유전학 시장의 규모는 단순한 수량 증가가 아니라 광범위한 재분배가 진행되고 있습니다.
2025년에도 FISH법은 분자세포유전학 시장에서 58.21%의 점유율을 유지했습니다. 이는 임상의가 입증된 정확성을 신뢰하고 규제 당국이 명확한 코딩 경로를 인정하고 있기 때문입니다. 그러나 전체 유전체 커버리지와 확장성을 갖춘 aCGH법은 15.60%의 예측 CAGR로 기세를 늘리고 있습니다. 하이브리드 기술도 등장하고 있으며, 면역표현형 해석과 현탁액 멀티플렉스 FISH를 조합함으로써, 1회의 검사로 복수의 전좌를 검출하는 것이 가능하게 되었습니다.
광학 유전체 매핑은 이러한 기술을 보완하여 염색체 검사 단독과 비교하여 혈액 악성 종양의 진단 정확도를 15% 향상시킵니다. 따라서 검사기관은 해상도와 턴어라운드 시간을 극대화하기 위해 여러 가지 방법을 결합합니다. 이 멀티모달 툴킷은 다양한 프로브 화학 및 어레이 형식을 수용할 수 있는 유연한 플랫폼이 미래 조달 전략의 핵심이 되는 이유를 뒷받침합니다.
지역별 분석
북미는 2025년 분자세포유전학 시장의 37.21%를 차지했습니다. 이 지위는 암 유전체학에 대한 메디케어 환급 범위의 확대와 FDA에 의한 실험실 개발 검사(LDT) 감독 체제의 근대화에 의해 유지되고 있습니다. 로슈사가 새로운 AI 연구 기반을 포함한 미국 진단 인프라에 500억 달러를 투자한 사례는 국내 수요에 대한 장기적인 확신을 보여줍니다. 캐나다와 멕시코는 지역 공급망에 편승하여 개발 비용을 전적으로 부담하지 않고 동반진단제에 대한 접근을 확대하고 있습니다.
유럽은 성숙하면서도 기회가 풍부한 시장으로 지속되고 있습니다. 영국의 1억 9,000만 달러 규모 유전체학 투자는 유럽 전역의 데이터 공유 파일럿 사업을 지원하고, EU 지역내의 의료기기 재분류에 의해 인증기간이 단축되고 있습니다. 그러나 엄격한 데이터 주권 규정은 클라우드 이미지 아카이브로의 전환을 지연시킬 수 있으며 공급업체는 온프레미스 암호화 모듈을 제공해야 합니다. 그러나 높은 암 발생률과 전국민 보험제도에 의해 독일, 프랑스, 북유럽 국가에서는 안정된 검체량이 확보되고 있습니다. 아시아태평양은 11.22%라는 가장 높은 CAGR을 기록하고 있으며, 이는 중국에서 인구 규모에 비례하는 암 유전체 분석, 일본의 정밀의료 패널 보험 적용, 인도의 급속히 확대되는 민간 병원 부문에 의해 견인되고 있습니다. 2024년에는 정부 조성 프로그램에 의해 복수의 국가 바이오뱅크 프로젝트가 지원되었으며, 종래에는 감염증 감시에 중점을 둔 검사 네트워크가 확대되었습니다. 호주의 5억 달러 규모 10년 유전체 연구 프로젝트는 지역의 기세를 더욱 견고히 하고 있습니다. 중동 및 아프리카와 남미는 도입 곡선의 초기 단계에 있지만, 암 유병률의 상승과 진단 능력의 구축이 진행되고 있기 때문에 예측기간 중에 세포유전학적 검사의 수주 증가가 예상됩니다.
기타 혜택
- 시장 예측(ME) 엑셀 시트
- 3개월 애널리스트 서포트
자주 묻는 질문
목차
제1장 서론
- 조사 전제조건 및 시장 정의
- 조사 범위
제2장 조사 방법
제3장 주요 요약
제4장 시장 상황
- 시장 개요
- 촉진요인
- 암 및 유전성 질환의 유병률 상승
- 표적요법 및 동반진단에 대한 주목 증가
- 유전체 연구에 대한 공적 및 민간 자금의 확충
- 맞춤형 의료 중심 검사 메뉴의 급속한 보급
- 자동화 및 AI를 활용한 디지털 세포유전학 워크플로
- 클라우드 기반 분산형 이미지 분석 플랫폼의 상승
- 억제요인
- 고처리량 장비 및 FISH 이미저의 높은 자본 비용
- 임상 실험실에서 숙련된 세포유전학 기술자의 부족
- 데이터 주권 및 대규모 유전체 화상 파일의 컴플라이언스 부담
- 어레이 기반 산전 검사 패널에 대한 환급 지연
- Porter's Five Forces 분석
- 신규 참가업체의 위협
- 구매자의 협상력
- 공급자의 협상력
- 대체품의 위협
- 경쟁 기업 간 경쟁 관계
제5장 시장 규모 및 성장 예측(금액)
- 제품별
- 기기
- 키트 및 시약
- 소프트웨어
- 서비스
- 기법별
- 형광제자리부합법(FISH)
- 비교유전체혼성화법(aCGH/CGH)
- 핵형 분석
- 기타 기법
- 용도별
- 암
- 유전성 질환
- 맞춤형 의료
- 기타 용도
- 최종 사용자별
- 임상 및 연구 실험실
- 병원 및 참고 센터
- 학술기관 및 정부기관
- 제약회사, 생명공학기업, CRO
- 지역별
- 북미
- 미국
- 캐나다
- 멕시코
- 유럽
- 독일
- 영국
- 프랑스
- 이탈리아
- 스페인
- 기타 유럽
- 아시아태평양
- 중국
- 일본
- 인도
- 호주
- 한국
- 기타 아시아태평양
- 중동 및 아프리카
- GCC
- 남아프리카
- 기타 중동 및 아프리카
- 남미
- 브라질
- 아르헨티나
- 기타 남미
- 북미
제6장 경쟁 구도
- 시장 집중도
- 시장 점유율 분석
- 기업 프로파일
- Abbott
- Agilent Technologies
- Bio-Rad Laboratories
- F. Hoffmann-La Roche
- Illumina
- Thermo Fisher Scientific
- Danaher(Leica Biosystems & Cytiva)
- PerkinElmer
- Quest Diagnostics
- Oxford Gene Technology
- Empire Genomics
- Genial Genetic Solutions
- CytoTest
- MetaSystems
- Applied Spectral Imaging
- Bionano Genomics
- BioView
- Sysmex
- Fulgent Genetics
- BGI Genomics
제7장 시장 기회 및 미래 전망
CSM 26.01.28The Molecular Cytogenetics Market was valued at USD 3.18 billion in 2025 and estimated to grow from USD 3.47 billion in 2026 to reach USD 5.41 billion by 2031, at a CAGR of 9.25% during the forecast period (2026-2031).
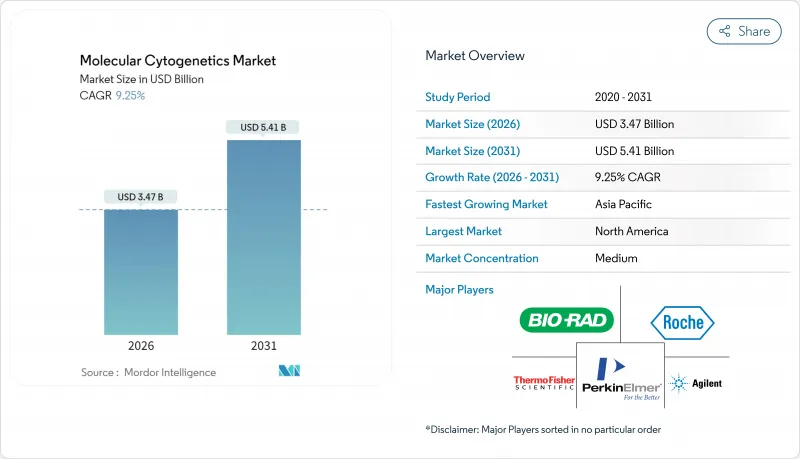
Standardized regulatory pathways from the FDA, expanded reimbursement for oncology-focused genetic tests, and rapid convergence of AI with image-based genomics keep demand on an upward curve fda.gov. Consolidation among smaller laboratories unable to meet the new compliance workload is reshaping competitive dynamics toward integrated platform providers. Companion diagnostics aligned with targeted therapies now form the commercial backbone of routine cytogenetic testing, spurring continuous menu expansion. Laboratories are also accelerating digital transformation to cope with higher specimen volumes, fueling double-digit growth in software solutions that automate karyotype interpretation and integrate cloud-based reporting.
Global Molecular Cytogenetics Market Trends and Insights
Rising Prevalence of Cancer & Genetic Disorders
Sustained escalation in global cancer incidence keeps cytogenetic testing volumes climbing in oncology clinics. Meta-analyses of whole-genome sequencing now show that 79% of solid-tumor cases harbor actionable genomic alterations identifiable through chromosomal analysis. Thalassemia screening programs in southern China and other high-prevalence regions have incorporated third-generation sequencing to uncover rare genotypes that escape conventional assays. As precision oncology gains mainstream status, cytogenetic assays have become indispensable elements of treatment decision algorithms. Their role stretches beyond diagnosis to direct therapy selection, thereby embedding them in long-term cancer care budgets.
Increasing Focus on Targeted Therapies & Companion Diagnostics
In 2024 the FDA cleared additional companion diagnostics, including expansion of PATHWAY HER2 testing to the ultralow category and authorization of TruSight Oncology Comprehensive as the first pancancer IVD kit. Drug sponsors now run more than 30 active companion-diagnostic collaborations, a figure that keeps rising as label claims tighten around molecular subtypes. Reclassification of in situ hybridization systems from Class III to Class II has shortened approval timelines,lowering development risk for start-ups and established players alike. Parallel reimbursement gains through expanded Medicare determinations encourage community oncology practices to adopt cytogenetic profiling as a standard of care. Together these policy shifts embed cytogenetics deeper into routine oncology workflows and accelerate menu innovation.
High Capital Cost of High-Throughput Instruments & FISH Imagers
Acquisition of automated FISH scanners and array systems can exceed USD 1 million per platform, burdening midsize laboratories with multi-year depreciation schedules. AI-enabled image-analysis modules add software licensing fees that further lift the entry bar. Although leasing programs exist, they often lock buyers into consumable minimums that crimp operating margins. Capital pressure is especially acute for facilities aspiring to build full-service menus that span FISH, aCGH, and optical genome mapping.
Other drivers and restraints analyzed in the detailed report include:
- Expansion of Public / Private Funding for Genomic Research
- Rapid Adoption of Personalized-Medicine-Centric Testing Menus
- Shortage of Trained Cytogenetic Technologists
For complete list of drivers and restraints, kindly check the Table Of Contents.
Segment Analysis
Software currently represents the most dynamic growth lever in the molecular cytogenetics market with a 12.08% forecast CAGR. While kits and reagents captured a 55.02% revenue slice in 2025, laboratories are channeling fresh capital toward cloud-native analytics that cut manual review time by half and enable decentralized case sign-out. One proof point is the CHROMA foundation model trained on 4 million chromosomal images, a resource that now underpins automated metaphase spread interpretation. Commercial platforms integrate continuous AI updates without hardware swaps, stretching the useful life of installed microscopes.
Services run in parallel with software, as remote bioinformaticians deliver on-demand validation for smaller sites that lack in-house cytogeneticists. Consumables remain indispensable, especially single-use probe sets tailored to tumor-specific abnormalities. Yet the convergence of cloud, AI, and micro-service billing is steadily redirecting spending patterns. Instruments still matter, but upgrades are software-centric, tilting revenue mix toward digital segments. The upshot is a broad redistribution of the molecular cytogenetics market size rather than a simple volume uplift.
FISH retained 58.21% molecular cytogenetics market share in 2025 because clinicians trust its time-tested accuracy and regulators grant it clear coding pathways. Nonetheless, aCGH is gaining velocity with a 15.60% forecast CAGR due to its genome-wide coverage and scalability. Hybrid techniques are also emerging; immunophenotyped-suspension-multiplex FISH can now detect multiple translocations in one run.
Optical genome mapping complements these methods, adding a 15% diagnostic uplift in hematologic malignancies over karyotyping alone. Laboratories are therefore blending modalities to maximize resolution and turnaround time. This multimodal toolkit underscores why future procurement strategies will revolve around flexible platforms capable of handling diverse probe chemistries and array formats.
The Molecular Cytogenetics Market Report Segments the Industry Into by Product (Instruments, and More), Technique (Fluorescence in Situ Hybridization, and More), Application (Cancer, Genetic Disorders, and More), End User (Clinical and Research Laboratories, and More), and Geography (North America, Europe, Asia-Pacific, Middle East and Africa, South America). The Market Forecasts are Provided in Terms of Value (USD).
Geography Analysis
North America retained 37.21% of the molecular cytogenetics market in 2025, a position safeguarded by Medicare reimbursement expansions for oncology genomics and by the FDA's modernization of laboratory-developed test oversight. Roche's USD 50 billion outlay on US diagnostics infrastructure including new AI research hubs signals long-term confidence in domestic demand. Canada and Mexico ride piggyback on regional supply chains, broadening access to companion diagnostics without shouldering full development costs.
Europe remains a mature but opportunity-rich arena. The UK's USD 190 million genomics investment supports pan-European data-sharing pilots, and device reclassifications across the EU shorten certification timeframes. Yet strict data-sovereignty rules can slow the shift to cloud-based imaging archives, obliging vendors to offer on-premise encryption modules. High cancer incidence and universal health coverage nonetheless ensure steady specimen volumes across Germany, France, and the Nordics. Asia-Pacific records the fastest 11.22% CAGR, driven by China's population-scale oncology sequencing, Japan's reimbursement of precision-medicine panels, and India's rapidly expanding private hospital sector. Government grant programs underwrote multiple national biobank projects in 2024, widening laboratory networks that previously focused on infectious disease surveillance. Australia's USD 500 million decade-long genomics commitment further cements regional momentum. Middle East & Africa and South America sit on the adoption curve's early slope, yet rising cancer prevalence and diagnostics capacity building hint at an uptick in cytogenetic orders over the forecast horizon.
- Abbott Laboratories
- Agilent Technologies
- Bio-Rad Laboratories
- Roche
- Illumina
- Thermo Fisher Scientific
- Danaher (Leica Biosystems & Cytiva)
- PerkinElmer
- Quest Diagnostics
- Oxford Gene Technology
- Empire Genomics
- Genial Genetic Solutions
- CytoTest
- MetaSystems
- Applied Spectral Imaging
- Bionano Genomics
- BioView
- Sysmex
- Fulgent Genetics
- BGI
Additional Benefits:
- The market estimate (ME) sheet in Excel format
- 3 months of analyst support
TABLE OF CONTENTS
1 Introduction
- 1.1 Study Assumptions & Market Definition
- 1.2 Scope of the Study
2 Research Methodology
3 Executive Summary
4 Market Landscape
- 4.1 Market Overview
- 4.2 Market Drivers
- 4.2.1 Rising Prevalence of Cancer & Genetic Disorders
- 4.2.2 Increasing Focus on Targeted Therapies & Companion Diagnostics
- 4.2.3 Expansion of Public / Private Funding For Genomic Research
- 4.2.4 Rapid Adoption Of Personalized-Medicine-Centric Testing Menus
- 4.2.5 Automation & AI-Enabled Digital Cytogenetics Workflows
- 4.2.6 Emergence of Cloud-Based, Decentralised Image-Analysis Platforms
- 4.3 Market Restraints
- 4.3.1 High Capital Cost of High-Throughput Instruments & FISH Imagers
- 4.3.2 Shortage of Trained Cytogenetic Technologists in Clinical Labs
- 4.3.3 Data-Sovereignty / Compliance Burden for Large Genomic-Image Files
- 4.3.4 Reimbursement Delays for Array-Based Prenatal Testing Panels
- 4.4 Porter's Five Forces Analysis
- 4.4.1 Threat of New Entrants
- 4.4.2 Bargaining Power of Buyers
- 4.4.3 Bargaining Power of Suppliers
- 4.4.4 Threat of Substitutes
- 4.4.5 Competitive Rivalry
5 Market Size & Growth Forecasts (Value in USD)
- 5.1 By Product
- 5.1.1 Instruments
- 5.1.2 Kits & Reagents
- 5.1.3 Software
- 5.1.4 Services
- 5.2 By Technique
- 5.2.1 Fluorescence in Situ Hybridisation (FISH)
- 5.2.2 Array / Comparative Genomic Hybridisation (aCGH / CGH)
- 5.2.3 Karyotyping
- 5.2.4 Other Techniques
- 5.3 By Application
- 5.3.1 Cancer
- 5.3.2 Genetic Disorders
- 5.3.3 Personalised Medicine
- 5.3.4 Other Applications
- 5.4 By End User
- 5.4.1 Clinical and Research Laboratories
- 5.4.2 Hospitals and Reference Centres
- 5.4.3 Academic and Government Institutes
- 5.4.4 Pharmaceutical, Biotechnology Companies and CROs
- 5.5 By Geography
- 5.5.1 North America
- 5.5.1.1 United States
- 5.5.1.2 Canada
- 5.5.1.3 Mexico
- 5.5.2 Europe
- 5.5.2.1 Germany
- 5.5.2.2 United Kingdom
- 5.5.2.3 France
- 5.5.2.4 Italy
- 5.5.2.5 Spain
- 5.5.2.6 Rest of Europe
- 5.5.3 Asia-Pacific
- 5.5.3.1 China
- 5.5.3.2 Japan
- 5.5.3.3 India
- 5.5.3.4 Australia
- 5.5.3.5 South Korea
- 5.5.3.6 Rest of Asia-Pacific
- 5.5.4 Middle East & Africa
- 5.5.4.1 GCC
- 5.5.4.2 South Africa
- 5.5.4.3 Rest of Middle East & Africa
- 5.5.5 South America
- 5.5.5.1 Brazil
- 5.5.5.2 Argentina
- 5.5.5.3 Rest of South America
- 5.5.1 North America
6 Competitive Landscape
- 6.1 Market Concentration
- 6.2 Market Share Analysis
- 6.3 Company Profiles (includes Global level Overview, Market level overview, Core Segments, Financials as available, Strategic Information, Market Rank/Share for key companies, Products & Services, and Recent Developments)
- 6.3.1 Abbott
- 6.3.2 Agilent Technologies
- 6.3.3 Bio-Rad Laboratories
- 6.3.4 F. Hoffmann-La Roche
- 6.3.5 Illumina
- 6.3.6 Thermo Fisher Scientific
- 6.3.7 Danaher (Leica Biosystems & Cytiva)
- 6.3.8 PerkinElmer
- 6.3.9 Quest Diagnostics
- 6.3.10 Oxford Gene Technology
- 6.3.11 Empire Genomics
- 6.3.12 Genial Genetic Solutions
- 6.3.13 CytoTest
- 6.3.14 MetaSystems
- 6.3.15 Applied Spectral Imaging
- 6.3.16 Bionano Genomics
- 6.3.17 BioView
- 6.3.18 Sysmex
- 6.3.19 Fulgent Genetics
- 6.3.20 BGI Genomics
7 Market Opportunities & Future Outlook
- 7.1 White-space & Unmet-Need Assessment
