
|
시장보고서
상품코드
1906082
그린 석유 코크스 및 소성 석유 코크스 시장 : 점유율 분석, 업계 동향, 통계, 성장 예측(2026-2031년)Green Petroleum Coke And Calcined Petroleum Coke - Market Share Analysis, Industry Trends & Statistics, Growth Forecasts (2026 - 2031) |
||||||
그린 석유 코크스 및 소성 석유 코크스 시장은 2025년에 193억 6,000만 달러로 평가되었으며, 2026년 202억 7,000만 달러, 2031년까지 255억 달러에 이를 것으로 예상됩니다. 예측 기간(2026-2031년)동안 CAGR은 4.72%를 나타낼 전망입니다.

이 꾸준한 상승은 중동 및 아시아 태평양 지역에서의 지연된 코크스 투자, 중국의 애노드 부문에서의 황 제한 강화, 저황 등급과 높은 황 등급 사이의 가격 차이 확대를 반영한다. 아시아 태평양 지역은 알루미늄 정련소와 시멘트 공장이 증가하는 수요를 흡수하는 가운데 수요의 주도권을 유지하는 한편, 사우디 아라비아, 아랍 에미리트, 나이지리아의 신규 복합 시설이 수출 가능한 공급량을 증가시키고 있습니다. 유럽 연합(EU)과 북미 지역의 환경 규제는 무역 경로를 재구성하고 낮은 배출원 및 수직 통합 공급업체를 우월하게 하고 있습니다. 경쟁 역학은 정유업자가 녹색 코크 원료의 관리를 강화하고, 독립 계열 소련업자가 마진 압력에도 불구하고 생산 능력을 강화하고 있으며, 초저황 코크 등의 특수 등급이 리튬 이온 전지용 애노드 재료로서 프리미엄을 획득하고 있음을 밝혔다.
세계의 그린 석유 코크스 및 소성 석유 코크스 시장 동향과 인사이트
알루미늄 정련 능력 확대
2024년, 세계의 알루미늄 생산에는 상당한 양의 붕소 코크스가 필요했습니다. 이 수요는 고품질 저황 원료의 구조적인 저가를 굳혔습니다. 중국은 상당한 비율을 소비했습니다. 그러나 전력 가격 하락과 새로운 제련소가 장기 LNG 계약을 확보함에 따라 지역 제련소의 성장은 인도와 걸프 협력 회의 (GCC) 국가로 전환했습니다. 오만과 브라질의 새로운 소성 프로젝트가 세계 경쟁을 격화시키고 있지만, 이들 시설의 대부분은 여전히 다른 지역에서 수입한 저황색의 녹색 코크스에 의존하고 있습니다. 황 함량의 상한과 바나듐의 제한과 같은 품질 기준의 엄격화는 사내에서 스트림을 관리할 수 있는 통합 정제업자에게 유리하며, 그 결과 고황 생산자의 마진이 압박됩니다. 또한, 제련소는 현재 범위 1 CO2 배출량의 상한을 장기 인수 계약에 통합하고 있으며, 낮은 배출 코크스 등급의 가치를 더욱 높이고 있습니다.
시멘트 킬른에서 연료 페트 코크의 석탄에 대한 비용 이점
2025년 고유황 페토코크는 석탄에 비해 상당한 가격 차이를 유지했으며 운임 변동에도 불구하고 킬른 수요를 지원했습니다. 인도는 수입 관세를 낮추고 터키는 미국산 페트코크 관세를 철폐하고 수요 기반을 확대했습니다. 향후의 동향으로서는 허리케인 시즌 중에 가격차가 축소되는 경향이 보이고 일부 생산자가 복수 분기 계약을 확보하는 움직임이 나오고 있습니다. 탈탄소화 로드맵은 2050년까지 페토코크, 석탄, 바이오매스의 과도적인 킬른 연료 구성을 상정하고 있으며, 탄소 비용이 상승하는 가운데 페토코크의 중기적인 틈새 시장은 유지될 전망이다. 인도 및 미국 항만의 지붕 저장 시설의 의무화는 취급 비용을 증가시키지만 대부분의 가격 시나리오에서 석탄에 대한 연료 비용의 우위는 유지되고 있습니다.
유럽 연합의 보다 엄격한 SOx/PM 규제 및 탄소 국경 조정
EU의 탄소 국경 조정 메커니즘은 이행기 보고 단계에 들어가 향후 수년간 과징금이 도입될 전망이다. 페토코크 등의 잔류 제품은 미래에 단계적으로 대상이 될 전망입니다. 수입업체는 직접 및 간접 배출량에 더해 원산지의 탄소 가격을 공개할 필요가 있으며, 고황황 코크스의 비용 우위성은 축소 경향에 있습니다. 미국에서는 단독 칼시너가 대량의 이산화황을 배출하고 있음에도 불구하고 많은 시설에서 탈황장치가 미설치입니다. 연방 규제가 EU 기준에 따라 강화되면, 개수로 인한 고정비 증가는 배출량이 적은 플랜트로 무역 재편을 촉구할 수 있다.
세그먼트 분석
2025년 시점의 그린 석유 코크스 및 소성 석유 코크스 시장에서 연료 등급 제품은 60.95%의 점유율을 차지했습니다. 이것은 시멘트 킬른과 보일러의 수요에 견인되었습니다. 가격은 여전히 석탄을 밑돌고 있지만 역사적인 기준과 비교하면 그 차이는 줄어들고 있습니다. 많은 정유소는 연료 등급 생산량을 우선시하기 위해 지연 코크스로의 작동 조건을 최적화하고 품질보다 진공 잔류 물을 극대화합니다. 연료 급료 공급을 위한 그린 석유 코크스 및 소성 석유 코크스 시장 규모는 예측 기간 동안 꾸준히 성장할 것으로 예상된다.
알루미늄 양극의 확장과 이산화티탄, 재탄화제, 흑연 전극의 특수 수요에 자극되어 5.76%의 CAGR로 성장하고 있습니다. 인도, 오만, 중국의 플랜트 증설로 향후 수년간 세계의 야키 코크스 생산 능력이 크게 증가할 수 있다. 그러나, 황 함유량이 3% 미만으로 엄격화됨으로써 유효한 원료가 제한되고, 정유소는 탈황 첨가제의 적용이나 용도에 적합한 원료의 블렌드를 강요받고 있습니다. 이 세그먼트는 진동에 의한 벌크 밀도 프리미엄과 낮은 금속 불순물 허용치에 의해 높은 마진을 확보하고 있지만, 가까운 장래의 공급 과잉 리스크가 스팟 가격 차이에 압력을 가할 가능성이 있습니다.
지역별 분석
아시아 태평양 지역은 2025년에 47.90%의 수익 점유율을 차지했고 중국의 방대한 석유 코크스 수요와 알루미늄용 프리베이크 설비가 견인했습니다. 미연소 코크스의 수입량은 전년 대비 증가하여 미국, 러시아, 사우디 아라비아가 주요 공급원이 되고 있다. 일본과 한국은 선진적인 침상 코크스 기술을 유지하면서 ASEAN 국가의 시멘트 킬른은 변동하는 LNG 가격 중 비용 관리를 위해 고황황 석유 코크스를 석탄 대체로 사용하고 있습니다.
중동과 아프리카의 그린 석유 코크스 및 소성 석유 코크스 시장은 사우디 아라비아, UAE, 쿠웨이트, 이집트, 나이지리아에서 신규 코크스화 설비의 도입으로 원료 공급량이 증가할 것으로 전망되며, 2031년까지 CAGR 5.62%로 확대될 전망입니다. 단고트사의 정유소와 같은 통합형 복합시설은 경질 제품의 수출에서 벗어나 중질 잔류물 스트림의 수익화를 진행하고 있습니다. 바레인과 오만의 알루미늄 제련소에 대한 근접성은 공급망을 단축시키고, 아라비아산 중질 원유의 저황 특성은 고품질의 버그 코크스의 생산을 가능하게 한다.
북미는 여전히 가장 큰 수출 지역이며 세계의 녹색 코크스 생산량의 대부분을 차지하고 있습니다. 그러나 미국 서해안과 멕시코 걸프 지역의 항만 주변 환경 규제로 물류 비용이 증가하고 있기 때문에 일부 정유업체들은 아시아를 대상으로 하는 선상 전달(FOB)의 장기 계약을 체결하는 움직임을 볼 수 있다. 유럽에서는 정유소의 처리량 감소로 국내 공급이 억제되는 반면 저황 CPC에 대한 수요는 지속되고 있습니다. 2026년부터 시작된 EU의 탄소 경계 조정 메커니즘(CBAM) 과징금은 범위 1 배출량이 낮은 중동산 원료로 구매자의 이동을 촉진할 전망이다.
기타 혜택 :
- 엑셀 형식의 시장 예측(ME) 시트
- 애널리스트에 의한 3개월간의 지원
자주 묻는 질문
목차
제1장 소개
- 조사의 전제 조건과 시장의 정의
- 조사 범위
제2장 조사 방법
제3장 요약
제4장 시장 정세
- 시장 개요
- 시장 촉진 요인
- 알루미늄 제련 생산 능력 확장 증가
- 시멘트 소성로에서 석탄 대비 연료급 펫코크(Petcoke)의 가격 경쟁력
- 중동 지역 정유공장의 지연코킹공정(Delayed Coking Unit) 설비 증설
- 전기로(EAF) 제강용 흑연 전극에서 니들급 소성 코크스(CPC) 수요 증가
- 리튬 이온 배터리 음극재용 초저유황 코크스
- 시장 억제 요인
- 원유 크랙스프레드의 변동으로 GPC의 공급 불안정
- EU 내 더욱 엄격해진 황산화물(SOx)/미세먼지(PM) 배출 제한 및 탄소국경조정제도(CBAM)
- 항구 도시 내 펫코크 취급에 대한 지역 사회의 반대
- 밸류체인 분석
- 포터의 파이브포스
- 공급기업의 협상력
- 구매자의 협상력
- 신규 참가업체의 위협
- 대체품의 위협
- 경합의 정도
제5장 시장 규모와 성장 예측
- 타입별
- 연료 등급
- 소성 코크스
- 용도
- 그린 석유 코크스
- 알루미늄
- 연료
- 철강
- 실리콘 메탈
- 기타(벽돌, 유리, 탄소 제품 등)
- 소성 석유 코크스
- 알루미늄
- 이산화티타늄
- 재탄화제 시장
- 기타(니들 코크스, 탄소 제품 등)
- 그린 석유 코크스
- 지역별
- 아시아 태평양 지역
- 중국
- 인도
- 일본
- 한국
- ASEAN
- 기타 아시아 태평양 지역
- 북미
- 미국
- 캐나다
- 멕시코
- 유럽
- 독일
- 영국
- 프랑스
- 이탈리아
- 스페인
- 러시아
- 기타 유럽 지역
- 남미
- 브라질
- 아르헨티나
- 그 외 남미
- 중동 및 아프리카
- 사우디 아라비아
- 남아프리카
- 그 외의 중동 및 아프리카
- 아시아 태평양 지역
제6장 경쟁 상황
- 시장 집중도
- 전략적 동향
- 시장 점유율(%)/순위 분석
- 기업 프로필
- Aluminium Bahrain BSC(Alba)
- BP plc
- Chevron Corp
- China Petroleum & Chemical Corporation(Sinopec)
- CNOOC Limited
- ELSID SA
- Exxon Mobil Corp
- Indian Oil Corporation
- Maniayargroup
- Marathon Petroleum
- Numaligarh Refinery Limited
- Oxbow Corporation
- Petrocoque
- Phillips 66 Company
- Rain Carbon Inc.
- Reliance Industries Ltd
- Rio Tinto
- Saudi Aramco
- Saudi Calcined Petroleum Coke Company(SCPC)
- Valero Energy Corp
- Zhenjiang Coking And Gas Group Co. Ltd
제7장 시장 기회와 장래의 전망
KSL 26.01.28The Green Petroleum Coke And Calcined Petroleum Coke Market was valued at USD 19.36 billion in 2025 and estimated to grow from USD 20.27 billion in 2026 to reach USD 25.54 billion by 2031, at a CAGR of 4.72% during the forecast period (2026-2031).
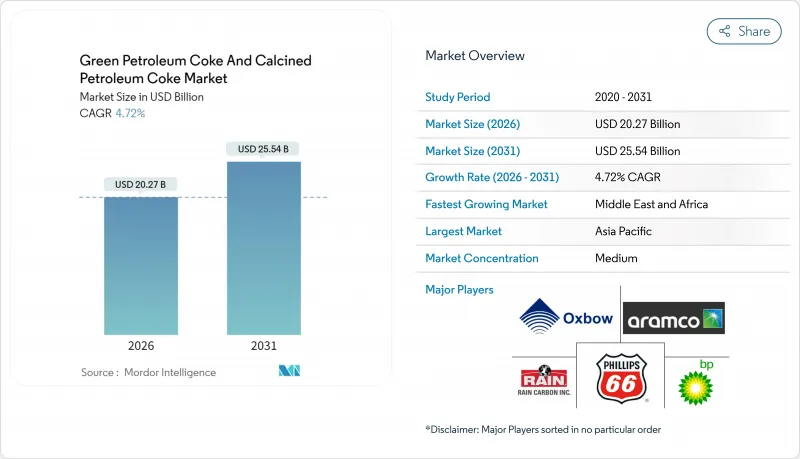
This steady climb reflects delayed coking investments in the Middle East and Asia-Pacific, tightening sulfur limits in China's anode sector, and widening price spreads between low-sulfur and high-sulfur grades. The Asia-Pacific region retains its demand leadership as aluminium smelters and cement plants absorb growing volumes, while new complexes in Saudi Arabia, the United Arab Emirates, and Nigeria increase exportable supply. Environmental regulations in the European Union and North America are reshaping trade lanes, favoring low-emission origins and vertically integrated suppliers. Competitive dynamics reveal refiners tightening their control over green coke feedstock, independent calciners adding capacity despite margin pressure, and specialty grades, such as ultra-low-sulfur coke, capturing premiums for use in lithium-ion battery anodes.
Global Green Petroleum Coke And Calcined Petroleum Coke Market Trends and Insights
Rising Aluminium Smelting Capacity Expansions
In 2024, the global aluminium output necessitated a significant amount of calcined coke. This demand solidifies a structural floor for premium low-sulfur feedstocks. China, the dominant player, consumed a substantial share. However, as power prices decline and new smelters secure long-term LNG contracts, regional smelter growth is pivoting towards India and the Gulf Cooperation Council states. While new calcining projects in Oman and Brazil heighten global competition, many of these facilities still rely on imported low-sulfur green coke from other regions. Tightening quality standards-such as stricter sulfur caps and vanadium restrictions-benefit integrated refiners who can manage streams internally, thereby squeezing margins for high-sulfur producers. Additionally, smelters are now incorporating scope-1 CO2 intensity ceilings into long-term offtake contracts, further elevating the value of low-emission coke grades.
Fuel-Grade Petcoke Cost Advantage Over Coal in Cement Kilns
In 2025, high-sulfur petcoke maintained a significant discount to coal, sustaining kiln demand despite volatile freight. India reduced import duties, while Turkey removed tariffs on U.S. supplies, broadening accessible demand pools. Forward trends indicate that discounts are narrowing during hurricane season, prompting some producers to secure multi-quarter contracts. Decarbonization roadmaps envision a transitional kiln fuel split of petcoke, coal, and biomass by 2050, preserving a medium-term niche for petcoke even as carbon costs rise. Covered storage mandates at Indian and U.S. ports add handling costs, yet the net fuel advantage over coal remains intact under most price scenarios.
Stricter SOx/PM Limits and Carbon Border Adjustment in European Union
The EU Carbon Border Adjustment Mechanism has entered transitional reporting and will impose fees in the coming years, with residual products, such as petcoke, positioned for phased inclusion in the future. Importers must disclose direct and indirect emissions, as well as the carbon prices in their origin countries, narrowing the cost advantages for high-sulfur coke. In the United States, stand-alone calciners emitted significant levels of SO2, yet many still lack scrubbers. If federal limits tighten to match EU standards, retrofits could add fixed costs, reshaping trade toward lower-emission plants.
Other drivers and restraints analyzed in the detailed report include:
- Capacity Build-Out of Delayed Coking Units in Middle-East Refineries
- Ultra-Low-Sulfur Coke for Li-Ion Battery Anodes
- Community Opposition to Petcoke Handling in Port Cities
For complete list of drivers and restraints, kindly check the Table Of Contents.
Segment Analysis
Fuel-grade material held 60.95% of the Green Petroleum Coke and Calcined Petroleum Coke Market share in 2025, driven by demand from cement kilns and boilers. Prices are still undercutting coal, although the discount has narrowed against historical norms. Many refineries optimize delayed-coker operating severity to favor fuel-grade volumes, maximizing vacuum resid destruction over quality. The green petroleum coke and calcined petcoke market size for fuel-grade supply is expected to grow steadily during the forecast period.
Calcined coke is advancing at a 5.76% CAGR, stimulated by aluminium anode expansions and specialty demands in titanium dioxide, recarburizers, and graphite electrodes. Plant additions in India, Oman, and China could significantly increase global calcined capacity in the coming years. Yet sulfur tightening below 3% crimps effective feedstock, prompting refiners to apply desulfurizing additives and blend fit-for-purpose streams. The segment captures higher margins owing to vibrated bulk-density premiums and low metal impurity thresholds, although oversupply risk in the near future may pressure spot differentials.
The Green Petroleum Coke and Calcined Petroleum Coke Market Report is Segmented by Type (Fuel Grade and Calcined Coke), Application (Green Petroleum Coke: Aluminum, Fuel, Iron and Steel, Silicon Metal, and Others; Calcined Petroleum Coke: Aluminum, Titanium Dioxide, Re-Carburizing Market, and Others), and Geography (Asia-Pacific, North America, Europe, and More). The Market Forecasts are Provided in Terms of Value (USD).
Geography Analysis
Asia-Pacific captured 47.90% revenue share in 2025, anchored by China's substantial petcoke requirement and aluminium prebake capacity. Imports of uncalcined coke increased year over year, with the United States, Russia, and Saudi Arabia supplying the bulk. Japan and South Korea maintain advanced needle coke technology, while ASEAN cement kilns substitute high-sulfur pet coke for coal to manage costs amid volatile LNG prices.
The Middle East and Africa Green Petroleum Coke and Calcined Petroleum Coke Market is projected to grow at a 5.62% CAGR through 2031, driven by the introduction of new coking trains in Saudi Arabia, the UAE, Kuwait, Egypt, and Nigeria, which is expected to increase feedstock availability. Integrated complexes such as Dangote's refinery are moving beyond light-product exports to monetize heavy residue streams. Proximity to aluminium smelters in Bahrain and Oman shortens supply chains, while lower sulfur in Arabian medium crudes enables premium calcined output.
North America remains the largest exporter, accounting for a significant portion of the global green coke production. However, port-side environmental constraints on the U.S. West Coast and Gulf Coast increase logistics costs, prompting some refiners to enter long-term contracts for Asia-bound shipments delivered ex-ship. Europe's declining refinery slate curbs indigenous supply even as demand for low-sulfur CPC persists; EU CBAM fees, starting from 2026, will likely shift buyers toward Middle Eastern streams with lower scope-1 emissions profiles.
- Aluminium Bahrain B.S.C. (Alba)
- BP p.l.c
- Chevron Corp
- China Petroleum & Chemical Corporation (Sinopec)
- CNOOC Limited
- ELSID SA
- Exxon Mobil Corp
- Indian Oil Corporation
- Maniayargroup
- Marathon Petroleum
- Numaligarh Refinery Limited
- Oxbow Corporation
- Petrocoque
- Phillips 66 Company
- Rain Carbon Inc.
- Reliance Industries Ltd
- Rio Tinto
- Saudi Aramco
- Saudi Calcined Petroleum Coke Company (SCPC)
- Valero Energy Corp
- Zhenjiang Coking And Gas Group Co. Ltd
Additional Benefits:
- The market estimate (ME) sheet in Excel format
- 3 months of analyst support
TABLE OF CONTENTS
1 Introduction
- 1.1 Study Assumptions and Market Definition
- 1.2 Scope of the Study
2 Research Methodology
3 Executive Summary
4 Market Landscape
- 4.1 Market Overview
- 4.2 Market Drivers
- 4.2.1 Rising aluminium smelting capacity expansions
- 4.2.2 Fuel-grade petcoke cost advantage over coal in cement kilns
- 4.2.3 Capacity build-out of delayed coking units in Middle-East refineries
- 4.2.4 Needle-grade CPC demand from graphite electrodes for EAF steel
- 4.2.5 Ultra-low-sulfur coke for Li-ion battery anodes
- 4.3 Market Restraints
- 4.3.1 Volatile crude-oil crack spreads impacting GPC availability
- 4.3.2 Stricter SOx/PM limits and Carbon Border Adjustment in European Union
- 4.3.3 Community opposition to petcoke handling in port cities
- 4.4 Value Chain Analysis
- 4.5 Porter's Five Forces
- 4.5.1 Bargaining Power of Suppliers
- 4.5.2 Bargaining Power of Buyers
- 4.5.3 Threat of New Entrants
- 4.5.4 Threat of Substitutes
- 4.5.5 Degree of Competition
5 Market Size and Growth Forecasts (Value)
- 5.1 Type
- 5.1.1 Fuel Grade
- 5.1.2 Calcined Coke
- 5.2 Application
- 5.2.1 Green Petroleum Coke
- 5.2.1.1 Aluminum
- 5.2.1.2 Fuel
- 5.2.1.3 Iron and steel
- 5.2.1.4 Silicon Metal
- 5.2.1.5 Others (Bricks, Glass, Carbon Products, etc)
- 5.2.2 Calcined Petroleum Coke
- 5.2.2.1 Aluminum
- 5.2.2.2 Titanium Dioxide
- 5.2.2.3 Re-carburizing Market
- 5.2.2.4 Others (Needle Coke, Carbon Products, etc)
- 5.2.1 Green Petroleum Coke
- 5.3 By Geography
- 5.3.1 Asia-Pacific
- 5.3.1.1 China
- 5.3.1.2 India
- 5.3.1.3 Japan
- 5.3.1.4 South Korea
- 5.3.1.5 ASEAN Countries
- 5.3.1.6 Rest of Asia-Pacific
- 5.3.2 North America
- 5.3.2.1 United States
- 5.3.2.2 Canada
- 5.3.2.3 Mexico
- 5.3.3 Europe
- 5.3.3.1 Germany
- 5.3.3.2 United Kingdom
- 5.3.3.3 France
- 5.3.3.4 Italy
- 5.3.3.5 Spain
- 5.3.3.6 Russia
- 5.3.3.7 Rest of Europe
- 5.3.4 South America
- 5.3.4.1 Brazil
- 5.3.4.2 Argentina
- 5.3.4.3 Rest of South America
- 5.3.5 Middle-East and Africa
- 5.3.5.1 Saudi Arabia
- 5.3.5.2 South Africa
- 5.3.5.3 Rest of Middle-East and Africa
- 5.3.1 Asia-Pacific
6 Competitive Landscape
- 6.1 Market Concentration
- 6.2 Strategic Moves
- 6.3 Market Share (%)/Ranking Analysis
- 6.4 Company Profiles (includes Global level Overview, Market level overview, Core Segments, Financials as available, Strategic Information, Market Rank/Share, Products and Services, and Recent Developments)
- 6.4.1 Aluminium Bahrain B.S.C. (Alba)
- 6.4.2 BP p.l.c
- 6.4.3 Chevron Corp
- 6.4.4 China Petroleum & Chemical Corporation (Sinopec)
- 6.4.5 CNOOC Limited
- 6.4.6 ELSID SA
- 6.4.7 Exxon Mobil Corp
- 6.4.8 Indian Oil Corporation
- 6.4.9 Maniayargroup
- 6.4.10 Marathon Petroleum
- 6.4.11 Numaligarh Refinery Limited
- 6.4.12 Oxbow Corporation
- 6.4.13 Petrocoque
- 6.4.14 Phillips 66 Company
- 6.4.15 Rain Carbon Inc.
- 6.4.16 Reliance Industries Ltd
- 6.4.17 Rio Tinto
- 6.4.18 Saudi Aramco
- 6.4.19 Saudi Calcined Petroleum Coke Company (SCPC)
- 6.4.20 Valero Energy Corp
- 6.4.21 Zhenjiang Coking And Gas Group Co. Ltd
7 Market Opportunities and Future Outlook
- 7.1 White-space and Unmet-Need Assessment

