


|
시장보고서
상품코드
1906089
위치 기반 VR 시장 : 점유율 분석, 업계 동향 및 통계, 성장 예측(2026-2031년)Location-Based VR - Market Share Analysis, Industry Trends & Statistics, Growth Forecasts (2026 - 2031) |
||||||
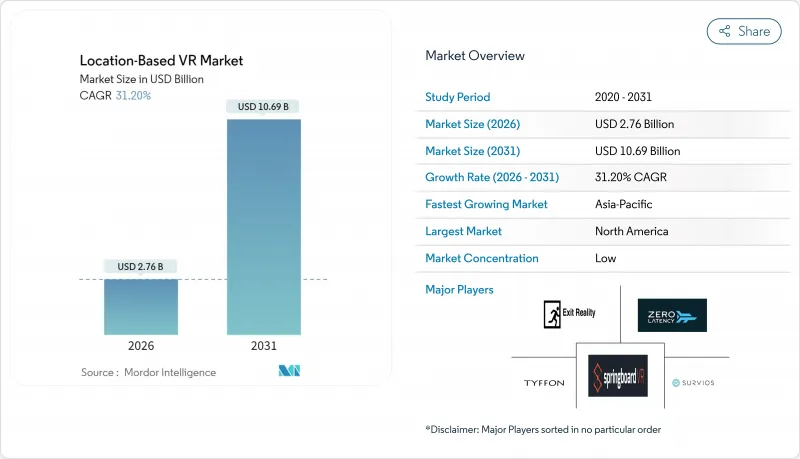
위치 기반 VR 시장은 2025년 21억 달러로 평가되었고, 2026년 27억 6,000만 달러에서 2031년까지 106억 9,000만 달러에 이를 것으로 예측됩니다.
예측기간(2026-2031년) 동안의 CAGR은 31.2%로 전망되고 있습니다.

이러한 성장 가속은 하드웨어 가격 하락, 인기 IP(지적 재산)와의 제휴 증가, 시설 경제성을 향상시키는 인프라 정비의 진전에 의해 발생합니다. 사업자들은 현재 시설을 볼링장, 영화관, 탈출 게임 시설과 경쟁하는 안정적인 수익원으로 전환하고 있습니다. 소비자의 사교 체험에 대한 수요, 프랜차이즈 전개의 활성화, 도시재생지원 보조금의 뒷받침으로 시장 확대는 순조롭게 진행되고 있습니다. 장비 제조업체는 예측 진단 기능과 유지 보수 효율을 높이기 위해 무선 기능을 추가하는 등 시설 요구에 대응합니다. 동시에 소프트웨어 플랫폼은 렌더링을 클라우드로 마이그레이션하고 컨텐츠 업데이트 주기를 단축하여 반복 방문을 통해 수익을 창출합니다. 이러한 요인들이 결합되어 위치 기반 VR 시장은 견조한 성장 궤도에 오르고 있습니다.
세계의 위치 기반 VR 시장의 동향 및 인사이트
하드웨어 비용의 급격한 저하로 사업자의 투자 이익률 향상
장비 가격의 하락과 무선 시스템의 배선 비용 절감으로 시설의 경제성이 향상되었습니다. 제로 레이턴시사의 8인용 시스템은 현재 24만 5,000달러로 전세대 대비 30% 저렴하면서 5K 해상도와 무선 스트리밍 기능을 추가하였습니다. 무선 팩을 사용하면 많은 시간이 소요되는 설정 작업이 필요 없으며 직원의 재생 세션 대응이 빨라집니다. 헤드셋이 내장된 예측 진단 기능은 예기치 않은 다운타임을 줄이고 유지보수 예산을 줄입니다. 설비투자액의 감소와 인원 감축에 의해 입지조건이 좋은 시설에서는 투자회수기간이 3년부터 최단 18개월까지 단축됩니다. 가격 하락세는 소규모 사업자에게도 위치 기반 VR 시장에 대한 진입 의욕을 고취하여 시설의 설치 기반을 확대하고 있습니다.
몰입형 외부활동 체험에 대한 소비자 수요 증가
소비자는 가정에서 재현할 수 없는 공유 체험을 위해 가처분소득 지출을 늘리고 있습니다. 샌드박스 VR은 2024년 140만 장의 티켓을 판매하여 전년 대비 33% 증가했으며 미국의 평균 고객 단가는 53달러였습니다. 그룹 예약이 주류였으며, 방문자의 85%가 3-6명의 참가자를 동반하여, 소셜 플레이의 매력이 나타나고 있습니다. 조사에 의하면, 젊은 층은 현재 물질적인 물품보다 추억 등을 중시하고 있으며 이러한 기호가 거시 경제 상황이 불안정한 시기에서도 안정적인 방문자 수를 뒷받침하고 있습니다. 운영회사는 이 동향을 살려 식음료와 상품 판매를 외부활동 체험에 통합함으로써 1인당 지출액과 이익률을 향상시키고 있습니다.
높은 초기 설비투자 및 유지관리비
최근 실현된 비용 절감 후에도 시설 전체의 운영에는 여전히 많은 자본이 필요합니다. 파크플레이그라운드의 프랜차이즈 키트에는 35만 파운드(44만8,000달러)의 초기 자금이 필요하며, 투자자는 첫 해 60만파운드(76만8,000달러)의 수익을 목표로 약 20개월 만에 손익분기점에 이르는 것을 목표로 하고 있습니다. 연간 유지비는 설비가치의 10-15%에 달하며 컨텐츠 라이선스는 타이틀당 수천 달러가 추가로 필요합니다. 지방도시에서는 부동산비, 보험료, 숙련 기술자의 인건비에 의해 손익분기점이 더욱 높아집니다. 이 비용 장벽은 자금 조달 수단이 제한된 신흥국 시장에서의 보급을 늦추고 있습니다.
부문 분석
2024년 시설 지출의 대부분은 하드웨어가 차지했으며 이는 헤드마운트 디스플레이, 트래킹 카메라, 네트워크 장비의 가격이 높기 때문입니다. 업무용 헤드셋은 1대당 800-3,000달러로 일반 모델을 크게 웃돌고, 사업자는 다운타임 단축을 위해 예비 기기를 보유해야 합니다. 네트워크 연결 스토리지, GPU 서버, 안전 장비도 비용을 높입니다.
하드웨어의 이점은 현재 지출 구성을 반영하지만 소프트웨어 부문은 현재 33.15%의 연평균 복합 성장률(CAGR)로 가장 빠르게 성장하고 있습니다. NVIDIA CloudXR과 같은 엣지 클라우드 파이프라인을 통해 시설은 오프사이트 서버에서 실제와 같은 환경을 스트리밍할 수 있습니다. 구독 모델은 불규칙한 투자를 관리 가능한 월별 요금으로 변환하고 클라우드 호스팅 분석은 체류 시간 및 전환 퍼널에 대한 운영자 지침을 제공합니다. 소프트웨어로의 전환은 이익률을 향상시키고, 현금 흐름을 안정화하며, 경기 침체에 대한 안정성을 제공합니다.
VR 놀이시설은 소규모 설치 면적에서 신속한 세션 회전을 실현하여 쇼핑몰이나 번화가에 적합합니다. 2025년에는 45.60%의 점유율을 차지하였으며, 세입자 유치에 의한 집객 효과를 중시하는 부동산 소유자로부터 인기를 얻고 있습니다. 운영회사는 셀프서비스 단말을 이용하는 레이아웃 개선으로 대기시간을 단축하고, 간식이나 상품 판매 등 부수적인 지출을 높이고 있습니다.
자유 탐험 아레나는 2031년까지 연평균 복합 성장률(CAGR) 33.40%를 나타낼 전망이며 현재 용도 분야의 선두를 달리고 있습니다. 무선 추적 및 씬 클라이언트 헤드셋을 통해 8-12명의 그룹이 배낭 없이 창고 규모의 공간을 이동할 수 있습니다. 팀 단위로 퍼즐을 풀고 가상의 적을 피해 현실 세계에서 교감을 나누는 경험이 입소문 마케팅을 촉진합니다. 기업의 팀워크 강화 이벤트와 생일 파티 등을 아레나에서 개최하여 평일 수익을 창출하고 수요 피크와 계곡을 평준화하고 있습니다.
지역별 분석
북미는 부유층 소비자, 유리한 프랜차이즈법, 도시 재생 인센티브를 통해 2025년 시점에서 위치 기반 VR 시장의 39.60%를 차지하면서 주도권을 유지했습니다. 샌프란시스코 시내 ENRG 프로그램은 소매 회랑의 활성화에 기여하는 체험형 시설에 대해 5만 달러의 보조금을 제공합니다. 운영자는 VR과 식음료 컨셉을 결합하여 복합 용도 지구에 적합한 하이브리드 공간을 창출하는 경우가 많습니다. 캐나다에서는 쇼핑몰 소유자가 기존의 주력 매장을 엔터테인먼트 거점으로 재배치하고, VR 아레나, 피클볼 경기장, e스포츠 라운지를 같은 시설 내에 배치하고 있습니다. 멕시코 건설업자들은 초기 임대료를 낮춰 외국 프랜차이즈를 유치하는 수익 분배형 리스 모델을 도입하고 있습니다.
아시아태평양은 규모가 작지만 33.20%라는 가장 높은 CAGR을 달성할 전망입니다. 중국의 국가 로드맵에서는 2026년까지 VR 관련 산업 전체의 규모를 3,500억 인민폐까지 달성하는 목표를 설정하고 하드웨어 제조업체나 시설 체인에 대한 보조금 투입을 진행하고 있습니다. 지방자치단체의 조성금은 유흥지구의 토지비용을 보조하여 운영자의 리스크 경감에 기여하고 있습니다. 일본의 성숙한 콘솔 게임 문화는 컨텐츠에 대한 높은 기대를 창출하고 시설측은 지역 한정 타이틀이나 애니메이션과의 콜라보레이션으로 차별화를 도모하고 있습니다. 한국의 롯데월드는 700평방미터의 프리로밍 아레나를 건설해 K-POP IP 및 SNS용 포토스팟과 연계하고 있습니다. 인도의 일선도시에서는 쇼핑몰의 공실률 상승으로 인해 건물주가 보조 임대료를 제공하여 VR엔터테인먼트 클러스터로 전환하고 있습니다. 각 시장은 아케이드, 경기장, 교육 센터의 조합을 지역의 레저 패턴에 맞게 조정합니다.
유럽은 독일, 영국, 프랑스를 중심으로 꾸준한 성장을 이루고 있습니다. 독일의 프랜차이즈 파트너 각사는 1인당 레저 지출의 증가를 인식하고 2026년까지 최대 12개소의 샌드박스 VR 시설 전개를 목표로 하고 있습니다. 영국에서는 프리미엄 전략을 중시하고, 런던과 맨체스터의 플래그십 시설에서는 수제 칵테일과 VIP 라운지를 함께 배치하고 있습니다. 프랑스에서는 문화 자금을 활용하여 국립 박물관 내에 VR 전시를 도입하고 있습니다. 동유럽의 사업자는 건설비용의 하락세를 활용하는 한편, 소비자의 보급속도가 느리기 때문에 서유럽 브랜드와의 합작사업에 의해 마케팅 노하우를 공유하고 있습니다. 중동 및 아프리카는 신흥 시장이면서 관광객 주도의 소비가 뒷받침하고 있습니다. 사우디아라비아의 '비전 2030'계획은 리야드의 신도심에 복합 현실 파크의 건설에 자금을 제공하고, 아랍에미리트(UAE)의 쇼핑몰에서는 VR을 실내 스카이 다이빙이나 스노우 파크와 통합하여 연중 고객을 유지하고 있습니다.
기타 혜택
- 시장 예측(ME) 엑셀 시트
- 3개월 애널리스트 서포트
자주 묻는 질문
목차
제1장 서론
- 조사 전제조건 및 시장 정의
- 조사 범위
제2장 조사 방법
제3장 주요 요약
제4장 시장 상황
- 시장 개요
- 촉진요인
- 하드웨어 비용의 급속한 하락으로 사업자의 투자 이익률(ROI) 개선
- 몰입형 외부활동 체험에 대한 소비자 수요 증가
- 인기 IP와의 컨텐츠 제휴
- 무선 및 프리로밍 추적 기술의 진전
- 5G 엣지 스트리밍으로 시설 내 컴퓨팅 비용 절감
- 체험 시설용 도시 활성화 조성금
- 억제요인
- 높은 초기 설비투자 및 유지관리비
- 프리미엄 멀티기업 컨텐츠의 한정
- 보험 및 배상 책임 보험료 상승
- 광학 부품에 대한 반도체 관세
- 업계 밸류체인 분석
- 거시경제 요인의 영향
- 기술 전망
- 규제 상황
- Porter's Five Forces 분석
- 공급자의 협상력
- 구매자의 협상력
- 신규 참가업체의 위협
- 대체품의 위협
- 경쟁 기업 간 경쟁 관계
제5장 시장 규모 및 성장 예측
- 솔루션 유형별
- 하드웨어
- 헤드마운트 디스플레이
- 헤드업 디스플레이
- 안경
- 센서
- 카메라
- 소프트웨어
- 하드웨어
- 용도별
- VR 놀이시설
- VR 테마파크
- VR 시네마
- 프리로밍 아레나
- VR e스포츠 라운지
- 교육 및 연수센터
- 최종 용도별
- 놀이공원
- 아케이드 스튜디오
- 영화관
- 박물관 및 문화센터
- 상업 및 소매점포
- 군사 및 훈련 시설
- 기술별
- 2D
- 3D
- 클라우드 혼합현실
- 지역별
- 북미
- 미국
- 캐나다
- 멕시코
- 남미
- 브라질
- 아르헨티나
- 기타 남미
- 유럽
- 독일
- 프랑스
- 영국
- 이탈리아
- 스페인
- 러시아
- 기타 유럽
- 아시아태평양
- 중국
- 일본
- 한국
- 인도
- 호주
- 기타 아시아태평양
- 중동
- 아랍에미리트(UAE)
- 사우디아라비아
- 튀르키예
- 기타 중동
- 아프리카
- 남아프리카
- 나이지리아
- 이집트
- 기타 아프리카
- 북미
제6장 경쟁 구도
- 시장 집중도
- 전략적 동향
- 시장 점유율 분석
- 기업 프로파일
- Sandbox VR Inc.
- Zero Latency Pty Ltd
- Hologate GmbH
- Dreamscape Immersive Inc.
- VRstudios Inc.
- Vertigo Games Holding BV(Springboard VR)
- EXIT VR GmbH
- Survios Inc.
- Tyffon Inc.
- Neurogaming Limited
- Ctrl V Inc.
- IMAX Corporation
- Spaces LLC
- Nomadic Inc.
- The VOID LLC
- HTC Corporation(Viveport Arcade)
- Facebook Technologies LLC(Oculus VR)
- Disney Parks, Experiences and Products Inc.
- Pico Interactive Inc.
- DPVR Co. Ltd.
제7장 시장 기회 및 미래 전망
CSM 26.01.21The location-based virtual reality market was valued at USD 2.1 billion in 2025 and estimated to grow from USD 2.76 billion in 2026 to reach USD 10.69 billion by 2031, at a CAGR of 31.2% during the forecast period (2026-2031).
The acceleration comes from falling hardware prices, rising blockbuster intellectual-property partnerships, and infrastructure advances that improve venue economics. Operators now treat venues as dependable profit centers that compete with bowling, cinemas, and escape rooms. Consumer demand for social experiences, strong franchise roll-outs, and supportive urban revitalization grants keep expansion on track. Equipment makers align with venue needs by adding predictive diagnostics and wireless capability that streamline maintenance. At the same time, software platforms shift rendering to the cloud and shorten content-refresh cycles, which raises repeat-visit revenue potential. These forces collectively anchor the location-based virtual reality market on a solid growth trajectory.
Global Location-Based VR Market Trends and Insights
Rapid Hardware Cost Decline Improving ROI for Operators
Venue economics improve as equipment prices drop and wireless systems remove cabling costs. A Zero Latency eight-player rig now lists at USD 245,000, down 30% from the prior generation while adding 5K resolution and wireless streaming. Wireless packs eliminate time-consuming setup tasks so staff can turn around play sessions faster. Predictive diagnostics inside headsets cut unplanned downtime and shrink maintenance budgets. Lower capital outlays and lighter staffing shorten payback periods from three years to as little as 18 months for well located sites. The downward price curve motivates smaller entrepreneurs to enter the location-based virtual reality market, broadening the venue footprint.
Growing Consumer Appetite for Immersive Out-of-Home Experiences
Consumers channel more discretionary spending toward shared experiences that cannot be reproduced at home. Sandbox VR sold 1.4 million tickets in 2024, up 33% year over year, at an average U.S. price of USD 53 per guest. Group bookings dominate, with 85% of visits involving three to six participants, showing the draw of social play. Surveys indicate younger adults now rank memory-making activities above material goods, a preference that underpins healthy attendance even when macroeconomic conditions wobble. Operators leverage this trend by layering food, beverage, and merchandise into the outing, which lifts per-capita spend and margins.
High Upfront Capex and Maintenance
A full venue still demands sizeable capital even after recent cost declines. The Park Playground's franchise kit requires GBP 350,000 (USD 448,000) in startup funds, and investors aim for GBP 600,000 (USD 768,000) in first-year revenue to break even in about 20 months. Annual upkeep can run 10-15% of hardware value, and content licenses add several thousand dollars per title. Real-estate, insurance, and skilled technician wages push breakeven higher in secondary cities. This cost barrier slows penetration in emerging economies where financing options remain limited.
Other drivers and restraints analyzed in the detailed report include:
- Content Partnerships with Blockbuster IP
- Advances in Wireless Free-Roam Tracking
- Rising Insurance and Liability Premiums
For complete list of drivers and restraints, kindly check the Table Of Contents.
Segment Analysis
Hardware accounts for the bulk of 2024 venue spending because head-mounted displays, tracking cameras, and networking gear command premium prices. Commercial-grade headsets sell for USD 800 to USD 3,000 apiece, far above consumer models, and operators must own spares to minimize downtime. Network-attached storage devices, GPU servers, and safety gear push the bill higher.
Although hardware dominance reflects today's spending mix, software now posts the fastest rise at 33.15% CAGR. Edge-cloud pipelines like NVIDIA CloudXR let venues stream photorealistic environments from off-site servers. Subscription models convert lumpy investments into manageable monthly fees, and cloud-hosted analytics guide operators on dwell times and conversion funnels. The pivot toward software lifts margins and smooths cash flow, offering resiliency in downturns
VR Arcades occupy modest footprints, deliver quick session turnover, and suit mall or high-street settings. They held 45.60% share in 2025 because landlords favor such tenants for foot-traffic generation. Operators refine layouts with self-serve kiosks that shorten wait lines and grow ancillary spend on snacks and merchandise.
Free-Roam Arenas now pace the application leaderboard with 33.40% CAGR through 2031. Wireless tracking and thin-client headsets allow 8-12 players to navigate warehouse-scale spaces without backpacks. Teams solve puzzles, dodge digital foes, and share real-world high-fives, which elevates word-of-mouth marketing. Corporate team-building events and birthday parties gravitate to arenas, producing weekday revenue that smooths peaks and troughs.
The Location-Based Virtual Reality Market Report is Segmented by Solution Type (Hardware, and Software), Application (VR Arcades, VR Theme Parks, VR Cinemas, Free-Roam Arenas, and More), End-Use (Amusement Parks, Arcade Studios, Cinemas, Museums and Cultural Centres, Commercial and Retail Venues, and More), Technology (2D, 3D, and Cloud Merged Reality), and Geography. The Market Forecasts are Provided in Terms of Value (USD).
Geography Analysis
North America retains leadership with 39.60% of location-based virtual reality market share in 2025 thanks to affluent consumers, favorable franchising laws, and urban revitalization incentives. San Francisco's Downtown ENRG program earmarks USD 50,000 grants for experiential venues that help reactivate retail corridors. Operators often pair VR with food and beverage concepts, creating hybrid spaces that fit mixed-use districts. In Canada, mall owners reposition legacy anchor stores as entertainment hubs that host VR arenas, pickleball courts, and e-sports lounges under one roof. Mexican developers adopt revenue-sharing lease models that lower upfront rent and invite foreign franchisees.
Asia Pacific, while smaller today, delivers the fastest 33.20% CAGR. China's national roadmap targets RMB 350 billion in overall VR activity by 2026, funneling subsidies toward hardware makers and venue chains. Provincial grants cover land costs for entertainment districts, reducing operator risk. Japan's mature console culture fuels high content expectations, so venues attain differentiation with location-exclusive titles and anime collaborations. South Korea's Lotte World built a 700-square-meter free-roam arena that ties into K-pop intellectual property and social-media-friendly photo zones. India's first-tier cities witness rising mall vacancy rates, which landlords convert into VR entertainment clusters at subsidized rents. Each market tailors its mix of arcades, arenas, and educational centres to local leisure patterns.
Europe posts steady growth anchored by Germany, the United Kingdom, and France. German franchise partners committed to rolling out up to 12 Sandbox VR locations each by 2026, attracted by strong per-capita spending on leisure. The United Kingdom favors premium positioning, with flagship London and Manchester venues bundling craft cocktails and VIP lounges. France capitalizes on cultural funding to install VR exhibits in national museums. Eastern European operators leverage lower construction costs yet face slower consumer adoption, prompting joint ventures with Western brands to share marketing know-how. The Middle East and Africa region, though still emerging, enjoys tourist-led spending. Saudi Arabia's Vision 2030 plan finances mixed-reality parks in Riyadh's new downtown, and United Arab Emirates malls integrate VR with indoor skydiving and snow parks to maintain year-round traffic.
- Sandbox VR Inc.
- Zero Latency Pty Ltd
- Hologate GmbH
- Dreamscape Immersive Inc.
- VRstudios Inc.
- Vertigo Games Holding B.V. (Springboard VR)
- EXIT VR GmbH
- Survios Inc.
- Tyffon Inc.
- Neurogaming Limited
- Ctrl V Inc.
- IMAX Corporation
- Spaces LLC
- Nomadic Inc.
- The VOID LLC
- HTC Corporation (Viveport Arcade)
- Facebook Technologies LLC (Oculus VR)
- Disney Parks, Experiences and Products Inc.
- Pico Interactive Inc.
- DPVR Co. Ltd.
Additional Benefits:
- The market estimate (ME) sheet in Excel format
- 3 months of analyst support
TABLE OF CONTENTS
1 INTRODUCTION
- 1.1 Study Assumptions and Market Definition
- 1.2 Scope of the Study
2 RESEARCH METHODOLOGY
3 EXECUTIVE SUMMARY
4 MARKET LANDSCAPE
- 4.1 Market Overview
- 4.2 Market Drivers
- 4.2.1 Rapid hardware cost decline improving ROI for operators
- 4.2.2 Growing consumer appetite for immersive out-of-home experiences
- 4.2.3 Content partnerships with blockbuster IP
- 4.2.4 Advances in wireless free-roam tracking
- 4.2.5 5G edge streaming reduces in-venue compute costs
- 4.2.6 Urban revitalisation grants for experiential venues
- 4.3 Market Restraints
- 4.3.1 High upfront capex and maintenance
- 4.3.2 Limited premium multiplayer content
- 4.3.3 Rising insurance and liability premiums
- 4.3.4 Semiconductor tariffs on optical components
- 4.4 Industry Value Chain Analysis
- 4.5 Impact of Macroeconomic Factors
- 4.6 Technological Outlook
- 4.7 Regulatory Landscape
- 4.8 Porter's Five Forces Analysis
- 4.8.1 Bargaining Power of Suppliers
- 4.8.2 Bargaining Power of Buyers
- 4.8.3 Threat of New Entrants
- 4.8.4 Threat of Substitute Products
- 4.8.5 Intensity of Competitive Rivalry
5 MARKET SIZE AND GROWTH FORECASTS (VALUE)
- 5.1 By Solution Type
- 5.1.1 Hardware
- 5.1.1.1 Head-Mounted Displays
- 5.1.1.2 Head-Up Displays
- 5.1.1.3 Glasses
- 5.1.1.4 Sensors
- 5.1.1.5 Cameras
- 5.1.2 Software
- 5.1.1 Hardware
- 5.2 By Application
- 5.2.1 VR Arcades
- 5.2.2 VR Theme Parks
- 5.2.3 VR Cinemas
- 5.2.4 Free-Roam Arenas
- 5.2.5 VR Esports Lounges
- 5.2.6 Educational and Training Centres
- 5.3 By End-Use
- 5.3.1 Amusement Parks
- 5.3.2 Arcade Studios
- 5.3.3 Cinemas
- 5.3.4 Museums and Cultural Centres
- 5.3.5 Commercial and Retail Venues
- 5.3.6 Military and Training Facilities
- 5.4 By Technology
- 5.4.1 2D
- 5.4.2 3D
- 5.4.3 Cloud Merged Reality
- 5.5 By Geography
- 5.5.1 North America
- 5.5.1.1 United States
- 5.5.1.2 Canada
- 5.5.1.3 Mexico
- 5.5.2 South America
- 5.5.2.1 Brazil
- 5.5.2.2 Argentina
- 5.5.2.3 Rest of South America
- 5.5.3 Europe
- 5.5.3.1 Germany
- 5.5.3.2 France
- 5.5.3.3 United Kingdom
- 5.5.3.4 Italy
- 5.5.3.5 Spain
- 5.5.3.6 Russia
- 5.5.3.7 Rest of Europe
- 5.5.4 Asia Pacific
- 5.5.4.1 China
- 5.5.4.2 Japan
- 5.5.4.3 South Korea
- 5.5.4.4 India
- 5.5.4.5 Australia
- 5.5.4.6 Rest of Asia Pacific
- 5.5.5 Middle East
- 5.5.5.1 United Arab Emirates
- 5.5.5.2 Saudi Arabia
- 5.5.5.3 Turkey
- 5.5.5.4 Rest of Middle East
- 5.5.6 Africa
- 5.5.6.1 South Africa
- 5.5.6.2 Nigeria
- 5.5.6.3 Egypt
- 5.5.6.4 Rest of Africa
- 5.5.1 North America
6 COMPETITIVE LANDSCAPE
- 6.1 Market Concentration
- 6.2 Strategic Moves
- 6.3 Market Share Analysis
- 6.4 Company Profiles {(includes Global level Overview, Market level overview, Core Segments, Financials as available, Strategic Information, Market Rank/Share for key companies, Products and Services, and Recent Developments)}
- 6.4.1 Sandbox VR Inc.
- 6.4.2 Zero Latency Pty Ltd
- 6.4.3 Hologate GmbH
- 6.4.4 Dreamscape Immersive Inc.
- 6.4.5 VRstudios Inc.
- 6.4.6 Vertigo Games Holding B.V. (Springboard VR)
- 6.4.7 EXIT VR GmbH
- 6.4.8 Survios Inc.
- 6.4.9 Tyffon Inc.
- 6.4.10 Neurogaming Limited
- 6.4.11 Ctrl V Inc.
- 6.4.12 IMAX Corporation
- 6.4.13 Spaces LLC
- 6.4.14 Nomadic Inc.
- 6.4.15 The VOID LLC
- 6.4.16 HTC Corporation (Viveport Arcade)
- 6.4.17 Facebook Technologies LLC (Oculus VR)
- 6.4.18 Disney Parks, Experiences and Products Inc.
- 6.4.19 Pico Interactive Inc.
- 6.4.20 DPVR Co. Ltd.
7 MARKET OPPORTUNITIES AND FUTURE OUTLOOK
- 7.1 White-Space and Unmet-Need Assessment
