


|
시장보고서
상품코드
1906858
석영 시장 : 점유율 분석, 업계 동향, 통계, 성장 예측(2026-2031년)Quartz - Market Share Analysis, Industry Trends & Statistics, Growth Forecasts (2026 - 2031) |
||||||
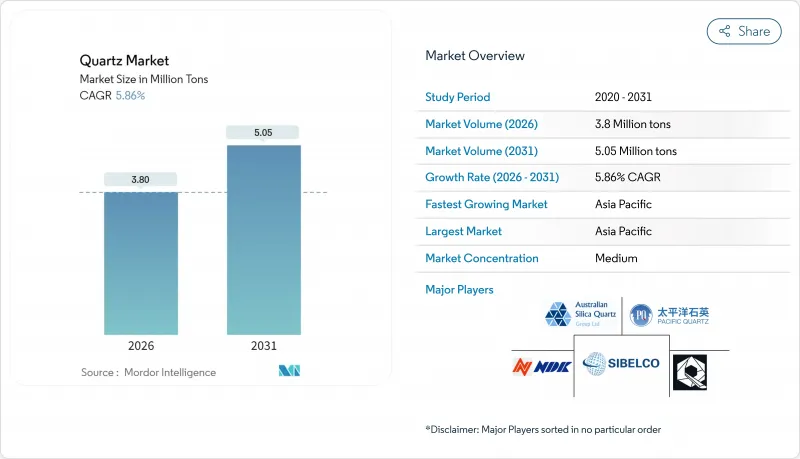
2026년 석영 시장 규모는 380만 톤으로 추정되며, 2025년 359만 톤에서 성장한 수치입니다.
2031년까지 505만 톤에 이르고 2026년부터 2031년까지 연평균 복합 성장률(CAGR) 5.86%로 성장할 전망입니다.

이 꾸준한 확장은 반도체 리소그래피, 태양광 발전 잉곳 성장, 광섬유 및 엔지니어링 표면 처리에서 이 광물이 수행하는 대체 불가능한 역할을 반영합니다. 노드 미세화가 7nm 미만으로 떨어지면서 칩 제조 공장에서는 불순물 허용치가 10억분의 1 수준까지 늘어나고 공급업체는 정교한 정제 설비에 대한 투자를 받고 있습니다. 동시에 태양전지용 잉곳 제조장치에서는 대형 웨이퍼 대응을 위한 도가니 지름의 확대가 진행되고, 기준이 되는 석영 사용량이 배증하고 있습니다. 기후 관련 공급 충격(최근에는 허리케인 헬렌에 의한 스프루스파인 공장의 운영 정지)은 노르웨이, 브라질, 아프리카에 공급원 다양화를 촉진하는 동시에 초고순도 등급의 프리미엄 가격을 유지하고 있습니다. 마지막으로, 일련의 산업 재구성과 생산 능력 증진의 움직임은 석영 시장이 금세기 말까지 하이테크 제조 생태계의 기반이 되고 있다는 확신을 보여줍니다.
세계 석영 시장 동향과 전망
태양광 발전 용량의 급증
세계의 태양광 발전 설비 증강에는 초크랄 스키법에 의한 실리콘 잉곳 성장시에 1,723℃에 견딜 수 있는 초고순도 석영 도가니가 불가결합니다. M12 등의 대형 웨이퍼 포맷은 라인당 생산량을 증가시켜 도가니 제조업체에 직경과 두께 균일성의 양면에서의 스케일 업을 강요하고 있습니다. 99.999% 이상의 SiO2 등급을 보유한 공급업체는 재료 공급 위험을 줄이려는 주요 웨이퍼 제조업체로부터 장기 인수 계약을 받았습니다. 수요는 아시아태평양이 주도하고 있지만, 구미의 에너지 전환 인센티브가 추가적인 수요를 창출해 가공 거점의 지역 분산화를 촉진하고 있습니다. 그 결과, 전자기기 시장의 순환적인 변동 속에서도, 태양광 용도는 석영 시장의 안정적인 기둥이 될 전망입니다.
반도체 미세화가 초고순도 수요를 견인
7nm 이하의 최첨단 로직 메모리 제조 공장에서는 불순물 상한이 10억 분의 수 수준에서 요구되기 때문에 용융 석영 및 석영 제품 공급업체의 기술적 장애물이 높아지고 있습니다. 합성법, 용융 석영, 다단계 산 침출을 포함한 독자적인 공정에 의해 알루미늄 함유량 9ppm 이하, 철 함유량 0.2ppm 이하를 실현하고 있습니다. 이에 따른 자본 집약성과 인증 사이클은 신규 진입을 사실상 막아 기존 기업이 톤수가 아닌 순도를 추적하는 다년간 가격 설정 방식을 협상할 수 있게 하고 있습니다. 칩 제조업체가 3nm 생산으로 이행해 2nm의 시험 생산을 진행하는 가운데, 초고순도 석영 수요는 2030년까지 석영 시장 전체의 성장을 웃도는 페이스로 확대될 전망입니다.
석영 채굴이 생태계에 미치는 영향
서식지의 파괴, 지하수위의 변화, 미립자 물질의 배출에 의해 노스캐롤라이나주, 퀘벡주, 스칸디나비아의 일부 지역에서는 허가 제도의 엄격화가 진행되고 있습니다. 복원보증금, 생물다양성의 기준선 평가, 지역사회와의 협의에 의해 현재는 리드타임이 최대 24개월 연장되고 있습니다. 신뢰할 수 있는 ESG 로드맵이 부족한 생산자는 설비 투자 증가에 직면하지만, 재활용업체와 미광을 활용한 노력은 규제 당국의 평가를 받고 있습니다. 이러한 환경 감시는 석영 시장에 측정 가능한 억제요인이 되는 것, 동시에 환경 부하가 낮은 조달 모델의 혁신을 가속시키고 있습니다.
부문 분석
2025년 석영 시장의 96.55%를 차지하는 톤수로 실리콘 금속이 주도적 지위에 있으며, 알루미늄 합금, 실리콘, 폴리실리콘에 있어서 필수적인 역할을 뒷받침하고 있습니다. 수송기기의 경량화와 중국 및 미국에서의 태양전지용 폴리실리콘 생산능력의 증강에 따라 금속실리콘 가공에 기인하는 석영 시장 규모는 꾸준한 확대가 전망됩니다. 페로그로브사, 엘켐사, 호신사는 대형 수중 아크로와 자사 소유의 규암광산을 활용하여 비용 우위성을 유지하고 있습니다만, 신규 참가 기업에 있어서는 전력 공급의 안정성이 여전히 중요한 변동 요인이 되고 있습니다.
고순도 석영은 생산량이 극히 적으며, 톤당 평균 판매 가격이 7,000달러를 넘어 불균형한 가치를 창출하고 있습니다. 2031년까지의 예측 연평균 복합 성장률(CAGR) 7.18%로 성장할 것으로 예상되고 미세화 기술의 진전과 대형 태양전지 웨이퍼 포맷으로의 전환이라는 장기적인 추풍을 반영하고 있습니다. ISO 9001:2000 인증과 12-18개월이 소요되는 고객 감사와 같은 진입 장벽으로 인해 한 번 체결된 장기 계약은 견고합니다. 허리케인 헬렌에 의한 스프루스파인 출하에 영향을 받고, 반도체 제조업체는 노르웨이와 아시아로 공급처를 다변화(Dual-source)하는 계기가 되었습니다. 이로 인해 인증된 고순도 석영(HPQ) 공급업체의 전략적 이점이 부각되었습니다. 이러한 추세로 인해 금속 실리콘이 수량면에서 주도권을 유지하면서 HPQ는 석영 시장에서 가장 빠르게 성장하는 분야로 자리매김하고 있습니다.
당 석영 보고서는 제품 유형별(고순도 석영, 수정, 금속 실리콘), 최종 사용자 산업별(일렉트로믹스 및 반도체, 태양광, 건축 및 건설, 광섬유 및 통신, 자동차, 기타 최종 사용자 산업), 지역별(아시아태평양, 북미, 유럽, 남미, 중동 및 아프리카)으로 세분화되어 있습니다. 시장 예측은 수량(톤) 단위로 제공됩니다.
지역별 분석
2025년 아시아태평양은 석영 시장의 55.01%를 차지했습니다. 이것은 중국의 수직 통합 클러스터가 견인하고 있으며 석영 광석을 수백 킬로미터 이내에 전자 부품, 태양전지판 및 가공 표면재로 전환하고 있습니다. 지역규제당국은 광산에서 제조공장까지의 물류 효율화를 계속하여 운전자금 사이클을 더욱 단축하고 있습니다. 인도와 베트남은 유리한 전력요금과 반도체 후공정의 현지화 촉진책에 지지되어 보조적인 가공거점으로서 대두중입니다. 2031년까지의 지역 CAGR 6.27%는 스마트폰 보급의 계속, 지붕 설치형 태양광 정책, ASEAN 국가에서의 중산계급의 주택 보수 수요에 지지되고 있습니다.
북미는 전략적으로 매우 중요하며 스프루스파인의 초고순도 광맥이 기반을 두고 있습니다. 2024년 허리케인 재해 이전에는 세계의 고 실리콘 원료의 80-90%를 공급하고 있었습니다. 시베르코의 7억 달러 규모의 확장 계획과 석영의 노르웨이 공장 가동은 지질학적 이점과 지리적 중복성을 결합한 이중 축의 위험 완화 전략을 반영합니다. 미국의 애리조나주, 텍사스주, 뉴욕주 팹 건설은 하류 수요를 견인하지만, 에너지 비용의 상승과 엄격한 환경 허가는 범용품 등급의 생산 확대를 억제하고 있습니다. 캐나다와 멕시코는 지리적 우위를 활용하여 지역 건설 시장에 공급하는 동시에 재생에너지 회랑을 통한 틈새 HPQ 투자 유치를 목표로 하고 있습니다.
유럽은 엄격한 ESG 기준을 활용하여 부가가치형 석영 가공에서 프리미엄 틈새를 개척하고 있습니다. 이메리스는 스웨덴과 프랑스의 광상을 운영하고 저탄소 수력 발전에 인접한 용융 석영 공장과 통합되어 있습니다. 독일은 슬러리리스 절단 및 핫존 조립용 정밀 기계를 공급하여 광석 매장량이 적게 유지하면서도 기술적 리더십을 확보하고 있습니다. 남미, 중동, 아프리카는 특히 브라질의 미나스제라이스 광대에서 공급 증가로 생산량에 공헌하고 있지만, 인프라 부족과 물 부족이 단기적인 성장을 억제하고 있습니다. 이 지역은 수입에 크게 의존하고 있으며 아시아태평양과 북미 공급업체가 세계 석영 시장에 미치는 영향력을 강화하고 있습니다.
기타 혜택 :
- 엑셀 형식 시장 예측(ME) 시트
- 애널리스트에 의한 3개월간의 지원
자주 묻는 질문
목차
제1장 서론
- 조사의 전제조건과 시장의 정의
- 조사 범위
제2장 조사 방법
제3장 주요 요약
제4장 시장 상황
- 시장 개요
- 시장 성장 촉진요인
- 태양광 발전 용량의 급증
- 반도체 공정 미세화(Node-shrink)에 따른 초고순도 수요 증가
- 인공 석영 인테리어 표면재 수요 급증
- 5G/FTTx에서의 광섬유 전개
- 미광 유래의 고순도 석영(HPQ)비용 곡선 하락
- 시장 성장 억제요인
- 석영 채굴이 생태계에 미치는 영향
- 에너지 집약적인 정제 공정
- 기후 변화에 의한 광산조업의 혼란
- 밸류체인 분석
- Porter's Five Forces
- 공급기업의 협상력
- 구매자의 협상력
- 신규 참가업체의 위협
- 대체품의 위협
- 경쟁 기업간 경쟁 관계
제5장 시장 규모와 성장 예측
- 제품 유형별
- 고순도 석영
- 석영 표면재 및 타일
- 용융 석영 도가니
- 석영 유리
- 수정
- 금속 실리콘
- 고순도 석영
- 최종 사용자 업계별
- 전자기기 및 반도체
- 태양광 발전
- 건축 및 건설
- 광섬유 및 통신
- 자동차
- 기타 최종 사용자 산업
- 지역별
- 아시아태평양
- 중국
- 인도
- 일본
- 한국
- 말레이시아
- 태국
- 인도네시아
- 베트남
- 기타 아시아태평양
- 북미
- 미국
- 캐나다
- 멕시코
- 유럽
- 독일
- 영국
- 프랑스
- 이탈리아
- 스페인
- 북유럽 국가
- 튀르키예
- 러시아
- 기타 유럽
- 남미
- 브라질
- 아르헨티나
- 콜롬비아
- 기타 남미
- 중동 및 아프리카
- 사우디아라비아
- 카타르
- 아랍에미리트(UAE)
- 나이지리아
- 이집트
- 남아프리카
- 기타 중동 및 아프리카
- 아시아태평양
제6장 경쟁 구도
- 시장 집중도
- 전략적 동향
- 시장 점유율(%)/순위 분석
- 기업 프로파일
- AGC Inc.
- Australian Silica Quartz Group Ltd
- Dow
- East Hope Group
- Elkem ASA
- Ferroglobe
- Hoshine Silicon Industry Co., Ltd.
- Imerys
- India Quartz
- Jiangsu Pacific Quartz Co., Ltd
- MACTUS
- NIHON DEMPA KOGYO CO., LTD.
- Nordic Mining ASA
- Saint-Gobain
- Sibelco
- SIMCOA
- The Quartz Corp
- WACKER CHEMIE AG
제7장 시장 기회와 장래의 전망
SHW 26.01.22Quartz Market size in 2026 is estimated at 3.8 million tons, growing from 2025 value of 3.59 million tons with 2031 projections showing 5.05 million tons, growing at 5.86% CAGR over 2026-2031.
This steady expansion reflects the mineral's irreplaceable role in semiconductor lithography, photovoltaic ingot growth, optical fibers, and engineered surfaces. As node geometries shrink below 7 nm, chip fabs elevate impurity thresholds to parts-per-billion, forcing suppliers to invest in advanced purification assets. Solar ingot pullers are simultaneously scaling crucible diameters for larger wafers, multiplying baseline quartz volumes. Climate-related supply shocks-most recently Hurricane Helene's disruption of Spruce Pine-have propelled diversification efforts into Norway, Brazil, and Africa while sustaining premium pricing for ultra-high-purity grades. Finally, a wave of consolidation and capacity additions signals confidence that the quartz market will remain a cornerstone of high-tech manufacturing ecosystems through the end of the decade.
Global Quartz Market Trends and Insights
Growing Solar-PV Capacity Surge
Global photovoltaic build-outs require ultra-pure quartz crucibles capable of withstanding 1,723 °C during Czochralski silicon ingot growth. Larger wafer formats, such as M12, amplify volume per line, forcing crucible producers to scale both diameter and wall uniformity. Suppliers with track records in more than 99.999% SiO2 grades secure long-term offtake agreements from wafer majors eager to derisk material availability. Asia-Pacific dominates demand, yet European and U.S. energy-transition incentives are creating incremental pull that helps regionalize processing footprints. As a result, solar applications are forecast to be a stabilizing pillar for the quartz market amid cyclical swings in electronics.
Semiconductor Node-Shrink Drives Ultra-High-Purity Demand
Leading-edge logic and memory fabs operating below 7 nm mandate impurity ceilings in the parts-per-billion range, raising the technical bar for fused silica and quartz ware suppliers. Proprietary processes. including synthetic route, fused silica, and multi-stage acid leaching, enable aluminum contents below 9 ppm and iron below 0.2 ppm. The capital intensity and qualification cycles involved effectively deter new entrants, allowing incumbents to negotiate multi-year pricing formulas tracking purity rather than tonnage. As chipmakers move toward 3 nm production and pilot 2 nm, demand for ultra-high-purity quartz is set to outpace broader quartz market growth through 2030.
Ecological Impact of Quartz Mining
Habitat disruption, water-table alteration, and particulate emissions are prompting stricter permitting regimes across North Carolina, Quebec, and parts of Scandinavia. Restoration bonding, baseline biodiversity assessments, and community consultations now extend lead times by up to 24 months. Producers lacking credible ESG roadmaps face escalating capex, while recyclers and tailings-based initiatives gain regulatory goodwill. This environmental scrutiny places a measurable drag on the quartz market, although it simultaneously accelerates innovation in lower-impact sourcing models.
Other drivers and restraints analyzed in the detailed report include:
- Boom in Engineered-Quartz Interior Surfaces
- Tailings-Derived HPQ Lowers Cost Curve
- Energy-Intensive Purification Process
For complete list of drivers and restraints, kindly check the Table Of Contents.
Segment Analysis
Silicon metal dominated tonnage with a 96.55% quartz market share in 2025, underscoring its indispensable role in aluminum alloys, silicones, and polysilicon. The quartz market size attributed to silicon metal processing is projected to expand steadily in line with light-weighting in transportation, and solar-grade polysilicon capacity adds in China and the U.S. Ferroglobe, Elkem, and Hoshine capitalize on large submerged-arc furnaces and captive quartzite mines to defend cost positions, while electricity availability remains a swing factor for new entrants.
High-purity quartz, though tiny in volume, captures a disproportionate value pool thanks to average selling prices exceeding USD 7,000 per ton. Its forecast 7.18% CAGR through 2031 reflects secular tailwinds from node migration and larger solar wafer formats. Qualification barriers such as ISO 9001:2000 and customer audits spanning 12-18 months cement long-term contracts once secured. Hurricane Helene's interference with Spruce Pine shipments prompted chipmakers to dual-source from Norway and Asia, spotlighting the strategic leverage of certified HPQ suppliers. This dynamic positions HPQ as the fastest-rising slice of the quartz market, even as silicon metal maintains volume leadership.
The Quartz Report is Segmented by Product Type (High-Purity Quartz, Quartz Crystal, and Silicon Metal), End-User Industry (Electronics and Semiconductor, Solar, Building and Construction, Optical Fiber and Telecommunication, Automotive, and Other End-User Industries), and Geography (Asia-Pacific, North America, Europe, South America, and Middle-East and Africa). The Market Forecasts are Provided in Terms of Volume (Tons).
Geography Analysis
Asia-Pacific accounted for 55.01% of the quartz market share in 2025, driven by China's vertically integrated clusters that convert quartz ore into electronics, solar panels, and engineered surfaces within a few hundred kilometers. Regional regulators continue to streamline mine-to-fab logistics, further compressing working capital cycles. India and Vietnam are emerging as supplementary processing hubs, buoyed by favorable power tariffs and incentives to localize semiconductor back-end. The 6.27% regional CAGR through 2031 is underpinned by relentless smartphone adoption, rooftop solar policies, and middle-class home upgrades across ASEAN economies.
North America remains strategically vital owing to Spruce Pine's ultra-pure vein-the bedrock for 80-90% of global HPQ feedstock before the 2024 hurricane event. Sibelco's USD 700 million expansion and The Quartz Corp's Norway commissioning reflect a dual-axis mitigation strategy that pairs geological excellence with geographic redundancy. U.S. fab build-outs in Arizona, Texas, and New York offer a downstream pull, yet higher energy costs and stringent environmental permitting temper capacity growth in commodity grades. Canada and Mexico serve regional construction markets with proximity advantages, while aiming to attract niche HPQ investments through renewable power corridors.
Europe leverages stringent ESG standards to carve out a premium niche in value-added quartz processing. Imerys operates deposits in Sweden and France, integrating them with fused silica plants adjacent to low-carbon hydro power. Germany supplies precision machinery for slurry-less sawing and hot-zone assembly, ensuring technological leadership despite modest ore endowment. South America, the Middle East, and Africa contribute incremental tonnage, particularly from Brazil's Minas Gerais belt, yet infrastructure deficits and water scarcity cap near-term growth. These regions rely heavily on imports, reinforcing Asia-Pacific and North American suppliers' influence over the global quartz market.
- AGC Inc.
- Australian Silica Quartz Group Ltd
- Dow
- East Hope Group
- Elkem ASA
- Ferroglobe
- Hoshine Silicon Industry Co., Ltd.
- Imerys
- India Quartz
- Jiangsu Pacific Quartz Co., Ltd
- MACTUS
- NIHON DEMPA KOGYO CO., LTD.
- Nordic Mining ASA
- Saint-Gobain
- Sibelco
- SIMCOA
- The Quartz Corp
- WACKER CHEMIE AG
Additional Benefits:
- The market estimate (ME) sheet in Excel format
- 3 months of analyst support
TABLE OF CONTENTS
1 Introduction
- 1.1 Study Assumptions and Market Definition
- 1.2 Scope of the Study
2 Research Methodology
3 Executive Summary
4 Market Landscape
- 4.1 Market Overview
- 4.2 Market Drivers
- 4.2.1 Growing solar-PV capacity surge
- 4.2.2 Semiconductor node-shrink drives ultra-high-purity demand
- 4.2.3 Boom in engineered-quartz interior surfaces
- 4.2.4 Fibre-optic rollout in 5G/FTTx
- 4.2.5 Tailings-derived HPQ lowers cost curve
- 4.3 Market Restraints
- 4.3.1 Ecological impact of quartz mining
- 4.3.2 Energy-intensive purification process
- 4.3.3 Climate-driven mine disruptions
- 4.4 Value Chain Analysis
- 4.5 Porter's Five Forces
- 4.5.1 Bargaining Power of Suppliers
- 4.5.2 Bargaining Power of Buyers
- 4.5.3 Threat of New Entrants
- 4.5.4 Threat of Substitutes
- 4.5.5 Competitive Rivalry
5 Market Size and Growth Forecasts (Volume)
- 5.1 By Product Type
- 5.1.1 High-purity Quartz
- 5.1.1.1 Quartz Surface and Tile
- 5.1.1.2 Fused Quartz Crucible
- 5.1.1.3 Quartz Glass
- 5.1.2 Quartz Crystal
- 5.1.3 Silicon Metal
- 5.1.1 High-purity Quartz
- 5.2 By End-user Industry
- 5.2.1 Electronics and Semiconductor
- 5.2.2 Solar
- 5.2.3 Building and Construction
- 5.2.4 Optical Fiber and Telecommunication
- 5.2.5 Automotive
- 5.2.6 Other End-user Industries
- 5.3 By Geography
- 5.3.1 Asia-Pacific
- 5.3.1.1 China
- 5.3.1.2 India
- 5.3.1.3 Japan
- 5.3.1.4 South Korea
- 5.3.1.5 Malaysia
- 5.3.1.6 Thailand
- 5.3.1.7 Indonesia
- 5.3.1.8 Vietnam
- 5.3.1.9 Rest of Asia-Pacific
- 5.3.2 North America
- 5.3.2.1 United States
- 5.3.2.2 Canada
- 5.3.2.3 Mexico
- 5.3.3 Europe
- 5.3.3.1 Germany
- 5.3.3.2 United Kingdom
- 5.3.3.3 France
- 5.3.3.4 Italy
- 5.3.3.5 Spain
- 5.3.3.6 NORDIC Countries
- 5.3.3.7 Turkey
- 5.3.3.8 Russia
- 5.3.3.9 Rest of Europe
- 5.3.4 South America
- 5.3.4.1 Brazil
- 5.3.4.2 Argentina
- 5.3.4.3 Colombia
- 5.3.4.4 Rest of South America
- 5.3.5 Middle-East and Africa
- 5.3.5.1 Saudi Arabia
- 5.3.5.2 Qatar
- 5.3.5.3 United Arab Emirates
- 5.3.5.4 Nigeria
- 5.3.5.5 Egypt
- 5.3.5.6 South Africa
- 5.3.5.7 Rest of Middle-East and Africa
- 5.3.1 Asia-Pacific
6 Competitive Landscape
- 6.1 Market Concentration
- 6.2 Strategic Moves
- 6.3 Market Share (%)/Ranking Analysis
- 6.4 Company Profiles (includes Global level Overview, Market level overview, Core Segments, Financials as available, Strategic Information, Market Rank/Share for key companies, Products and Services, and Recent Developments)
- 6.4.1 AGC Inc.
- 6.4.2 Australian Silica Quartz Group Ltd
- 6.4.3 Dow
- 6.4.4 East Hope Group
- 6.4.5 Elkem ASA
- 6.4.6 Ferroglobe
- 6.4.7 Hoshine Silicon Industry Co., Ltd.
- 6.4.8 Imerys
- 6.4.9 India Quartz
- 6.4.10 Jiangsu Pacific Quartz Co., Ltd
- 6.4.11 MACTUS
- 6.4.12 NIHON DEMPA KOGYO CO., LTD.
- 6.4.13 Nordic Mining ASA
- 6.4.14 Saint-Gobain
- 6.4.15 Sibelco
- 6.4.16 SIMCOA
- 6.4.17 The Quartz Corp
- 6.4.18 WACKER CHEMIE AG
7 Market Opportunities and Future Outlook
- 7.1 White-space and Unmet-need Assessment
