
|
시장보고서
상품코드
1907235
석회석 시장 : 시장 점유율 분석, 산업 동향 및 통계, 성장 예측(2026-2031년)Limestone - Market Share Analysis, Industry Trends & Statistics, Growth Forecasts (2026 - 2031) |
||||||
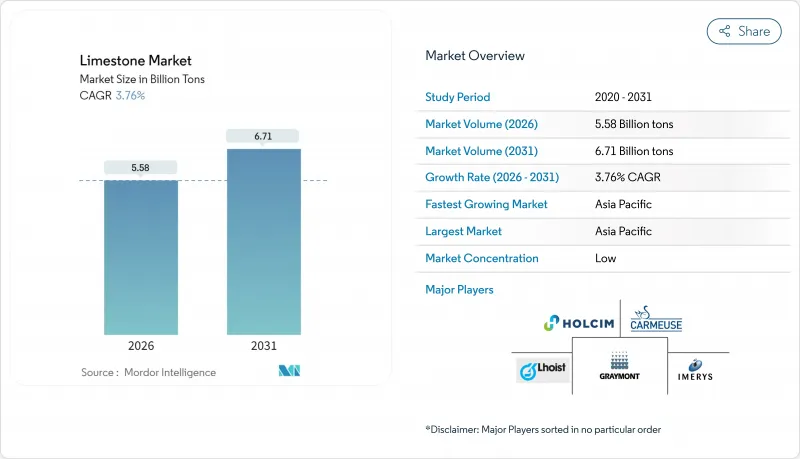
석회석 시장 규모는 2026년 55억 8,000만 톤으로 추정되고, 2025년 53억 8,000만 톤에서 성장했으며, 2031년에는 67억 1,000만 톤에 이를 것으로 예측됩니다. 2026-2031년 CAGR 3.76%로 성장할 전망입니다.
이러한 꾸준한 증가는 철강 플럭스, 시멘트 클링커, 배연 탈황(FGD) 및 신흥 탄소 제거 기술에서 석회석의 대체 불가능한 역할에 의해 뒷받침됩니다. 철강 제조업체가 생산량 1톤당 더 많은 플럭스를 소비하는 수소 기반의 직접 환원 프로세스로 이행하는 중, 공업용 석회 용도가 계속해서 수요량을 견인하고 있습니다. 신흥 아시아 국가에서의 건설 활동의 활성화, 석탄 의존 경제권에서의 환경 규제 강화, 직접 대기 회수 파일럿 사업으로부터의 고품질품 수요가 더욱 성장을 추진하고 있습니다. 경쟁 환경에서는 장수명 채석장의 확보와 하류 가공의 통합을 도모하는 인수 활동이 중심이 되는 한편, 채석 허가의 엄격화 및 탄소세 부담 증가가 비용 구조에 영향을 미치고 있습니다.
세계의 석회석 시장 동향 및 전망
신흥 아시아의 건설 슈퍼 사이클이 벌크 석회석 수요 견인
인도, 인도네시아, 베트남, 캄보디아의 인프라 계획이 가속화됨에 따라 시멘트 킬른은 정격 용량에 가까운 가동률을 유지하고 있으며, 석회석이 시멘트 원료의 약 80%를 차지하기 때문에 석회석 수요 증가로 이어지고 있습니다. 채석장에서 석회석을 경제적으로 운송할 수 있는 단거리(일반적으로 200km 미만) 때문에 공급 위험은 대규모 도시 프로젝트 주변에 집중되어 있습니다. 그러나 라자스탄, 오리사, 안도라 프라데시의 풍부한 매장량은 인도의 비용 우위를 지속적으로 지원합니다.
철강을 대량으로 소비하는 에너지 전환 프로젝트가 플럭스 수요를 끌어올립니다.
풍력 터빈 기초에는 1메가와트 당 200-400톤의 강재가 필요하며, 기본 산소법로나 전기로에 있어서 강재의 플럭스 사용률이, 보다 깨끗한 화학 조성을 추구하는 오퍼레이터에 의해 상승하기 때문에 석회석 수요도 동시에 증가합니다. 수소 기반 직접 환원철(DRI-H2) 유동 시트는 증가된 맥석의 부착을 관리하기 위해 15-20% 많은 플럭스를 소비합니다. 한편, 대규모 태양광 발전용 태양광 등급 유리에는 석회석 유래의 소다라임 규산염이 1메가와트당 3-4톤 필요합니다. 따라서 2030년까지 11,000GW를 목표로 하는 세계의 신재생 에너지 확대는 철강이 저탄소 경로로 이행하는 중에도 산업용 석회 수요량을 계속 증가시킬 것입니다.
채석장의 환경부하 및 생물다양성 소송이 조업 허가 엄격화
온타리오주의 '골재자원법'에서는 여러 해에 걸친 생태계 기준선 조사, 지하수위 모델링, 폐쇄 후 복원 보증이 의무화되어 생산 전 비용이 광산 수명 자본의 8-12% 증가합니다. 퀸즐랜드 주와 캘리포니아 주에서도 유사한 장벽으로 허가주기가 2년 이상 연장되었으며, 중소기업은 통합 및 사업 매각을 강요받고 있습니다. 롱클리프사가 연간 35만m3에 취수량 증가를 신청한 것과 같은 취수 허가는 공청회나 환경 심사를 거쳐 시간 및 비용이 증가합니다. 서식지가 풍부한 지역에 존재하는 광상은 이러한 법적 위험 증가에 직면하여 고품질의 석재 공급을 제한하고 있습니다.
부문 분석
2025년 시점에서 산업용 석회는 석회석 시장의 65.92%를 차지했습니다. EU와 미국에서 수소 DRI 시험의 활성화를 배경으로 CAGR 4.02%의 전망이 제시되고 있으며, 2031년까지 공업용 석회가 석회석 시장의 핵심 분야인 것을 확실히 시사합니다. 화학용 석회는 아시아의 폐수 규제 강화와 유황 회수 의무화를 배경으로 중간 정도의 단일 자리 성장이 계속되고 있습니다. 건설용 석회 수요량은 대체 결합재의 보급에 의해 평평한 상태이지만, 내화물 등급은 전기 아크로의 냄비 라이닝 수요에 지지되어 틈새 시장에서 확대가 예상됩니다.
통합 제철소 및 채석 장소 유자간 장기 공급계약은 현금 흐름을 안정시키고 주요 광산 회사를 주기적인 스팟 가격 변동으로부터 보호합니다. 로이스트사와 같은 기업들은 녹색강철 개발업체와 각서를 체결하고 인증된 저탄소 석회를 공급함으로써 수직 통합 파트너십을 활용하여 탄소세 위험을 헤지하고 있습니다.
석회석 보고서는 용도별(공업용 석회, 화학용 석회, 건설용 석회, 내화물용 석회), 최종 사용자 산업별(제지 및 펄프, 수처리, 농업, 플라스틱, 건축 및 건설 등), 지역별(아시아태평양, 북미, 유럽, 남미, 중동 및 아프리카)으로 분류되어 있습니다. 시장 예측은 수량(톤) 기준으로 제공됩니다.
지역별 분석
아시아태평양은 2025년 세계 석회석 시장 점유율의 71.62%를 차지했으며, 2031년까지 연평균 복합 성장률(CAGR) 4.49%로 성장할 전망입니다. 라자스탄 주, 광서 치완족 자치구, 자바 섬의 풍부한 육상 광상으로 디젤 가격 상승에도 불구하고 납품 비용 곡선은 낮은 수준을 유지하고 있습니다. 동남아시아 각국 정부는 석탄화력발전소에 배연탈황장치(FGD)의 설치를 의무화하고 있으며 베트남 하남과 인도네시아 남수마트라의 현지 채석장이 공급을 시작한 특수석회석 수요가 증가하고 있습니다.
북미와 유럽에서는 하류의 탈탄소화 기술이 견인역이 되어 공급량이 적은 고부가가치 시장을 형성하고 있습니다. 그레이몬트의 '칼슘 기반 솔루션'으로의 브랜드 전환 및 칼무스의 CO2 로드맵은 지역 리더 기업을 DAC 공급 계약 및 포틀랜드 석회석 시멘트 확장을 위한 우위에 자리잡고 있습니다.
중동 및 아프리카에서는 사우디아라비아가 거대 프로젝트를 위한 채석장 라이선싱을 확대하고 이집트가 GCC용 침전 탄산칼슘 공급국으로서의 지위를 확립하는 등 석회석 시장의 성장이 가속화되고 있습니다. 남미의 동향은 브라질의 인프라 자극책과 아르헨티나의 정치적 안정에 달려 있습니다. 인도네시아의 국영생산자인 시멘 바투라자는 국내 시멘트 수요의 견조함을 반영하여 2024년 과거 최고의 수익을 기록했습니다.
기타 혜택 :
- 엑셀 형식 시장 예측(ME) 시트
- 애널리스트에 의한 3개월간의 지원
자주 묻는 질문
목차
제1장 서론
- 조사의 전제조건 및 시장 정의
- 조사 범위
제2장 조사 방법
제3장 주요 요약
제4장 시장 상황
- 시장 개요
- 시장 성장 촉진요인
- 신흥 아시아의 건설 슈퍼 사이클이 석회석의 대량 수요 견인
- 철강을 많이 사용하는 에너지 전환 프로젝트(풍력, 태양광, 수소)가 플럭스 소비량 촉진
- 석탄 의존도가 높은 경제권에서 탈황 처리 및 기타 환경 규제
- 고품위 석회석을 이용한 직접 대기 및 해양 CO2 광물화 파일럿 사업
- 바이오 베이스 플라스틱용 마스터 배치 제조업체는 초미세 CaCO3 충전재 등급 채용
- 시장 성장 억제요인
- 채석장의 환경 부하 및 생물 다양성 소송에 의해 조업 허가가 엄격화
- 석회가마로부터의 고배출 CO2가 탄소세 리스크 초래
- 인공석재 및 지오폴리머 시멘트가 장식용 및 보통 포틀랜드 시멘트(OPC) 수요 빼앗고 있습니다.
- 밸류체인 분석
- Porter's Five Forces
- 공급기업의 협상력
- 구매자의 협상력
- 신규 참가업체의 위협
- 대체품의 위협
- 경쟁도
- 수출입 동향
- 가격 동향
제5장 시장 규모 및 성장 예측(수량 및 금액 기준)
- 용도별
- 산업용 석회
- 화학석회
- 건축용 석회
- 내화석회
- 최종 사용자 업계별
- 종이 및 펄프
- 수처리
- 농업
- 플라스틱
- 건축 및 건설
- 철강 제조업 및 기타 산업(에너지 산업 포함)
- 기타 최종 사용자 산업
- 지역별
- 아시아태평양
- 중국
- 인도
- 일본
- 한국
- ASEAN
- 기타 아시아태평양
- 북미
- 미국
- 캐나다
- 멕시코
- 유럽
- 독일
- 영국
- 프랑스
- 이탈리아
- 스페인
- 북유럽 국가
- 러시아
- 기타 유럽
- 남미
- 브라질
- 아르헨티나
- 콜롬비아
- 중동 및 아프리카
- 사우디아라비아
- 남아프리카
- 기타 중동 및 아프리카
- 아시아태평양
제6장 경쟁 구도
- 시장 집중도
- 전략적 동향
- 시장 점유율(%) 및 순위 분석
- 기업 프로파일
- ARGOS
- CALCO-BOLIVIA
- Caleras San Juan
- CALIDRA
- Calizas Huayco SA
- CALMOSCORP
- Calpar Limestone Trading Ltd.
- Carmeuse
- GCCP Resources Limited
- Graymont Limited
- Gujarat Mineral Development Corporation Ltd.
- Holcim
- Imerys
- JM Huber Corporation
- Lhoist
- Longcliffe Quarries Ltd
- Minerals Technologies Inc
- Nittetsu Mining Co. Ltd
- Okutama Kogyo Co. Ltd
- Omya AG
- SCHAEFER KALK GmbH Co. and AG
제7장 시장 기회 및 장래 전망
AJY 26.01.26Limestone market size in 2026 is estimated at 5.58 Billion tons, growing from 2025 value of 5.38 Billion tons with 2031 projections showing 6.71 Billion tons, growing at 3.76% CAGR over 2026-2031.

This steady rise is anchored in limestone's irreplaceable role in steel flux, cement clinker, flue-gas desulfurization (FGD), and emerging carbon-removal technologies. Industrial lime applications continue to dominate volume demand as steelmakers shift to hydrogen-based direct-reduction processes that consume more flux per ton of output. Construction activity in emerging Asia, stricter environmental regulations in coal-reliant economies, and premium-grade demand from direct-air-capture pilots add further momentum. Competitive activity centers on acquisitions that secure long-life quarries and integrate downstream processing, while tightening quarry permits and rising carbon-tax exposure shape cost structures.
Global Limestone Market Trends and Insights
Construction Super-cycle in Emerging Asia Drives Bulk Limestone Demand
Accelerated infrastructure programs across India, Indonesia, Vietnam, and Cambodia keep cement kilns running near nameplate capacity, raising limestone pull-through because the mineral accounts for roughly 80% of cement feedstock. The short haul radius that quarry stone can travel economically, typically less than 200 km, concentrates supply risk near large urban projects. Nevertheless, abundant reserves in Rajasthan, Odisha, and Andhra Pradesh continue to anchor India's cost advantage.
Steel-intensive Energy-transition Projects Boost Flux Consumption
Wind-turbine foundations require 200-400 tons of steel per megawatt, driving parallel limestone demand because steel flux rates in basic-oxygen and electric-arc furnaces rise as operators chase cleaner chemistries. Hydrogen-based direct-reduction iron (DRI-H2) flowsheets consume 15-20% more flux to manage increased gangue pickup, while solar-grade glass for utility-scale photovoltaics needs limestone-derived soda-lime silicates at 3-4 tons per megawatt. Global renewables expansion toward 11,000 GW by 2030 therefore keeps industrial lime volumes growing even as steel shifts to low-carbon pathways.
Quarry-footprint and Biodiversity Litigation Tighten Operating Licenses
Ontario's Aggregate Resources Act now requires multi-year ecological baselines, water-table modeling, and post-closure rehabilitation guarantees that lift pre-production costs by 8-12% of life-of-mine capital. Similar hurdles in Queensland and California extend approval cycles beyond two years, pressuring smaller operators to consolidate or divest. Water-abstraction permits, such as Longcliffe's request to boost intake to 350,000 m3/year, face public consultation and environmental scrutiny that add time and cost. Deposits situated in habitat-rich areas thus face rising legal risks, restricting supply of premium stone grades.
Other drivers and restraints analyzed in the detailed report include:
- Desulfurization Environmental Mandates in Coal-heavy Economies
- Ultra-fine CaCO3 in Bio-based Plastics
- High Process CO2 from Lime Kilns Invites Carbon-tax Exposure
For complete list of drivers and restraints, kindly check the Table Of Contents.
Segment Analysis
Industrial lime held 65.92% of limestone market share in 2025. Intensifying hydrogen-DRI trials in the EU and the U.S. underpin a 4.02% CAGR outlook, ensuring industrial lime remains the anchor of the limestone market through 2031. Chemical lime follows at mid-single-digit growth, fueled by stricter wastewater norms and sulfur-capture mandates in Asia. Construction lime volumes stay flat as alternative binders gain traction, while refractory grades show niche expansion tied to electric-arc furnace ladle linings.
Long-term supply contracts between integrated steel mills and quarry owners stabilize cash flow, insulating the largest miners from cyclical spot swings. Players such as Lhoist have signed memoranda with green-steel developers to deliver certified low-carbon lime, leveraging vertical partnerships to hedge against carbon taxes.
The Limestone Report is Segmented by Application (Industry Lime, Chemical Lime, Construction Lime, and Refractory Lime), End-User Industry (Paper and Pulp, Water Treatment, Agriculture, Plastics, Building and Construction, and More), and Geography (Asia-Pacific, North America, Europe, South America, and Middle-East and Africa). The Market Forecasts are Provided in Terms of Volume (Tons),
Geography Analysis
Asia-Pacific accounted for 71.62% of global limestone market share in 2025 and is poised for a 4.49% CAGR through 2031. Abundant on-shore deposits in Rajasthan, Guangxi, and Java keep delivered-cost curves low despite rising diesel prices. Southeast Asian governments mandate FGD retrofits on coal plants, adding specialized limestone demand that local quarries in Vietnam's Ha Nam and Indonesia's South Sumatra have begun to supply.
North America and Europe offer smaller volumes but higher value, driven by downstream decarbonization technologies. Graymont's rebrand toward "calcium-based solutions" and Carmeuse's CO2 road-map position regional leaders for DAC supply contracts and Portland Limestone Cement expansions.
The Middle East and Africa register accelerating limestone market growth as Saudi Arabia expands quarry licensing to feed giga-projects and Egypt positions itself as a GCC supplier of precipitated calcium carbonate. South America's trajectory hinges on Brazil's infrastructure stimulus and Argentina's political stability. Indonesian state-backed producer Semen Baturaja posted record 2024 earnings, reflecting strong domestic cement pull.
- ARGOS
- CALCO-BOLIVIA
- Caleras San Juan
- CALIDRA
- Calizas Huayco SA
- CALMOSCORP
- Calpar Limestone Trading Ltd.
- Carmeuse
- GCCP Resources Limited
- Graymont Limited
- Gujarat Mineral Development Corporation Ltd.
- Holcim
- Imerys
- J.M. Huber Corporation
- Lhoist
- Longcliffe Quarries Ltd
- Minerals Technologies Inc
- Nittetsu Mining Co. Ltd
- Okutama Kogyo Co. Ltd
- Omya AG
- SCHAEFER KALK GmbH Co. and AG
Additional Benefits:
- The market estimate (ME) sheet in Excel format
- 3 months of analyst support
TABLE OF CONTENTS
1 Introduction
- 1.1 Study Assumptions and Market Definition
- 1.2 Scope of the Study
2 Research Methodology
3 Executive Summary
4 Market Landscape
- 4.1 Market Overview
- 4.2 Market Drivers
- 4.2.1 Construction super-cycle in emerging Asia drives bulk limestone demand
- 4.2.2 Steel-intensive energy-transition projects (wind, solar, H2) boost flux consumption
- 4.2.3 Desulfurisation and other environmental mandates in coal-heavy economies
- 4.2.4 Direct air/ocean CO2 mineralisation pilots using high-grade limestone
- 4.2.5 Bio-based plastic master-batchers adopt ultra-fine CaCO3 filler grades
- 4.3 Market Restraints
- 4.3.1 Quarrying footprint and biodiversity litigation tighten operating licences
- 4.3.2 High process CO2 from lime kilns invites carbon-tax exposure
- 4.3.3 Engineered stone and geopolymer cement cannibalise decorative and OPC demand
- 4.4 Value Chain Analysis
- 4.5 Porter's Five Forces
- 4.5.1 Bargaining Power of Suppliers
- 4.5.2 Bargaining Power of Buyers
- 4.5.3 Threat of New Entrants
- 4.5.4 Threat of Substitutes
- 4.5.5 Degree of Competition
- 4.6 Import-Export Trends
- 4.7 Price Trends
5 Market Size and Growth Forecasts (Volume and Value)
- 5.1 By Application
- 5.1.1 Industry Lime
- 5.1.2 Chemical Lime
- 5.1.3 Construction Lime
- 5.1.4 Refractory Lime
- 5.2 By End-User Industry
- 5.2.1 Paper and Pulp
- 5.2.2 Water Treatment
- 5.2.3 Agriculture
- 5.2.4 Plastics
- 5.2.5 Building and Construction
- 5.2.6 Steel Manufacturing and Other Industries (Including Energy)
- 5.2.7 Other End-user Industries
- 5.3 By Geography
- 5.3.1 Asia-Pacific
- 5.3.1.1 China
- 5.3.1.2 India
- 5.3.1.3 Japan
- 5.3.1.4 South Korea
- 5.3.1.5 ASEAN
- 5.3.1.6 Rest of Asia-Pacific
- 5.3.2 North America
- 5.3.2.1 United States
- 5.3.2.2 Canada
- 5.3.2.3 Mexico
- 5.3.3 Europe
- 5.3.3.1 Germany
- 5.3.3.2 United Kingdom
- 5.3.3.3 France
- 5.3.3.4 Italy
- 5.3.3.5 Spain
- 5.3.3.6 Nordic Countries
- 5.3.3.7 Russia
- 5.3.3.8 Rest of Europe
- 5.3.4 South America
- 5.3.4.1 Brazil
- 5.3.4.2 Argentina
- 5.3.4.3 Colombia
- 5.3.5 Middle-East and Africa
- 5.3.5.1 Saudi Arabia
- 5.3.5.2 South Africa
- 5.3.5.3 Rest of Middle-East and Africa
- 5.3.1 Asia-Pacific
6 Competitive Landscape
- 6.1 Market Concentration
- 6.2 Strategic Moves
- 6.3 Market Share (%)/Ranking Analysis
- 6.4 Company Profiles (includes Global level Overview, Market level overview, Core Segments, Financials as available, Strategic Information, Market Rank/Share for key companies, Products and Services, and Recent Developments)
- 6.4.1 ARGOS
- 6.4.2 CALCO-BOLIVIA
- 6.4.3 Caleras San Juan
- 6.4.4 CALIDRA
- 6.4.5 Calizas Huayco SA
- 6.4.6 CALMOSCORP
- 6.4.7 Calpar Limestone Trading Ltd.
- 6.4.8 Carmeuse
- 6.4.9 GCCP Resources Limited
- 6.4.10 Graymont Limited
- 6.4.11 Gujarat Mineral Development Corporation Ltd.
- 6.4.12 Holcim
- 6.4.13 Imerys
- 6.4.14 J.M. Huber Corporation
- 6.4.15 Lhoist
- 6.4.16 Longcliffe Quarries Ltd
- 6.4.17 Minerals Technologies Inc
- 6.4.18 Nittetsu Mining Co. Ltd
- 6.4.19 Okutama Kogyo Co. Ltd
- 6.4.20 Omya AG
- 6.4.21 SCHAEFER KALK GmbH Co. and AG
7 Market Opportunities and Future Outlook
- 7.1 White-space and Unmet-Need Assessment
