
|
시장보고서
상품코드
1907242
나노센서 시장 : 시장 점유율 분석, 산업 동향 및 통계, 성장 예측(2026-2031년)Nanosensors - Market Share Analysis, Industry Trends & Statistics, Growth Forecasts (2026 - 2031) |
||||||
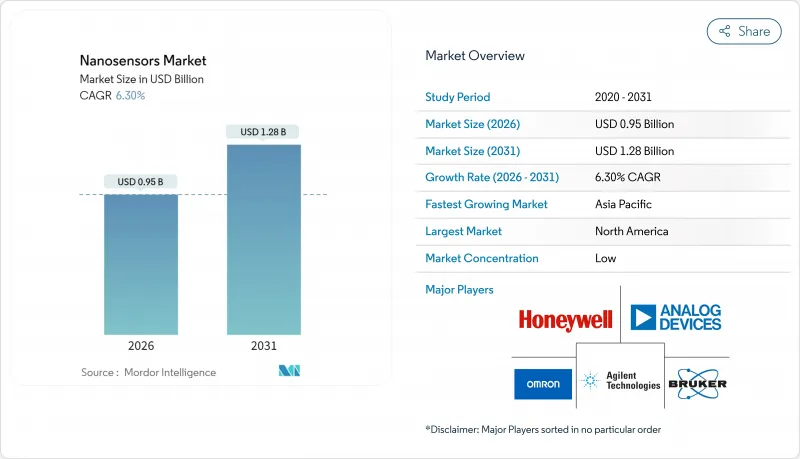
나노센서 시장은 2025년에 8억 9,000만 달러로 평가되었고, 2026년 9억 5,000만 달러에서 2031년까지 12억 8,000만 달러에 이를 것으로 예측되고 있습니다. 예측 기간(2026-2031년) 동안 CAGR 6.30%로 성장이 전망되고 있습니다.

이 성장은 세 가지 기둥에 의해 지원됩니다. 전자 및 의료 분야에서 소형화의 압력, 양자점 제조 비용의 급격한 감소, 그리고 예보 유지 IoT 시스템의 보급 확대. 정부의 나노기술 프로그램, POC(Point of Care) 진단 도입, 미량 폭발물 검출에 대한 방위 수요가 나노 센서의 잠재 시장을 지속적으로 확대하고 있습니다. 반도체 대기업이 단층 탄소나노튜브 공급 확보를 위한 수직 통합을 진행하는 한편, 틈새 개발 기업은 초선택적 생화학 센싱에 주력하고 있어 경쟁 격화가 진행되고 있습니다. 동시에 규제 당국은 나노독성학 가이드라인을 책정 중이며, 이것이 확정되는 대로 제품 승인의 가속이 기대됩니다.
세계의 나노센서 시장 동향 및 인사이트
전자 기기의 소형화 및 웨어러블 기기에 대한 통합
소비자 및 의료기기 제조업체는 장치의 모양을 늘리지 않고 바이오 마커를 추적하는 100 나노미터 미만의 감지 요소를 통합합니다. Apple의 최신 헬스워치는 지속적인 혈당 및 산소 포화도 모니터링을 위한 나노센서 어레이를 통합하여 상업적 실용성을 보이면서 2027년까지 2억 달러의 추가 잠재 수익을 창출할 전망입니다. 삼성의 특허출원은 스마트폰에서 실시간 알레르겐 검출을 시사하고 항공우주 부품에서는 좁은 환경 하에서의 변형 측정에 나노센서를 채용하고 있습니다. 웨어러블 의료기기에 대한 FDA 심사의 가속화는 제품 투입 사이클을 단축하고 혁신자가 선구자 우위를 확보할 수 있도록 합니다.
정부 자금을 이용한 나노기술 조사 프로그램
공공 지출은 장기적인 수요를 지원합니다. 미국 국가 나노테크놀로지 이니셔티브는 2024년에 18억 달러를 기록했으며, 그 약 1/4이 센싱 조사에 할당되었습니다. 중국의 '14차 5개년 계획' 및 EU의 '호라이즌 유럽'은 양자점 및 탄소나노튜브 시설에 동등한 자원을 투입하여 나노센서 기판에 대한 확실한 수요를 창출하고 있습니다. 방위 기관은 이 기술을 전략적으로 자리매김하고, 경기후퇴기에도 예산을 보호하며, 조달 계약의 안정된 공급을 확보하고 있습니다.
복잡한 나노 패브리케이션의 확장성에서 병목 현상
50나노미터 이하의 리소그래피에는 1대당 2억 달러의 극자외선 노광 장치가 필요하며 자본 예산을 압박하고 세계 생산 능력을 제한하고 있습니다. 수율은 60% 미만으로 반도체 라인의 표준치의 1/3에 머물기 때문에 단위당 경제성이 악화되고 있습니다. TSMC의 공개 정보에 따르면 결함 밀도 문제로 인해 생산 비용이 예측 지표의 3배로 늘어나고 있습니다. 이러한 제약은 혼합 아키텍처를 채택하여 완전한 나노 스케일 솔루션의 성능 이점을 희박하게 만듭니다.
부문 분석
2025년 화학 나노센서는 의료진단 및 환경 시험에 대한 수요가 증가함에 따라 나노센서 시장에서 32.95%의 압도적인 점유율을 차지했습니다. 물리적 나노센서는 고해상도 압력 및 변형률 측정에 대한 항공우주 분야 수요에 힘입어 7.08%의 연평균 복합 성장률(CAGR)을 기록하여 이 분야에서 가장 높은 성장률이 되었습니다. 생물학적 나노 센서는 약물 모니터링에 단일 분자 검출 기술을 활용하여 정밀 치료라는 틈새 시장을 차지합니다. Abbott의 여러 바이오마커를 동시에 스크리닝하는 프로토타입에서 알 수 있듯이, 하이브리드 디바이스는 현재 화학적 선택성과 생물학적 특이성을 융합하고 있습니다. 분석 화학에 대한 규제에 대한 이해가 깊어짐에 따라 화학 나노 센서는 승인까지의 경로가 부드럽게 되는 한편, 기계공학의 표준화에 의해 물리적 센서의 도입이 가속화되고 있습니다.
동시에 첨단 표면 기능화 기법은 범주 경계를 모호하게 만들고 학제 간 용도를 가능하게 합니다. 물리 센서는 단위 비용을 줄이는 성숙한 MEMS 프로세스의 혜택을 누리고 있으며 자동차 OEM 제조업체의 관심을 끌고 있습니다. 화학 장치는 분자 식별이 중요한 수질 모니터링에 계속 지지됩니다. 생물학적 나노센서는 높은 가격 설정을 정당화하는 집중 치료 환경을 계속 목표로 삼고 있습니다.
지역별 분석
북미는 2025년 나노센서 시장 수익의 30.95%를 차지했으며, 방위 계약, FDA 승인 의료기기, 견조한 벤처 자금 조달 생태계에 견인되었습니다. 미국 방총성 단독으로도 2024년 나노센서 연구개발에 3억 4,000만 달러를 예산화하고 있습니다. 캐나다 양자점 공장과 멕시코의 비용 효율적인 전자기기 조립이 이 지역 공급망을 보완하고 있습니다. 규제 가속화 프로그램은 시장 진입을 촉진하지만 엄격한 환경 규제로 인해 많은 컴플라이언스 비용이 발생합니다.
아시아태평양은 2031년까지 연평균 복합 성장률(CAGR) 7.86%로 확대되어 북미와의 차이를 줄일 것으로 예측됩니다. 중국의 23억 달러 규모의 센서 계획, 일본의 Society 5.0 스마트 시티 구상, 한국의 K-반도체 벨트는 국내 제조 라인을 육성하고 있습니다. 낮은 운영 비용이 세계 제조 아웃소싱을 유치했습니다. 싱가포르와 대만은 고정밀 어셈블리를 공급하고 인도는 애프터마켓 서비스 및 교정 분야에서 입지를 확립하고 있습니다.
유럽에서는 자동차 및 산업 분야의 견조한 수요가 계속되고, 독일은 자동차 배출 가스 검지를, 네덜란드는 과학 계측 기기를 주도하고 있습니다. REACH 규정은 인증주기를 장기화하지만 컴플라이언스에 익숙한 공급업체에게는 이익을 제공합니다. 프랑스와 영국은 방위 관련 나노 센서 프로그램에 연구 자금을 투입하고 있습니다. 중동 및 아프리카에서는 유전 감시 분야에서 도입이 현재화되고 있어 나노 센서의 내구성이 고부가가치를 가져옵니다. 남미는 전문적인 광업 및 환경 복구 파일럿 사업에 한정되어 지연이 보입니다.
기타 혜택 :
- 엑셀 형식 시장 예측(ME) 시트
- 애널리스트에 의한 3개월간의 지원
자주 묻는 질문
목차
제1장 서론
- 조사의 전제조건 및 시장 정의
- 조사 범위
제2장 조사 방법
제3장 주요 요약
제4장 시장 상황
- 시장 개요
- 시장 성장 촉진요인
- 전자기기의 소형화 및 웨어러블 기기의 통합
- 정부 자금에 의한 나노 기술 조사 프로그램
- POC(Point of Care) 진단의 급속한 확대
- 산업용 예지보전 IoT 도입의 급증
- 미량폭발물 및 CBRN 검지에 대한 방위 수요
- 양자점의 비용 곡선 개선
- 시장 성장 억제요인
- 복잡한 나노 패브리케이션의 확장성에 관한 병목
- 나노독성학 기준에 있어서 규제의 지연
- 고습도 필드 환경에서의 신호 드리프트
- 고순도 단층 탄소나노튜브(SWCNT) 공급망 집중
- 공급망 분석
- 규제 상황
- 기술의 전망
- 거시경제 요인이 시장에 미치는 영향
- Porter's Five Forces 분석
- 공급기업의 협상력
- 소비자의 협상력
- 신규 참가업체의 위협
- 경쟁 기업간 경쟁 관계
- 대체품의 위협
제5장 시장 규모 및 성장 예측
- 유형별
- 생물학적 나노센서 시장
- 화학 나노센서 시장
- 물리적 나노센서 시장
- 용도별
- 헬스케어
- 소비자용 전자 기기
- 항공우주 및 방위
- 자동차 및 산업
- 발전
- 기타 최종 사용자 업종
- 기술별
- 전기화학
- 광학
- 전자기
- 압전
- 나노 기계
- 지역별
- 북미
- 미국
- 캐나다
- 멕시코
- 남미
- 브라질
- 아르헨티나
- 기타 남미
- 유럽
- 독일
- 영국
- 프랑스
- 이탈리아
- 스페인
- 러시아
- 기타 유럽
- 아시아태평양
- 중국
- 일본
- 인도
- 한국
- 동남아시아
- 기타 아시아태평양
- 중동 및 아프리카
- 중동
- 사우디아라비아
- 아랍에미리트(UAE)
- 기타 중동
- 아프리카
- 남아프리카
- 이집트
- 기타 아프리카
- 중동
- 북미
제6장 경쟁 구도
- 시장 집중도
- 전략적 동향
- 시장 점유율 분석
- 기업 프로파일
- Agilent Technologies Inc.
- Analog Devices Inc.
- OMRON Corporation
- Honeywell International Inc.
- Bruker Corporation
- Texas Instruments Inc.
- Lockheed Martin Corporation
- STMicroelectronics NV
- Robert Bosch GmbH
- Samsung Electronics Co. Ltd.
- Medtronic plc
- Universal Biosensors Inc.
- Hoffmann-La Roche Ltd.
- Nanowear Inc.
- AerBetic LLC
- Applied Nanodetectors Ltd.
- BreathDX Ltd.
- Inanon Bio Inc.
- LamdaGen Corporation
- Vista Therapeutics Inc.
- GBS Inc.
- Applied Nanotech Inc.(PEN Inc.)
- Oxonica Limited
- Beijing ALT Technology Co.
- NanoWorld AG
- Sensonor AS
- Synkera Technologies Inc.
제7장 시장 기회 및 장래 전망
AJY 26.01.26The nanosensors market was valued at USD 0.89 billion in 2025 and estimated to grow from USD 0.95 billion in 2026 to reach USD 1.28 billion by 2031, at a CAGR of 6.30% during the forecast period (2026-2031).
This growth rests on three pillars: miniaturization pressures across electronics and healthcare, steep cost declines in quantum dot fabrication, and the widening adoption of predictive maintenance IoT systems. Government nanotechnology programs, point-of-care diagnostic rollouts, and defense demand for trace-explosive detection continue to broaden the addressable nanosensors market. Competitive intensity is rising as semiconductor leaders integrate vertically to secure a single-wall carbon nanotube supply, while niche developers focus on ultra-selective biochemical sensing. Simultaneously, regulators are drafting nano-toxicology guidelines that could accelerate product clearances once finalized.
Global Nanosensors Market Trends and Insights
Miniaturization of Electronics and Wearables Integration
Consumer and medical device makers are embedding sub-100 nm sensing elements that track biomarkers without enlarging device form factors. Apple's latest health watch integrates nanosensor arrays for continuous glucose and oxygen-saturation monitoring, illustrating commercial readiness and spurring a USD 200 million incremental addressable revenue by 2027. Samsung patent filings point to real-time allergen detection in smartphones, while aerospace components adopt nanosensors to measure strain in space-constrained environments. Faster FDA reviews for wearable medical devices shorten launch cycles, allowing innovators to capture early-mover advantages.
Government-Funded Nanotech Research Programs
Public spending anchors long-range demand. The U.S. National Nanotechnology Initiative earmarked USD 1.8 billion in 2024, with nearly one-quarter of the funding allocated to sensing research. China's 14th Five-Year Plan and the EU's Horizon Europe pour matching resources into quantum-dot and carbon-nanotube facilities, creating reliable demand for nanosensor substrates. Defense agencies treat the technology as strategic, insulating budgets even in downturns and ensuring a steady pipeline of procurement contracts.
Complex Nanofabrication Scalability Bottlenecks
Sub-50 nm lithography demands extreme-ultraviolet tools that cost USD 200 million each, pressing capital budgets and capping global output capacity. Yield rates remain below 60%, which is three times lower than the standard for semiconductor lines, thereby inflating unit economics. TSMC's public disclosures reveal defect-density hurdles that triple production costs versus projected metrics. These constraints force blended architectures that dilute the performance edge of fully nanoscale solutions.
Other drivers and restraints analyzed in the detailed report include:
- Rapid Expansion of Point-of-Care Diagnostics
- Surge in Industrial Predictive-Maintenance IoT Deployments
- Regulatory Lag on Nano-Toxicology Standards
For complete list of drivers and restraints, kindly check the Table Of Contents.
Segment Analysis
Chemical nanosensors held a dominant 32.95% share of the nanosensors market in 2025, driven by strong uptake in medical diagnostics and environmental testing. Physical variants registered a 7.08% CAGR, the fastest in class, fueled by aerospace demand for high-resolution pressure and strain measurement. Biological nanosensors occupy a niche in precision therapeutics, leveraging single-molecule detection for the monitoring of drugs. Hybrid devices now merge chemical selectivity with biological specificity, as evidenced by Abbott prototypes that simultaneously screen multiple biomarkers. Regulatory familiarity with analytical chemistry provides chemical nanosensors with a smoother path to approval, while mechanical engineering standards expedite the deployment of physical sensors.
In parallel, advanced surface-functionalization methods blur category lines, enabling cross-disciplinary applications. Physical sensors benefit from maturing MEMS processes that cut per-unit costs, drawing interest from automotive OEMs. Chemical devices remain favored in water-quality monitoring where molecular discrimination is crucial. Biological nanosensors continue to target intensive-care environments that justify premium pricing.
The Nanosensors Market Report is Segmented by Type (Biological Nanosensors, Chemical Nanosensors, and More), End-Use Verticals (Healthcare, Consumer Electronics, Aerospace and Defense, and More), Technology (Electrochemical, Optical, Electromagnetic, Piezoelectric, and More), and Geography (North America, South America, Europe, Asia-Pacific, and More). The Market Forecasts are Provided in Terms of Value (USD).
Geography Analysis
North America generated 30.95% of the nanosensors market revenue in 2025, driven by defense contracts, FDA-approved medical devices, and a robust venture funding ecosystem. The U.S. Department of Defense alone budgeted USD 340 million for nanosensor research and development in 2024. Canada's quantum-dot plants and Mexico's cost-efficient electronics assembly complement the region's supply chain. Regulatory fast-track programs expedite market entry, but stringent environmental rules impose significant compliance costs.
Asia-Pacific is projected to expand at an 7.86% CAGR through 2031, narrowing the gap with North America. China's USD 2.3 billion sensor initiative, Japan's Society 5.0 smart-city agenda, and South Korea's K-Semiconductor Belt foster domestic fabrication lines. Lower operating costs attract global outsourced manufacturing. Singapore and Taiwan supply high-precision assemblies, while India positions for aftermarket services and calibration.
Europe maintains solid demand from automotive and industrial players, with Germany spearheading vehicle emission sensing and the Netherlands focusing on scientific instrumentation. REACH regulations prolong certification cycles, yet they reward suppliers who are well-versed in compliance. France and the United Kingdom channel research funds into defense-aligned nanosensor programs. The Middle East and Africa exhibit a nascent uptake in oil-field monitoring, where nanosensor durability yields premium margins. South America lags, confined to specialized mining and environmental remediation pilots.
- Agilent Technologies Inc.
- Analog Devices Inc.
- OMRON Corporation
- Honeywell International Inc.
- Bruker Corporation
- Texas Instruments Inc.
- Lockheed Martin Corporation
- STMicroelectronics N.V.
- Robert Bosch GmbH
- Samsung Electronics Co. Ltd.
- Medtronic plc
- Universal Biosensors Inc.
- Hoffmann-La Roche Ltd.
- Nanowear Inc.
- AerBetic LLC
- Applied Nanodetectors Ltd.
- BreathDX Ltd.
- Inanon Bio Inc.
- LamdaGen Corporation
- Vista Therapeutics Inc.
- GBS Inc.
- Applied Nanotech Inc. (PEN Inc.)
- Oxonica Limited
- Beijing ALT Technology Co.
- NanoWorld AG
- Sensonor AS
- Synkera Technologies Inc.
Additional Benefits:
- The market estimate (ME) sheet in Excel format
- 3 months of analyst support
TABLE OF CONTENTS
1 INTRODUCTION
- 1.1 Study Assumptions and Market Definition
- 1.2 Scope of the Study
2 RESEARCH METHODOLOGY
3 EXECUTIVE SUMMARY
4 MARKET LANDSCAPE
- 4.1 Market Overview
- 4.2 Market Drivers
- 4.2.1 Miniaturisation of electronics and wearables integration
- 4.2.2 Government-funded nanotech research programmes
- 4.2.3 Rapid expansion of point-of-care diagnostics
- 4.2.4 Surge in industrial predictive-maintenance IoT deployments
- 4.2.5 Defence demand for trace-explosive and CBRN detection
- 4.2.6 Quantum-dot cost curve improvements
- 4.3 Market Restraints
- 4.3.1 Complex nanofabrication scalabilty bottlenecks
- 4.3.2 Regulatory lag on nano-toxicology standards
- 4.3.3 Signal drift in high-humidity field environments
- 4.3.4 Supply-chain concentration of high-purity SWCNTs
- 4.4 Supply-Chain Analysis
- 4.5 Regulatory Landscape
- 4.6 Technological Outlook
- 4.7 Impact of Macroeconomic Factors on the Market
- 4.8 Porter's Five Forces Analysis
- 4.8.1 Bargaining Power of Suppliers
- 4.8.2 Bargaining Power of Consumers
- 4.8.3 Threat of New Entrants
- 4.8.4 Intensity of Competitive Rivalry
- 4.8.5 Threat of Substitute Products
5 MARKET SIZE AND GROWTH FORECASTS (VALUE)
- 5.1 By Type
- 5.1.1 Biological Nanosensors
- 5.1.2 Chemical Nanosensors
- 5.1.3 Physical Nanosensors
- 5.2 By End-use Verticals
- 5.2.1 Healthcare
- 5.2.2 Consumer Electronics
- 5.2.3 Aerospace and Defence
- 5.2.4 Automotive and Industrial
- 5.2.5 Power Generation
- 5.2.6 Other End-user Verticals
- 5.3 By Technology
- 5.3.1 Electrochemical
- 5.3.2 Optical
- 5.3.3 Electromagnetic
- 5.3.4 Piezoelectric
- 5.3.5 Nanomechanical
- 5.4 By Geography
- 5.4.1 North America
- 5.4.1.1 United States
- 5.4.1.2 Canada
- 5.4.1.3 Mexico
- 5.4.2 South America
- 5.4.2.1 Brazil
- 5.4.2.2 Argentina
- 5.4.2.3 Rest of South America
- 5.4.3 Europe
- 5.4.3.1 Germany
- 5.4.3.2 United Kingdom
- 5.4.3.3 France
- 5.4.3.4 Italy
- 5.4.3.5 Spain
- 5.4.3.6 Russia
- 5.4.3.7 Rest of Europe
- 5.4.4 Asia-Pacific
- 5.4.4.1 China
- 5.4.4.2 Japan
- 5.4.4.3 India
- 5.4.4.4 South Korea
- 5.4.4.5 South-East Asia
- 5.4.4.6 Rest of Asia-Pacific
- 5.4.5 Middle East and Africa
- 5.4.5.1 Middle East
- 5.4.5.1.1 Saudi Arabia
- 5.4.5.1.2 United Arab Emirates
- 5.4.5.1.3 Rest of Middle East
- 5.4.5.2 Africa
- 5.4.5.2.1 South Africa
- 5.4.5.2.2 Egypt
- 5.4.5.2.3 Rest of Africa
- 5.4.5.1 Middle East
- 5.4.1 North America
6 COMPETITIVE LANDSCAPE
- 6.1 Market Concentration
- 6.2 Strategic Moves
- 6.3 Market Share Analysis
- 6.4 Company Profiles (includes Global level Overview, Market level overview, Core Segments, Financials as available, Strategic Information, Market Rank/Share for key companies, Products and Services, and Recent Developments)
- 6.4.1 Agilent Technologies Inc.
- 6.4.2 Analog Devices Inc.
- 6.4.3 OMRON Corporation
- 6.4.4 Honeywell International Inc.
- 6.4.5 Bruker Corporation
- 6.4.6 Texas Instruments Inc.
- 6.4.7 Lockheed Martin Corporation
- 6.4.8 STMicroelectronics N.V.
- 6.4.9 Robert Bosch GmbH
- 6.4.10 Samsung Electronics Co. Ltd.
- 6.4.11 Medtronic plc
- 6.4.12 Universal Biosensors Inc.
- 6.4.13 Hoffmann-La Roche Ltd.
- 6.4.14 Nanowear Inc.
- 6.4.15 AerBetic LLC
- 6.4.16 Applied Nanodetectors Ltd.
- 6.4.17 BreathDX Ltd.
- 6.4.18 Inanon Bio Inc.
- 6.4.19 LamdaGen Corporation
- 6.4.20 Vista Therapeutics Inc.
- 6.4.21 GBS Inc.
- 6.4.22 Applied Nanotech Inc. (PEN Inc.)
- 6.4.23 Oxonica Limited
- 6.4.24 Beijing ALT Technology Co.
- 6.4.25 NanoWorld AG
- 6.4.26 Sensonor AS
- 6.4.27 Synkera Technologies Inc.
7 MARKET OPPORTUNITIES AND FUTURE OUTLOOK
- 7.1 White-space and Unmet-Need Assessment
