
|
시장보고서
상품코드
1907346
라이드 셰어링 시장 : 점유율 분석, 업계 동향, 통계, 성장 예측(2026-2031년)Ridesharing - Market Share Analysis, Industry Trends & Statistics, Growth Forecasts (2026 - 2031) |
||||||
라이드 셰어링 시장은 2025년 530억 2,000만 달러로 평가되었고, 2026년에는 589억 9,000만 달러, 2026년부터 2031년에 걸쳐 CAGR 11.26%로 성장하고, 2031년까지 1,005억 2,000만 달러에 이를 것으로 예상됩니다.

스마트폰 보급률의 상승, 5G의 보급, 기업의 지속가능성에 대한 대처, 정체요금제도 등의 지원정책이 수요를 뒷받침하고 있습니다. 플랫폼 주도에 의한 운전자 차량의 전동화는 주행거리당 경제성을 저하시키고 있는 한편, 슈퍼 앱은 스쿠터, 자전거, 교통기관 티켓을 번들함으로써 유저 정착율을 높이고 있습니다. 분산화하면서도 통합이 진행되는 경쟁 환경은 자율주행차 파트너십이나 기업계약을 획득한 사업자에게 유리하게 작용합니다. 플랫폼이 국경을 넘어 확장함에 따라 노동자 분류 및 데이터 현지화에 관한 규제의 명확화는 앞으로도 성장을 좌우하는 결정적인 요인이 될 것입니다.
세계의 라이드 셰어링 시장 동향과 인사이트
마이크로 이동성을 통합하는 슈퍼 앱의 상승
플랫폼은 서비스 구성을 확대하고 동일한 인터페이스 내에서 스쿠터와 자전거를 제공함으로써 네트워크 효과를 창출하고 있습니다. 이렇게 하면 고객 획득 비용이 절감되고 평생 가치가 향상됩니다. Lyft의 앱 사용자는 현재 스쿠터와 시티 오토바이를 대여할 수 있으며, 2024년에는 3만 5,000대의 자전거로 4,500만회의 승차가 달성되었습니다. 샌프란시스코와 같은 도시에서는 단일 사업자가 다중 모드를 운영할 수 있는 통일 허가증을 도입하여 컴플라이언스를 간소화하고 있습니다. 이러한 변화는 특히 자동차의 효율성이 낮은 2마일 미만의 이동에서 이용 빈도를 향상시킵니다. 사용자가 하나의 앱 내에서 완결되므로 이익률이 높은 자동차 이동의 크로스셀링률이 향상됩니다. 또한, 이 전략은 모든 부문에서 규제적 충격으로부터 사업자를 감싸는 역할을 합니다.
성장하는 기업의 지속가능성 요구 사항
기업은 라이드 셰어링을 스코프 3 배출 계획에 통합하고 택시와 렌터카를 시너지 이동으로 대체함으로써 직원 1인당 탄소 발자국을 줄이기 위해 노력하고 있습니다. 미국의 대형 은행과 기술 기업에서는 공항 픽업에서 시너지 서비스만을 비용 정산 대상으로 하는 방침을 채택하고 있어 이에 따라 평일 수요의 예측 가능한 급증이 발생하고 있습니다. 전용 비즈니스 대시보드는 탄소 추적, 자동 청구, 정책 관리 기능을 제공하며, 예측 기간 동안 기업용 라이드 셰어링이 두 자리 성장을 이루는 좋은 조건을 갖추고 있습니다. 안정적인 기업 수요는 계절 변동을 완화하고 운전자의 수익 향상과 플랫폼의 기업 가치 배율 상승에 기여합니다.
운전자 수 규제 및 과급 가격의 상한 강화
미국 각 도시의 최저 임금 조례로 인해 플랫폼은 운전자 수를 줄이거나 운임 가격 인상을 받고 있습니다. 미네아폴리스시는 2024년에 운전자 시간당 15달러를 의무화했으며, 주요 플랫폼이 가격 모델을 재조정하는 동안 일시적인 배차 정지를 일으켰습니다. 수요 피크시의 과급 배율 제한은 공급의 탄력성을 저하시키고, 대기 시간을 연장하고, 사용자 만족도를 저하시키고 있습니다.
부문 분석
법인 고객은 저탄소 및 상승형 모빌리티를 우선하는 출장 규정을 정식화하는 기업이 늘어나는 가운데 세계의 라이드 셰어링 시장을 재구축하고 있습니다. 법인 부문은 2031년까지 연평균 복합 성장률(CAGR) 17.85%로 성장할 전망이며 전 세계 라이드 셰어링 시장 규모의 점유율을 꾸준히 확대하고 있습니다. 법인 예약은 평일 피크 시간대에 집중하는 경향이 있으며 일반 소비자의 오프 피크 이용에 비해 마일당 수익성이 높습니다. 다이내믹 라이드 셰어링은 2025년 수익의 45.62%를 차지하고 여전히 볼륨 리더이지만, 효율적인 승객 매칭을 실현하는 도시의 밀집 네트워크를 활용하는 한편, 성장률은 프리미엄 법인층에 뒤처지고 있습니다.
대기업은 온실가스 삭감량의 엔드 투 엔드 보고와 자동 경비 정산 인터페이스를 중시합니다만, 이러한 기능은 소비자용 제품에서는 거의 제공되고 있지 않습니다. 법인 계약은 일반적으로 여러 해에 걸쳐 해지 위험이 낮으며 플랫폼은 운전자의 가동 시간과 차량의 전기화 요구를 더욱 정확하게 예측할 수 있습니다. 경쟁 차별화는 승차 단위의 카본 대시보드나 여행 관리 담당자와 실시간 여정 공유 등 안전 배려 기능의 통합에 초점을 맞추었습니다. 예측 기간 동안 동적 라이드 셰어링은 광범위한 잠재 고객 기반을 바탕으로 절대적인 수익을 계속 확대하는 반면, 쉐어 마이그레이션은 기업 수요가 세계 라이드 셰어링 시장의 안정화 요인이 되고 있음을 보여줍니다.
앱 중심 모델은 계속 주류이며 2025년 매출의 71.84%를 차지합니다. 푸시 알림, 수요 급증시 요금 상승 알림, 디지털 지갑의 편의성에서 모바일 인터페이스는 여전히 탁월한 존재이며 세계의 라이드 셰어링 시장에서 사용자 참여의 기반이 되고 있습니다. 그러나 기업용 여행 데스크와 접근성 규제로 브라우저 기반 예약이 요구되므로 하이브리드형 웹+앱 서비스가 15.05%의 연평균 복합 성장률(CAGR)로 가장 급속히 확대되고 있습니다.
통합 채널은 비스마트폰 사용자에게 도달범위를 늘리고 통신 환경이 불안정할 때 중복성을 제공합니다. 앱에 내장된 고객 서비스 AI는 Lyft에서 문제 해결 시간을 87% 단축하고 담당자를 복잡한 케이스 대응에 전념하고 있습니다. 반면에 웹 포털은 이벤트 및 회의용 일괄 예약을 허용하지만, 이는 모바일 앱에 없는 기능입니다. 옴니채널 액세스가 필수 조건이 되는 가운데, 디바이스 간 코드베이스를 간소화하는 플랫폼은 유지 보수 비용을 절감하고 기능 배치를 가속화하여 세계의 라이드 셰어링 시장에서 브랜드 선호를 강화합니다.
지역별 분석
2025년 아시아태평양은 인구 밀도가 높고 자동차 소유율이 낮고 공유 모빌리티에 대한 정책 지원을 배경으로 세계 라이드 셰어링 시장의 37.48%를 차지했습니다. DiDi의 2025년 1분기에 8.5%의 수익 증가는 중국에서 규제 후 회복력을 뒷받침합니다. 인도에서는 Ola가 2023년 손실을 65% 줄였으며 수요가 급증하면서 지속 가능한 수익성을 달성했습니다. 5G의 보급률이 높고 디지털 월렛의 보급으로 플랫폼은 고급 안전 기능과 로열티 기능을 추가할 수 있어 대도시권에서 지방도시에 이르는 네트워크 효과를 강화하고 있습니다.
아프리카는 도시로의 인구 이동과 모바일 머니의 보급을 원동력으로 16.55%의 연평균 복합 성장률(CAGR)로 가장 빠른 성장 궤도를 기록했습니다. 볼트사가 대륙 전체에 5억 유로를 투자하는 정책은 이 지역이 전 세계 사업자에게 전략적 우선 지역임을 보여줍니다. 나이로비, 라고스, 요하네스버그는 젊은 인구가 급속한 보급을 촉진하고 초기 혜택을 받고 있습니다. 그러나 불안정한 도로 인프라와 전력 공급의 신뢰성이 운영상의 과제가 되고 있으며, 각 플랫폼은 지역 밀착형의 드라이버 지원 거점이나 오프라인 예약 키오스크를 통해 대응하고 있습니다.
북미와 유럽에서는 기술 혁신과 법인용 프로그램을 원동력으로 성숙한 시장이면서 점진적인 성장을 볼 수 있습니다. 우버와 웨이모의 제휴로 애틀랜타와 오스틴에서 주 25만회의 자율주행 서비스 제공이 시작되어 운전자 비용 절감의 획기적인 한 걸음이 되었습니다. 2026년 12월 시행 예정인 EU 플랫폼 노동자 지령은 복리 후생의 표준화를 요구하고 소규모 앱 사업자에게 컴플라이언스 장벽을 높일 것입니다. 업계 재편은 가속화되고 있으며, Lyft에 의한 FREENOW 인수가 유럽 전개를 9개 시장으로 확대한 사례가 현저합니다. 규제의 명확화와 높은 가처분 소득이 양 지역에서의 지속적(그러나 완만한) 이용 확대를 지지해, 세계의 라이드 셰어링 시장에 있어서의 핵심적인 수익원으로서의 지위를 유지하고 있습니다.
기타 혜택 :
- 엑셀 형식 시장 예측(ME) 시트
- 애널리스트 서포트(3개월간)
자주 묻는 질문
목차
제1장 서론
- 조사의 전제조건과 시장의 정의
- 조사 범위
제2장 조사 방법
제3장 주요 요약
제4장 시장 인사이트
- 시장 개요
- 업계의 매력도 - Porter's Five Forces 분석
- 공급기업의 협상력
- 소비자의 협상력
- 신규 참가업체의 위협
- 대체품의 위협
- 경쟁 기업간 경쟁 관계
- 업계 밸류체인 분석
- 거시 경제 동향이 시장에 미치는 영향
- 기술적 진전
제5장 시장 역학
- 시장 성장 촉진요인
- 카풀 및 기업 전용 풀링(Corporate Pooling) 서비스의 비용 이점과 가용성 확대
- 주요 시장의 정부에 의한 인센티브와 리베이트
- 차량 소유 비용 증가와 환경면에서의 이점
- 시장의 과제
- 라스트 마일 연결성 우려, 업계의 역동적인 성질, 차량 호출(Ride-hailing) 업체 증가에 따른 기존 사업자의 위기
- 시장 기회
- 카셰어링 규제 기준
- 비즈니스/수익 모델의 이용 사례
제6장 시장 세분화
- 회원 유형별
- 고정 라이드 셰어링 시장
- 다이나믹 라이드 셰어링 시장
- 법인용 라이드 셰어링 시장
- 서비스 유형별
- 웹 기반
- 앱 기반
- 웹 및 앱 기반
- 지역별
- 북미
- 유럽
- 아시아
- 호주 및 뉴질랜드
- 라틴아메리카
- 중동 및 아프리카
제7장 경쟁 구도
- 기업 프로파일
- OmniRide(Potomac and Rappahannock Transportation Commission)
- Kangaride
- Plante Covoiturage Inc./CarpoolWorld Inc.
- Via Transportation Inc.
- Ridesharing.com(COVOITURAGEMONTREAL Inc.)
- Scoop Commute Inc.(Spacer Technologies)
- BlaBlaCar(Comuto SA)
- KINTO Join Limited(TOYOTA MOTOR CORPORATION)
- GoMore ApS
- Hitch Technologies Inc.
- Liftshare(Mobilityways Limited)
- gobyRIDE(RideShark Corporation)
- Sameride LLC
- Carma Technology Corporation
- Enterprise Holdings Inc.
- 벤더의 시장 포지셔닝 in Ridesharing Business Models
제8장 투자 분석
제9장 시장 전망
SHW 26.01.26The ridesharing market is expected to grow from USD 53.02 billion in 2025 to USD 58.99 billion in 2026 and is forecast to reach USD 100.52 billion by 2031 at 11.26% CAGR over 2026-2031.
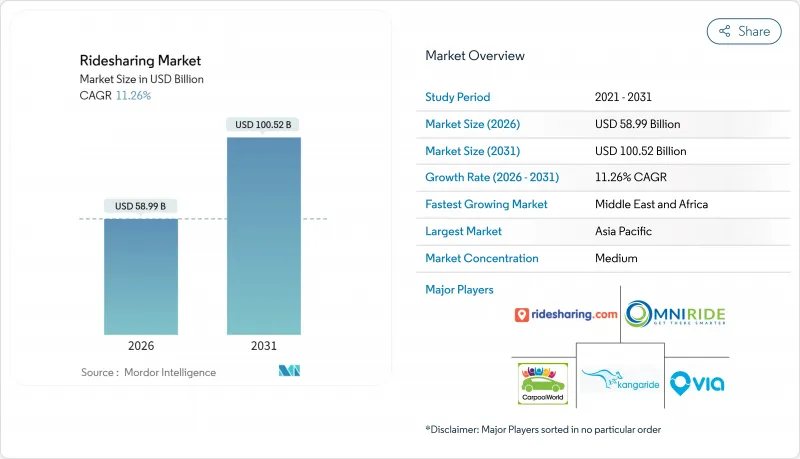
Rising smartphone adoption, the spread of 5G, corporate sustainability mandates, and supportive policy measures such as congestion pricing are reinforcing demand. Platform-led electrification of driver fleets is lowering per-mile economics while super-apps bundle scooters, bikes, and transit tickets to lift user retention. Fragmented but consolidating competitive dynamics favour operators that secure autonomous-vehicle partnerships and enterprise contracts. Regulatory clarity on worker classification and data localization will remain a decisive growth moderator as platforms scale across borders.
Global Ridesharing Market Trends and Insights
Rise of Super-Apps Integrating Micromobility
Platforms are widening their service mix to include scooters and bikes within the same interface, creating network effects that cut customer-acquisition costs and lengthen lifetime value. Lyft's app users can now rent scooters and Citi Bikes, completing 45 million rides across 35,000 bikes in 2024. Cities such as San Francisco have rolled out unified permits that let one operator serve multiple modes, simplifying compliance. The shift boosts trip frequency, especially for journeys under two miles, where cars are less efficient. Because users stay inside a single app, cross-selling rates on higher-margin car trips improve. The strategy also buffers operators against regulatory shocks in any one segment.
Growing Corporate Sustainability Mandates
Enterprises are embedding ridesharing into Scope-3 emission plans, replacing taxis and rental cars with pooled trips that cut per-employee carbon footprints. Large U.S. banks and tech firms now reimburse only shared rides for airport transfers, creating predictable weekday demand spikes. Dedicated business dashboards offer carbon tracking, automated billing, and policy controls, positioning corporate ridesharing well for double-digit expansion over the forecast period. Steady enterprise volumes cushion seasonality, improve driver earnings, and raise platform valuation multiples.
Increasing Regulatory Caps on Drivers and Surge Pricing
Minimum-wage ordinances in U.S. cities are pushing platforms to trim driver pools or raise fares. Minneapolis mandated USD 15 per driver hour in 2024, triggering temporary ride suspensions by leading platforms while they recalibrated pricing models. Restrictions on surge multipliers dampen supply elasticity during peak demand, elongating wait times and eroding user satisfaction.
Other drivers and restraints analyzed in the detailed report include:
- Urban Congestion Pricing and Curbside Reform
- High Smartphone and 5G Penetration in Emerging Economies
- Safety-Related Brand Perception Issues
For complete list of drivers and restraints, kindly check the Table Of Contents.
Segment Analysis
Corporate customers are reshaping the global ridesharing market as firms formalize travel policies that prioritize low-carbon, pooled mobility. The corporate segment is on an 17.85% CAGR path to 2031, steadily enlarging its slice of the global ridesharing market size. Enterprise bookings often occur during business-day peaks, yielding higher per-mile yields than consumer off-peak trips. Dynamic ridesharing, still the volume leader with 45.62% of 2025 revenue, benefits from dense urban networks that match riders efficiently, but its growth rate now lags the premium corporate tier.
Large companies value end-to-end reporting of greenhouse-gas savings and automatic expensing interfaces, capabilities that consumer-focused products rarely offer. As corporate contracts typically run multi-year, churn risk is lower, allowing platforms to forecast driver hours and fleet electrification needs with greater accuracy. Competitive differentiation pivots on integrating ride-level carbon dashboards and duty-of-care features like real-time itinerary sharing with travel managers. Over the forecast period, dynamic ridesharing will keep enlarging absolute revenue given its broad addressable base, yet the share shift underscores how enterprise demand is becoming a stabilizing anchor for the global ridesharing market.
App-centric models continue to dominate, capturing 71.84% of 2025 turnover. The mobile interface remains unrivalled for push notifications, surge alerts, and digital-wallet convenience, anchoring user engagement in the global ridesharing market. Nonetheless, hybrid web-plus-app services are expanding fastest at 15.05% CAGR because corporate travel desks and accessibility regulations require browser-based booking.
Integrated channels broaden reach to non-smartphone users and offer redundancy when cellular data is spotty. Customer-service AI embedded in apps cut resolution times by 87% for Lyft, freeing agents for complex cases. Web portals, meanwhile, allow batch booking for events and conferences, a capability mobile apps lack. As omnichannel access becomes table stakes, platforms that streamline code bases across devices will curb maintenance costs and speed feature deployment, reinforcing brand preference in the global ridesharing market.
The Global Ridesharing Market Report is Segmented by Membership Type (Fixed, Dynamic, Corporate), Service Type (Web-Based, App-Based, Web and App-Based), Vehicle Type (ICE Vehicle, Hybrid Vehicle, Electric Vehicle, Micro-Mobility), Trip Distance (Intracity, Intercity), Payment Mode (Cash, Card, Digital Wallets), and Geography. The Market Forecasts are Provided in Terms of Value (USD).
Geography Analysis
Asia-Pacific's 37.48% share anchored the global ridesharing market in 2025, supported by population density, low car ownership, and policymaker support for shared mobility. DiDi's Q1 2025 rebound, with revenue up 8.5%, affirmed post-regulation resilience in China. India followed with Ola trimming FY23 losses by 65%, achieving sustainable profitability amid surging demand. High 5G penetration and digital-wallet ubiquity enable platforms to overlay advanced safety and loyalty features, strengthening network effects across megacities and Tier-2 towns.
Africa posted the fastest trajectory, projected at 16.55% CAGR, propelled by urban migration and mobile-money ubiquity. Bolt's commitment to invest EUR 500 million across the continent underscores the region's strategic priority for global operators. Nairobi, Lagos, and Johannesburg are early beneficiaries, with young demographics fostering rapid uptake. Nonetheless, inconsistent road infrastructure and electricity reliability pose operational challenges that platforms address through localized driver-support hubs and offline booking kiosks.
North America and Europe display mature yet incremental growth driven by technological upgrades and corporate programs. Uber's tie-up with Waymo began offering 250,000 weekly autonomous rides in Atlanta and Austin, a milestone that trims driver-cost overheads. The EU's Platform Worker Directive, effective December 2026, will standardize benefits, elevating compliance barriers for smaller apps. Consolidation is intensifying, exemplified by Lyft's purchase of FREENOW that enlarged its European reach to nine markets. Regulatory certainty plus high disposable incomes underpins sustained, if moderate, volume expansion in both regions, keeping them pivotal revenue pools within the global ridesharing market.
- OmniRide (Potomac and Rappahannock Transportation Commission)
- Kangaride
- Plante Covoiturage Inc./CarpoolWorld Inc.
- Via Transportation Inc.
- Ridesharing.com (COVOITURAGEMONTREAL Inc.)
- Scoop Commute Inc. (Spacer Technologies)
- BlaBlaCar (Comuto SA)
- KINTO Join Limited (TOYOTA MOTOR CORPORATION)
- GoMore ApS
- Hitch Technologies Inc.
- Liftshare (Mobilityways Limited)
- gobyRIDE (RideShark Corporation)
- Sameride LLC
- Carma Technology Corporation
- Enterprise Holdings Inc.
Additional Benefits:
- The market estimate (ME) sheet in Excel format
- 3 months of analyst support
TABLE OF CONTENTS
1 INTRODUCTION
- 1.1 Study Assumptions and Market Definition
- 1.2 Scope of the Study
2 RESEARCH METHODOLOGY
3 EXECUTIVE SUMMARY
4 MARKET INSIGHTS
- 4.1 Market Overview
- 4.2 Industry Attractiveness - Porter's Five Forces Analysis
- 4.2.1 Bargaining Power of Suppliers
- 4.2.2 Bargaining Power of Consumers
- 4.2.3 Threat of New Entrants
- 4.2.4 Threat of Substitute Products
- 4.2.5 Intensity of Competitive Rivalry
- 4.3 Industry Value Chain Analysis
- 4.4 Impact of Macroeconomic Trends on the Market
- 4.5 Technological Developments
5 MARKET DYNAMICS
- 5.1 Market Drivers
- 5.1.1 Cost Advantage and Increasing Availability of Carpooling/Corporate Pooling Services
- 5.1.2 Incentives and Rebates Provided by Governments in Major Markets
- 5.1.3 Increasing Cost of Vehicle Ownership and Environmental Benefits
- 5.2 Market Challenges
- 5.2.1 Last-mile Connectivity Concerns and Dynamic Nature of the Industry and Increasing Number of Ride Hailing Vendors Poses a Challenge for Existing Operators
- 5.3 Market Opportunties
- 5.4 Parameters for Car-sharing Regulation
- 5.5 Business/Revenue Model Use Cases
6 MARKET SEGMENTATION
- 6.1 By Membership Type
- 6.1.1 Fixed Ridesharing
- 6.1.2 Dynamic Ridesharing
- 6.1.3 Corporate Ridesharing
- 6.2 By Service Type
- 6.2.1 Web-Based
- 6.2.2 App-Based
- 6.2.3 Web and App Based
- 6.3 By Geography
- 6.3.1 North America
- 6.3.2 Europe
- 6.3.3 Asia
- 6.3.4 Australia and New Zealand
- 6.3.5 Latin America
- 6.3.6 Middle East and Africa
7 COMPETITIVE LANDSCAPE
- 7.1 Company Profiles
- 7.1.1 OmniRide (Potomac and Rappahannock Transportation Commission)
- 7.1.2 Kangaride
- 7.1.3 Plante Covoiturage Inc./CarpoolWorld Inc.
- 7.1.4 Via Transportation Inc.
- 7.1.5 Ridesharing.com (COVOITURAGEMONTREAL Inc.)
- 7.1.6 Scoop Commute Inc. (Spacer Technologies)
- 7.1.7 BlaBlaCar (Comuto SA)
- 7.1.8 KINTO Join Limited (TOYOTA MOTOR CORPORATION)
- 7.1.9 GoMore ApS
- 7.1.10 Hitch Technologies Inc.
- 7.1.11 Liftshare (Mobilityways Limited)
- 7.1.12 gobyRIDE (RideShark Corporation)
- 7.1.13 Sameride LLC
- 7.1.14 Carma Technology Corporation
- 7.1.15 Enterprise Holdings Inc.
- 7.2 Market Positioning of Vendors in Ridesharing Business Models
