


|
시장보고서
상품코드
1910439
해사 분석 시장 : 점유율 분석, 업계 동향, 통계, 성장 예측(2026-2031년)Maritime Analytics - Market Share Analysis, Industry Trends & Statistics, Growth Forecasts (2026 - 2031) |
||||||
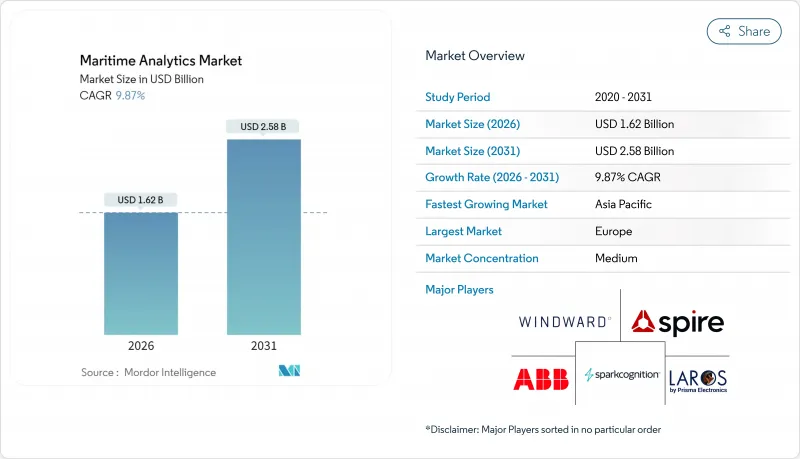
해사 분석 시장은 2025년 14억 7,000만 달러로 평가되었고 2026년에는 16억 2,000만 달러, 2026년부터 2031년에 걸쳐 CAGR 9.87%로 성장하고 2031년까지 25억 8,000만 달러에 달할 것으로 예측되고 있습니다.
연료 효율에 대한 규제 요건, 변동하는 연료 가격, 데이터 구동 선박 관리로의 급속한 전환이 이러한 확장의 주요 촉진요인입니다. 상시 접속된 선박통신망에 인공지능을 조합함으로써 예측보전, 동적항로 최적화, 배출가스 감시가 거의 실시간으로 가능해져 이익률 향상과 컴플라이언스 리스크의 저감을 도모하고 있습니다. 2024년에 사로닉사가 조달한 6억 달러 등 벤처 캐피탈의 유입으로 제품 혁신과 상업화의 타임라인이 가속화되고 있습니다. 한편, 해저 케이블에 영향을 미치는 사이버 보안 사고는 대규모 분석을 지원하면서 민감한 운영 데이터를 보호할 수 있는 안전한 데이터 아키텍처에 대한 필요성이 커지고 있다는 점을 강조하고 있습니다.
세계 해사 분석 시장 동향과 인사이트
해상무역 증가
선대의 디지털화는 전환점에 도달했고 경쟁 우위는 기존의 운영 지표보다 데이터 통합 능력에 의존하는 경향이 커지고 있습니다. 싱가포르가 도입한 차세대 선박교통관리시스템은 충돌 예측과 교통 최적화에 인공지능을 활용하고 있으며, 해사당국이 안전성과 효율성 향상을 위해 분석기술을 활용하는 실례를 보여줍니다. 주요 해운회사는 현재 항만운영을 위한 종합적인 디지털 트윈을 도입하고 있으며, 주롱항 사례에서는 터미널 운영 전체의 실시간 감시와 예측 분석을 실현하고 있습니다. 통합 플랫폼으로의 전환은 MSC의 500척의 선대 전체에 도입된 Kongsberg Digital의 'Vessel Insight'가 보여주는 대로 성능 최적화와 배출 가스 모니터링을 위한 통일된 분석 기능을 제공합니다. 노르웨이의 국가 디지털화 전략은 2030년까지 세계 최고 수준의 디지털화 국가를 목표로 하는 가운데 특히 데이터 공유의 강화와 AI 도입에 의한 해사 섹터의 변화를 중시하고 있습니다. 이 디지털화의 물결은 대규모 사업자에 그치지 않고 중소선대도 클라우드 기반의 분석 솔루션을 채택하여 데이터 주도형 시장에서 효과적으로 경쟁할 수 있게 되었습니다.
연료 효율과 배출 규제에 대한 대응을 촉진하는 규제 동향
국제해사기관(IMO)이 2025년 8월부터 시행하는 강화된 데이터 수집 요건은 연료소비량과 운송작업에 대한 상세한 보고가 의무화되어 해운회사의 성능감시방법을 근본적으로 변화시킵니다. 이러한 규제는 단순한 컴플라이언스를 넘어 우수한 분석 능력을 가진 운항자에게 경쟁적 차별화 기회를 제공하여 연료 효율 최적화 및 환경 관리 실천을 가능하게 합니다. 2025년에 시행되는 FuelEU Maritime 규정(EU 수역 운항 선박에 대한 저탄소 연료 채택 의무)은 연료 선택과 항로 결정을 최적화하는 예측 분석 솔루션 수요를 가속화하고 있습니다. 신조선을 위한 에너지 효율 설계 지수(EEDI) 3단계 요건은 조선소가 설계 단계부터 고급 분석 시스템을 통합하도록 촉구하고 임베디드 솔루션의 새로운 시장 기회를 창출하고 있습니다. 카고메트릭스가 2024년 3월에 발표한 세계의 해운 배출량 데이터 제품은 분석 제공업체가 복잡한 규제 상황을 운항자가 극복하기 위한 전문 솔루션을 개발하고 있는 예입니다. 2024년 1월부터 디지털 정보 교환 플랫폼을 의무화하는 해양 싱글 윈도우 시스템은 데이터 흐름을 표준화하고 보다 정교한 월경 분석 용도를 가능하게 했습니다.
높은 구현 및 통합 비용
해사 분석 시스템의 도입에는 많은 자본이 필요하며 소규모 운항 사업자에게는 큰 장벽이 되고 있습니다. 종합적인 시스템의 경우 복잡성과 통합 요구 사항에 따라 선박 척당 50만 달러에서 500만 달러의 투자가 필요합니다. 레거시 시스템의 통합 과제는 이러한 비용을 더욱 증가시킵니다. 운항사업자는 이행기간 중 업무의 연속성을 확보하면서 병행시스템을 유지해야 하는 경우가 많기 때문입니다. 엔진 관리 시스템에서 화물 취급 설비에 이르기까지 여러 데이터 소스를 통합하는 복잡성은 전문 지식과 맞춤형 개발 작업을 필요로 하며 도입 기간과 비용을 크게 증가시킵니다. 그러나 클라우드 기반 배포 모델은 비용 장벽을 해결하기 위해 노력하고 있으며, SaaS(Software-as-a-Service) 솔루션은 초기 자본 요구 사항을 줄이고 확장 가능한 배포를 가능하게 합니다. 모듈형 분석 플랫폼의 출현으로 사업자는 단계적으로 솔루션을 도입할 수 있어 완전한 도입 전에 가치를 입증하면서 비용을 장기간 분산할 수 있게 되었습니다.
부문 분석
예측 보전 및 처방적 보전은 2025년 해사 분석 시장 점유율의 29.74%를 차지했으며, 대형 컨테이너 선박의 경우 하루에 20만 달러를 초과할 수 있는 예기치 않은 가동 중지 시간을 피할 가치를 뒷받침합니다. 화물 및 공급망 해사 분석 시장 규모는 니어 쇼어링, 납기 엄수의 강화, 통관 상황의 리얼타임 가시화를 원동력으로서, 2026년부터 2031년에 걸쳐 CAGR2.78%로 확대할 것으로 예측되고 있습니다. 사업자는 진동 센서와 서모그래피 센서를 클라우드 엔진에 연동시켜 고장 발생 몇 시간 전에 이상 패턴을 검지함으로써 예비 부품의 재고 삭감과 도킹 스케줄의 최적화를 실현하고 있습니다. 화물 분석 도구는 현재 IoT 데이터와 육상 철도의 운행 일정을 통합하고 항해 중 컨테이너 재 적재를 동적으로 가능하게 함으로써 항만에서의 턴어라운드 시간을 단축하고 있습니다.
전체 선대 대시보드는 연료 소비량, 선박 계약 준수 상황, 배출 가스 데이터를 통합하고 합의된 임계값을 초과할 경우 경고를 생성합니다. 항해 최적화 모듈은 터미널 측 시스템과의 데이터 공유를 확대하여 도착 슬롯과 버스 이용 가능 여부를 조정합니다. 안전 및 컴플라이언스 분석은 브리지 카메라의 기계 시각 기술을 활용하여 브리지 리소스 관리 프로토콜을 철저히 제공합니다. 플랫폼 공급업체가 이러한 기능을 통합 사용자 인터페이스에 번들링하는 동안 선주는 단독 툴보다 통합 제품군을 선호하고 조달 주기와 서비스 계약을 통합합니다.
2025년에는 상업항로가 세계 지출의 52.95%를 차지했고 규제가 허용하는 범위에서 속도를 ±1노트 삭감하는 분석을 활용하여 스케줄 연장 없이 연료 소비를 삭감했습니다. 항만 및 터미널 사업자용 해사 분석 시장 규모는 크레인, 야드 트랙터, 게이트 시스템이 실시간 가동 상황을 AI 엔진에 공급해, 체류 최소화를 위한 작업 순서를 자동화하는 것으로, CAGR 2.98%로 확대가 전망됩니다. 방위기관은 영역 인식에 주력하고 위성 이미지와 AIS 위장 감지 알고리즘을 융합시켜 해상 항로의 안전 확보를 도모하고 있습니다.
싱가포르 투아스 메가포트의 자동 적재 크레인은 머신러닝을 통한 스케줄링으로 헥타르당 처리 능력을 향상시키는 항구측 수요를 보여줍니다. 해상 에너지 사업자는 구조 피로를 감시하기 위해 부체식 생산 설비의 디지털 트윈 모델과 분석을 통합하고 있으며, 이 기능은 현재 일부 선적국에서 의무화되고 있습니다. 컨테이너 운송의 단위 경제성이 엄격해지는 가운데 이사회는 18개월 이내의 투자회수 기준으로 분석예산을 승인하고 톱 10 해운회사에서 SaaS 도입을 가속화하고 있습니다.
지역별 분석
유럽은 2025년 수익의 27.35%를 유지하며 엄격한 배출 규제와 디지털 해상 회랑에 대한 공적 자금이 기반이 되고 있습니다. 노르웨이는 2030년까지 전선대에서의 완전한 데이터 공유를 목표로 하는 정책에 따라 파일럿에서 선대로의 전개 스케줄이 급속히 진행되고 있습니다. 네덜란드는 수소 대응 항만 분석 기술에 투자하고 독일의 함부르크 항에서는 AI에 의한 버스 할당 엔진의 시험 운용이 이루어져 대기 시간을 12% 삭감하고 있습니다.
아시아태평양은 2031년까지 연평균 복합 성장률(CAGR) 3.74%로 가장 빠르게 성장할 지역으로, 중국의 메가 항만 업그레이드와 싱가포르의 엔드 투 엔드 디지털 OCEANS 데이터 교환 기반이 견인하고 있습니다. 일본은 안전 사례를 충족하기 위한 실시간 분석에 의존하는 자율 선박 프로그램을 추진하는 반면 호주는 필바라에서 동북아까지 벌크 상품 경로 최적화에 주력하고 있습니다. 이 지역의 해사 분석 시장 규모는 높은 컨테이너 유통량과 초기 통합 비용을 상쇄하는 정부 보조금에 의해 혜택을 받고 있습니다.
북미에서는 탈탄소화와 방위 수요를 배경으로 도입이 꾸준히 진행되고 있습니다. 미국 해군과 해안 경비대가 자금 제공하는 AI 감시 시스템은 어업과 해상 풍력 발전 물류 분야에도 상용화가 진행되고 있습니다. 남미에서는 민영화가 진행되는 브라질 산토스 항과 칠레 발파라이소 항에서 초기 단계의 프로젝트가 싹트고 있습니다. 중동의 제벨 알리 항등의 허브에서는 픽업 급증에 대응하는 스마트 항만 대시보드를 도입. 한편 아프리카의 게이트웨이 항구에서는 화물량 증가에 따라 기본적인 AIS 기반 분석 기술을 채택하고 있습니다. 지역별 도입 상황에는 편차가 보입니다만, 조화된 데이터 표준에 의해 국경을 넘은 연계가 가능해져, 규모 확대가 가속하고 있습니다.
기타 혜택 :
- 엑셀 형식 시장 예측(ME) 시트
- 애널리스트에 의한 3개월간의 지원
자주 묻는 질문
목차
제1장 서론
- 조사의 전제조건과 시장의 정의
- 조사 범위
제2장 조사 방법
제3장 주요 요약
제4장 시장 상황
- 시장 개요
- 시장 성장 촉진요인
- 세계의 선대에 있어서의 디지털화의 진전
- 해상무역량 확대
- IoT 및 선박 연결 기술의 보급 확대
- 연료 효율과 배출 가스 규제에의 적합을 추진하는 규제 동향
- AI에 의한 항로 최적화에 의한 연료비 삭감(저평가 요인)
- 해사기술 스타트업에의 벤처캐피탈 유입(저평가 요인)
- 시장 성장 억제요인
- 높은 도입 및 통합 비용
- 레거시 시스템 간의 데이터 표준화 부족
- 접속선박에 있어서의 사이버 보안상의 취약성(저평가 요인)
- 분석 스킬을 가지는 해사 인재의 부족(저평가 요인)
- 가치/공급망 분석
- 규제 상황
- 기술의 전망
- Porter's Five Forces 분석
- 신규 참가업체의 위협
- 구매자의 협상력
- 공급기업의 협상력
- 대체품의 위협
- 경쟁 기업간 경쟁 관계
제5장 시장 규모와 성장 예측
- 용도별
- 예측보전 및 처방보전
- 항로 최적화 및 루트 계획
- 선단 및 자산 관리
- 화물 및 공급망 분석
- 안전성 및 컴플라이언스 분석
- 최종 사용자별
- 상선회사
- 정부 및 방위
- 항만 및 터미널 운영 사업자
- 해외 및 에너지
- 전개 모드별
- 클라우드
- On-Premise
- 하이브리드
- 컴포넌트별
- 소프트웨어 플랫폼
- 서비스(컨설팅, 통합, 지원)
- 분석 유형별
- 기술적 분석
- 예측 분석
- 처방 분석
- 지역별
- 북미
- 미국
- 캐나다
- 남미
- 브라질
- 기타 남미
- 유럽
- 독일
- 영국
- 프랑스
- 스페인
- 이탈리아
- 기타 유럽
- 아시아태평양
- 중국
- 일본
- 한국
- 인도
- 기타 아시아태평양
- 중동
- 아랍에미리트(UAE)
- 사우디아라비아
- 기타 중동
- 아프리카
- 남아프리카
- 나이지리아
- 기타 아프리카
- 북미
제6장 경쟁 구도
- 시장 집중도
- 전략적 동향
- 시장 점유율 분석
- 기업 프로파일
- ABB Ltd.
- Amplify Mindware Private Ltd.
- BunkerMetric ApS
- Inmarsat Global Ltd.
- Kongsberg Digital AS
- Lloyd's List Intelligence(Informa PLC)
- MarineTraffic(Kpler Holding SA)
- Nautilus Labs, Inc.
- Navis LLC(Kaleris, Inc.)
- OrbitMI, Inc.
- Prisma Electronics SA(LAROS)
- Progen Business Solutions Pvt. Ltd.
- RightShip Pty Ltd.
- SparkCognition, Inc.
- Spire Global, Inc.
- U-Ming Marine Transport Corp.
- Wartsila Oyj Abp
- Windward Ltd.
- Xeneta AS
- exactEarth Ltd.(A Spire Company)
제7장 시장 기회와 장래의 전망
SHW 26.01.26The maritime analytics market is expected to grow from USD 1.47 billion in 2025 to USD 1.62 billion in 2026 and is forecast to reach USD 2.58 billion by 2031 at 9.87% CAGR over 2026-2031.
Regulatory mandates on fuel efficiency, volatile bunker prices, and a rapid pivot toward data-driven fleet management are the primary catalysts of this expansion. Artificial intelligence layered onto always-on vessel connectivity now enables predictive maintenance, dynamic route optimization, and emissions monitoring in near real time, tightening profit margins and reducing compliance risk. Venture capital flows, such as the USD 600 million raised by Saronic in 2024, have accelerated product innovation and commercialization timelines. Meanwhile, cybersecurity incidents affecting subsea cables underscore an emerging need for secure data architectures that can protect sensitive operational data while supporting analytics at scale.
Global Maritime Analytics Market Trends and Insights
Increase in Seaborne Trade
Fleet digitization has reached a tipping point where competitive advantage increasingly depends on data integration capabilities rather than traditional operational metrics. The implementation of Singapore's Next Generation Vessel Traffic Management System, utilizing artificial intelligence for collision prediction and traffic optimization, demonstrates how maritime authorities are leveraging analytics to enhance safety and efficiency. Major shipping lines are now deploying comprehensive digital twins for port operations, with Jurong Port's implementation enabling real-time monitoring and predictive analytics across terminal operations. The shift toward integrated platforms is evidenced by Kongsberg Digital's Vessel Insight deployment across MSC's 500-vessel fleet, providing unified analytics for performance optimization and emissions monitoring. Norway's national digitalization strategy, targeting the most digitalized country status by 2030, specifically emphasizes maritime sector transformation through enhanced data sharing and AI implementation. This digitization wave extends beyond large operators, with smaller fleets adopting cloud-based analytics solutions to compete effectively in increasingly data-driven markets.
Regulatory Push for Fuel-Efficiency and Emissions Compliance
The International Maritime Organization's enhanced data collection requirements, effective from August 2025, mandate granular reporting of fuel consumption and transport work, fundamentally altering how shipping companies approach performance monitoring. These regulations extend beyond simple compliance, creating competitive differentiation opportunities for operators with superior analytics capabilities to optimize fuel efficiency and demonstrate environmental stewardship. The implementation of FuelEU Maritime regulations in 2025, requiring low-carbon fuel adoption for vessels operating in EU waters, has accelerated demand for predictive analytics solutions that can optimize fuel selection and routing decisions. The Energy Efficiency Design Index Phase 3 requirements for new vessels have prompted shipbuilders to integrate advanced analytics systems from the design stage, creating new market opportunities for embedded solutions. CargoMetrics' launch of global maritime emissions data products in March 2024 illustrates how analytics providers are developing specialized solutions to help operators navigate complex regulatory landscapes. The Maritime Single Window mandate, requiring digital information exchange platforms since January 2024, has standardized data flows and enabled more sophisticated cross-border analytics applications.
High Implementation and Integration Costs
The capital-intensive nature of maritime analytics implementations creates significant barriers for smaller operators, with comprehensive systems requiring investments ranging from USD 500,000 to USD 5 million per vessel depending on complexity and integration requirements. Legacy system integration challenges compound these costs, as operators must often maintain parallel systems during transition periods while ensuring operational continuity. The complexity of integrating multiple data sources, from engine management systems to cargo handling equipment, requires specialized expertise and custom development work that significantly increases implementation timelines and costs. However, cloud-based deployment models are beginning to address cost barriers, with software-as-a-service solutions reducing upfront capital requirements and enabling scalable implementations. The emergence of modular analytics platforms allows operators to implement solutions incrementally, spreading costs over longer periods while demonstrating value before full deployment.
Other drivers and restraints analyzed in the detailed report include:
- Growing Adoption of IoT and Vessel Connectivity
- AI-Driven Route Optimization Reducing Bunker Spend
- Cyber-Security Vulnerabilities in Connected Vessels
For complete list of drivers and restraints, kindly check the Table Of Contents.
Segment Analysis
Predictive and prescriptive maintenance represented 29.74% of maritime analytics market share in 2025, underscoring the value of avoiding unplanned downtime that can exceed USD 200,000 per day for large containerships. The maritime analytics market size for cargo and supply-chain applications is forecast to expand at a 2.78% CAGR between 2026-2031, propelled by near-shoring, tighter delivery windows, and real-time customs visibility. Operators deploy vibration and thermography sensors linked to cloud engines that flag abnormal patterns hours before failures occur, trimming spare-parts inventory and dry-dock schedules. Cargo analytics tools now blend IoT data with terrestrial rail schedules, allowing dynamic container re-stow during voyage for faster port turnaround.
Fleet-wide dashboards integrate bunker use, charter-party compliance, and emissions data, generating alerts when performance drifts beyond agreed thresholds. Voyage optimization modules increasingly share data with terminal side systems, aligning arrival slots with berth availability. Safety and compliance analytics use machine vision on bridge cameras to enforce bridge-resource-management protocols. As platform vendors bundle these capabilities into unified user interfaces, owners prefer integrated suites over stand-alone tools, consolidating procurement cycles and service contracts.
Commercial lines held 52.95% of global spending in 2025, leveraging analytics to shave +-1 knot from speed where regulations allow, thereby cutting fuel burn without lengthening schedules. The maritime analytics market size allocated to ports and terminal operators is projected to grow at a 2.98% CAGR as cranes, yard tractors, and gate systems feed live status to AI engines that sequence moves for minimal backlog. Defense agencies focus on domain awareness, fusing satellite imagery and AIS spoof-detection algorithms to secure sea lanes.
Automated stacking cranes at Singapore's Tuas Mega Port demonstrate port-side appetite for machine-learning-driven scheduling that raises throughput per hectare. Offshore energy operators integrate analytics with digital twin models of floating production units to monitor structural fatigue, a capability now mandated by some flag states. As unit economics tighten in container shipping, boards approve analytics budgets within 18-month payback criteria, accelerating SaaS uptake among top-10 carriers.
The Maritime Analytics Market Report is Segmented by Application (Predictive and Prescriptive Maintenance, and More), End-User (Commercial Shipping Lines, Government and Defense, and More), Deployment Mode (Cloud, On-Premise, Hybrid), Component (Software Platform, Services), Analytics Type (Descriptive Analytics, Predictive Analytics, Prescriptive Analytics), and Geography. The Market Forecasts are Provided in Terms of Value (USD).
Geography Analysis
Europe retained 27.35% of 2025 revenue, anchored by stringent emissions legislation and public-sector funding for digital maritime corridors. Norway's 2030 ambition for full data-sharing across its fleet drives rapid pilot-to-fleet rollout timelines. The Netherlands invests in hydrogen-ready port analytics, while Germany's Hamburg port pilots AI berth-allocation engines that reduce idle time by 12%.
Asia-Pacific is the fastest-growing region at a 3.74% CAGR to 2031, powered by mega-port upgrades in China and Singapore's end-to-end digital OCEANS data-exchange backbone. Japan pushes autonomous-ship programs that rely on live analytics to meet safety cases, whereas Australia focuses on bulk-commodity route optimization from Pilbara to Northeast Asia. The maritime analytics market size in the region benefits from high container flows and government subsidies that offset early-stage integration expenses.
North America registers steady adoption driven by decarbonization and defense. The U.S. Navy and Coast Guard fund AI surveillance grids that also commercialize into fisheries and offshore wind logistics. South America shows green-shoot projects in Brazil's Santos and Chile's Valparaiso ports amid privatization. Middle East hubs like Jebel Ali roll out smart-port dashboards to manage transshipment surges, whereas African gateways adopt basic AIS-based analytics as cargo volumes rise. Regional uptake remains uneven, but harmonized data standards are enabling cross-border collaborations that accelerate scale.
- ABB Ltd.
- Amplify Mindware Private Ltd.
- BunkerMetric ApS
- Inmarsat Global Ltd.
- Kongsberg Digital AS
- Lloyd's List Intelligence (Informa PLC)
- MarineTraffic (Kpler Holding SA)
- Nautilus Labs, Inc.
- Navis LLC (Kaleris, Inc.)
- OrbitMI, Inc.
- Prisma Electronics S.A. (LAROS)
- Progen Business Solutions Pvt. Ltd.
- RightShip Pty Ltd.
- SparkCognition, Inc.
- Spire Global, Inc.
- U-Ming Marine Transport Corp.
- Wartsila Oyj Abp
- Windward Ltd.
- Xeneta AS
- exactEarth Ltd. (A Spire Company)
Additional Benefits:
- The market estimate (ME) sheet in Excel format
- 3 months of analyst support
TABLE OF CONTENTS
1 INTRODUCTION
- 1.1 Study Assumptions and Market Definition
- 1.2 Scope of the Study
2 RESEARCH METHODOLOGY
3 EXECUTIVE SUMMARY
4 MARKET LANDSCAPE
- 4.1 Market Overview
- 4.2 Market Drivers
- 4.2.1 Rising digitization across global fleets
- 4.2.2 Expansion in seaborne trade volumes
- 4.2.3 Growing adoption of IoT and vessel connectivity
- 4.2.4 Regulatory push for fuel-efficiency and emissions compliance
- 4.2.5 AI-driven route optimisation reducing bunker spend (under-reported)
- 4.2.6 Venture capital inflow into maritime-tech start-ups (under-reported)
- 4.3 Market Restraints
- 4.3.1 High implementation and integration costs
- 4.3.2 Limited data standardisation across legacy systems
- 4.3.3 Cyber-security vulnerabilities in connected vessels (under-reported)
- 4.3.4 Shortage of analytics-skilled maritime workforce (under-reported)
- 4.4 Value / Supply-Chain Analysis
- 4.5 Regulatory Landscape
- 4.6 Technological Outlook
- 4.7 Porter's Five Forces Analysis
- 4.7.1 Threat of New Entrants
- 4.7.2 Bargaining Power of Buyers
- 4.7.3 Bargaining Power of Suppliers
- 4.7.4 Threat of Substitutes
- 4.7.5 Intensity of Competitive Rivalry
5 MARKET SIZE AND GROWTH FORECASTS (VALUE)
- 5.1 By Application
- 5.1.1 Predictive and Prescriptive Maintenance
- 5.1.2 Voyage Optimisation and Route Planning
- 5.1.3 Fleet and Asset Management
- 5.1.4 Cargo and Supply-chain Analytics
- 5.1.5 Safety and Compliance Analytics
- 5.2 By End-User
- 5.2.1 Commercial Shipping Lines
- 5.2.2 Government and Defense
- 5.2.3 Ports and Terminal Operators
- 5.2.4 Offshore and Energy
- 5.3 By Deployment Mode
- 5.3.1 Cloud
- 5.3.2 On-premise
- 5.3.3 Hybrid
- 5.4 By Component
- 5.4.1 Software Platform
- 5.4.2 Services (Consulting, Integration, Support)
- 5.5 By Analytics Type
- 5.5.1 Descriptive Analytics
- 5.5.2 Predictive Analytics
- 5.5.3 Prescriptive Analytics
- 5.6 By Geography
- 5.6.1 North America
- 5.6.1.1 United States
- 5.6.1.2 Canada
- 5.6.2 South America
- 5.6.2.1 Brazil
- 5.6.2.2 Rest of South America
- 5.6.3 Europe
- 5.6.3.1 Germany
- 5.6.3.2 United Kingdom
- 5.6.3.3 France
- 5.6.3.4 Spain
- 5.6.3.5 Italy
- 5.6.3.6 Rest of Europe
- 5.6.4 Asia-Pacific
- 5.6.4.1 China
- 5.6.4.2 Japan
- 5.6.4.3 South Korea
- 5.6.4.4 India
- 5.6.4.5 Rest of Asia-Pacific
- 5.6.5 Middle East
- 5.6.5.1 United Arab Emirates
- 5.6.5.2 Saudi Arabia
- 5.6.5.3 Rest of Middle East
- 5.6.6 Africa
- 5.6.6.1 South Africa
- 5.6.6.2 Nigeria
- 5.6.6.3 Rest of Africa
- 5.6.1 North America
6 COMPETITIVE LANDSCAPE
- 6.1 Market Concentration
- 6.2 Strategic Moves
- 6.3 Market Share Analysis
- 6.4 Company Profiles (includes Global level Overview, Market level Overview, Core Segments, Financials as available, Strategic Information, Market Rank/Share, Products and Services, Recent Developments)
- 6.4.1 ABB Ltd.
- 6.4.2 Amplify Mindware Private Ltd.
- 6.4.3 BunkerMetric ApS
- 6.4.4 Inmarsat Global Ltd.
- 6.4.5 Kongsberg Digital AS
- 6.4.6 Lloyd's List Intelligence (Informa PLC)
- 6.4.7 MarineTraffic (Kpler Holding SA)
- 6.4.8 Nautilus Labs, Inc.
- 6.4.9 Navis LLC (Kaleris, Inc.)
- 6.4.10 OrbitMI, Inc.
- 6.4.11 Prisma Electronics S.A. (LAROS)
- 6.4.12 Progen Business Solutions Pvt. Ltd.
- 6.4.13 RightShip Pty Ltd.
- 6.4.14 SparkCognition, Inc.
- 6.4.15 Spire Global, Inc.
- 6.4.16 U-Ming Marine Transport Corp.
- 6.4.17 Wartsila Oyj Abp
- 6.4.18 Windward Ltd.
- 6.4.19 Xeneta AS
- 6.4.20 exactEarth Ltd. (A Spire Company)
7 MARKET OPPORTUNITIES AND FUTURE OUTLOOK
- 7.1 White-space and Unmet-Need Assessment
