


|
시장보고서
상품코드
1910476
고성능 데이터 분석 : 시장 점유율 분석, 업계 동향 및 통계, 성장 예측(2026-2031년)High-Performance Data Analytics - Market Share Analysis, Industry Trends & Statistics, Growth Forecasts (2026 - 2031) |
||||||
고성능 데이터 분석 시장은 2025년 1,259억 9,000만 달러에서 2026년 1,526억 달러로 성장하고 2026년부터 2031년에 걸쳐 CAGR 21.12%를 나타낼 전망입니다. 2031년까지 3,981억 7,000만 달러에 달할 것으로 예상됩니다.
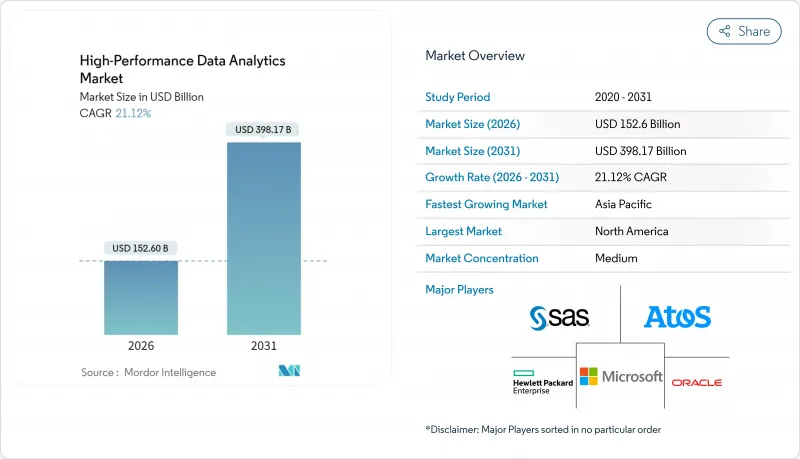
이 성장의 기세는 AI, 클라우드 컴퓨팅, 부풀어 오르는 기업 데이터의 양이라는 요소가 융합한 결과입니다. 금융 서비스는 안전한 거래 은행 업무에 실시간 부정 분석이 필수적인 가운데 주요 도입 분야로 계속되고 있습니다. 소프트웨어가 수익의 46.2%를 차지하고 있지만 전문적인 AI 컨설팅을 배경으로 서비스 분야가 가장 빠르게 확대되고 있습니다. 도입 형태에서는 On-Premise가 57.8%의 점유율로 현재 주도하고 있습니다만, 프로바이더가 세계의 GPU 용량을 확대하는 가운데, 클라우드 베이스 솔루션이 30.1%의 연평균 복합 성장률(CAGR)로 명백한 성장 엔진이 되고 있습니다. 지역별로는 북미가 35.4%의 점유율을 차지하지만, 아시아태평양은 광범위한 디지털 전환 계획에 의해 가장 급속한 성장이 전망되고 있습니다. 도입은 대기업이 주도하고 있습니다만, GPU 렌탈 요금의 급락에 의해 중소기업과의 차이가 줄어들고 있습니다. 예를 들어 H100 인스턴스의 시간당 USD 3.35의 요금은 하이퍼스케일러 정가를 90% 이상 밑돌고 있습니다.
세계의 고성능 데이터 분석 시장 동향 및 인사이트
BFSI 분야에서 사기 감지를 위한 실시간 분석 도입 가속화
금융기관에서는 소셜 엔지니어링 사기가 10배로 증가하여 디지털 뱅킹 사기의 23%를 차지하기에 이르렀기 때문에 고성능 사기 감지 엔진의 신속한 도입이 진행되고 있습니다. TD뱅크는 2024년 FICO 의사결정상 수상 후 전사적인 실시간 감시를 실현했습니다. AI 탑재 플랫폼은 1Gbps의 데이터 스트림을 지연없이 처리하면서 98.5%의 검출 정밀도를 달성하고 있습니다. 결과적으로 BFSI 기관은 평판과 재무 자본을 보호하기 위해 낮은 지연 분석을 결제 시스템, 신용 위험 점수 및 고객 확인(KYC)에 통합합니다. 이러한 도입은 고성능 데이터 분석 시장 전체의 CAGR을 5.2% 증가시키는 기반이 되었습니다.
페타바이트 규모의 데이터 처리가 필요한 AI/ML 모델 교육의 급증
생성형 AI 모델의 매개 변수 수는 반년마다 두 배로 증가했으며 페타바이트 규모의 데이터 수집과 엑사 스케일 계산 클러스터가 필요합니다. AI 워크로드와 관련된 하이퍼스케일 데이터센터에 대한 투자액은 2024년 1,627억 9,000만 달러에서 2030년까지 6,085억 4,000만 달러로 증가할 전망입니다. Microsoft 및 Google과 같은 공급업체는 차세대 AI 시설을 위해 총 1,550억 달러를 예산화하고 있습니다. 이 자본 지출은 분산 파일 시스템, 높은 처리량 상호 연결, 고급 스케줄링 소프트웨어에 대한 수요를 높여 시장 성장에 6.8%의 긍정적인 효과를 제공합니다.
전용 HPC 클러스터의 높은 총 소유 비용
데이터센터 건설에 대한 자본 지출은 2025년에 2,500억 달러 이상에 달했으며, 전력 수요가 확대됨에 따라 2030년까지 5,000억 달러가 추가됩니다. 많은 개발 도상국에서는 전력 부족에 직면하고 있으며, 이는 현지 HPC 시설의 출시를 방해하고 있습니다. 설비, 냉각, 숙련 직원의 인건비 등을 고려하면, 조직은 On-Premise 클러스터의 도입을 정당화하기 어렵고, 자원이 한정되어 있는 지역에서의 도입이 억제되어 전체 CAGR이 2.1% 저하하고 있습니다.
부문 분석
소프트웨어 부문은 2025년 수익의 45.78%를 차지했으며 사용자 친화적인 분석 엔진, 데이터 패브릭 계층 및 AI 오케스트레이션 도구에 대한 수요를 반영했습니다. 벤더 각사는 워크플로우 자동화와 피처 스토어 기능을 통합하여 사업부문 횡단에서의 모델 전개를 가속화하고 있습니다. DevOps 통합은 피드백 사이클을 단축하고 라이선스 구조도 가치 창출에 연동한 종량 과금제로 이행하고 있습니다. 하드웨어 판매는 기반 역할을 유지하고 있으며, NVIDIA Blackwell Ultra GPU 등 트랜스포머 워크로드용으로 고밀도 텐서 코어를 실현하는 실리콘 기술의 진보가 견인하고 있습니다.
서비스 분야는 가장 빠르게 확대되고 있으며, 2031년까지 연평균 복합 성장률(CAGR) 25.05%가 예상됩니다. 컨설팅 팀은 현재 데이터 전략 설계, MLOps 구현 및 지속적인 모델 튜닝 서비스를 패키징하고 복잡한 하이브리드 스택의 전문 지식 격차를 채우고 있습니다. 공급업체는 관리 기능 엔지니어링, 바이어스 감사, 페더레이티드 학습 오케스트레이션 등 AI-as-a-Service를 제공하기 시작했습니다. 이러한 변화는 대응 가능한 수요를 확대하고, 특히 최초의 기업 도입자층에서 서비스 계약을 위한 고성능 데이터 분석 시장 규모를 밀어 올리고 있습니다.
2025년 시점에서는 On-Premise 도입이 57.05%의 점유율을 차지했으며, 정부기관이나 은행 등 지연 시간과 주권 보호를 중시하는 섹터가 기반이 되었습니다. 조직 측은 하드웨어의 직접 제어와 엄격한 데이터 거주지 규정을 준수하는 것을 주요 동기로 꼽고 있습니다. 많은 기업들은 기존 데이터센터의 침몰 비용을 활용하여 클라우드로의 전이전이 아닌 노드 업데이트를 통한 가동률 최적화를 도모하고 있습니다.
클라우드 플랫폼은 탄력적인 스케일링, 종량 과금제, 세계의 엣지 존 배치에 의해 29.25%의 연평균 복합 성장률(CAGR)로 성장하고 있습니다. 공급업체는 규제 우려를 완화하기 위해 기밀 컴퓨팅 인스턴스와 주권 클라우드 리전을 확대하고 있습니다. 하이브리드 및 멀티클라우드 패턴은 새로운 프로젝트를 지배하고 있으며, 로컬 가속기와 AI 교육용 버스트 용량을 결합합니다. 이러한 전환은 소비 모델에 연결되는 고성능 데이터 분석 시장 규모를 확대하는 동시에 자원 제한이 있는 기업의 진입 장벽을 완화합니다.
지역별 분석
북미는 2025년 하이퍼스케일러의 깊은 발자취와 기업용 AI의 조기 도입에 힘입어 34.85%의 수익 점유율을 유지했습니다. 미국 데이터센터 공급량은 전년 대비 26% 증가한 5.2GW에 달하고, 급증하는 AI 추론 수요에 대응했습니다. TD은행 등 금융기관은 전국적인 결제 텔레메트리를 활용한 즉각적인 부정 스코어링을 도입해 업계의 성숙도를 뒷받침하고 있습니다. 북 버지니아의 임대료는 2024년에 41.6% 상승했으며, 급박한 용량이 지속적인 확장을 촉진하고 있음을 나타냈습니다.
아시아태평양은 CAGR 27.2% 전망에서 가장 빠르게 성장하는 지역입니다. 인도는 2026년까지 설치된 데이터센터용량을 약 1.8GW로 두배로 늘릴 계획이며, 국내외 투자자들의 수십억 달러 규모의 자금투입이 이를 지원하고 있습니다. 대만에서는 칩 설계 시뮬레이션 및 대규모 언어 모델(LLM)의 교육 수요에 대응하기 위해 2028년까지 시설 건설비가 30억 달러 이상에 달할 것으로 예측되고 있습니다. 중국은 모델 품질에 있어서 미국과의 차이를 줄이고 있으며, 각 성의 조성금이 차세대 AI 프레임워크의 개발을 촉진하고 있습니다. 그러나 엄격한 데이터 현지화 규제로 기업은 통일된 세계의 기반이 아니라 국가별 분석 스택을 구축해야 하는 상황입니다.
유럽에서는 제조 및 중요 인프라의 현대화를 위해 에지에서 클라우드까지의 노력을 확대하고 있습니다. EU는 2030년까지 기업의 클라우드 채용률 75% 달성과 1만 기의 기후 중립형 에지 노드 배포를 목표로 하고 있습니다. 각국 프로그램은 저지연 분석이 필요한 6G 테스트 베드, 통신 사업자용 엣지 클라우드 파일럿, 산업용 메타버스 실증 프로젝트에 자금을 투입하고 있습니다. 2024년 유럽 최초의 AI 팩토리가 개설되어 데이터 수출 없이 모델을 교육하고자 하는 자동차, 항공우주, 에너지 기업을 위한 주권적인 컴퓨팅 환경을 제공했습니다.
기타 혜택 :
- 엑셀 형식 시장 예측(ME) 시트
- 애널리스트 지원(3개월간)
자주 묻는 질문
목차
제1장 서론
- 조사 전제조건 및 시장 정의
- 조사 범위
제2장 조사 방법
제3장 주요 요약
제4장 시장 상황
- 시장 개요
- 시장 성장 촉진요인
- 북미의 금융 서비스 업계(BFSI)에서의 부정 검지용 실시간 분석 도입의 가속
- 아시아에서의 페타바이트 규모의 데이터 처리를 필요로 하는 AI/ML 모델 트레이닝의 급증
- 유럽에서 스마트 제조용 에지에서 클라우드로의 HPC 성장
- 중동 국가 정부의 국방 빅 데이터 근대화 프로그램
- 재생에너지망 최적화 이니셔티브가 남미에서의 HPC 분석을 추진
- GPU/CPU 클러스터의 코어 단가 저하에 의해 세계의 중소기업 대상 경제적인 HPC 실현
- 시장 성장 억제요인
- 카리브해 지역 및 아프리카에서 전용 HPC 클러스터의 높은 총 소유 비용
- 유럽 및 오세아니아 지역에서의 숙련 HPC·병렬 프로그래밍 전문가의 부족
- 아시아의 월경 클라우드 분석을 제한하는 데이터 주권 규제
- 신흥 시장에서의 인프라 신뢰성의 문제가 지속적인 데이터 스트림을 저해
- 규제 전망
- 기술 전망
- 고성능 클러스터 컴퓨팅의 진화
- 그리드 컴퓨팅
- 인메모리 분석
- 데이터베이스 내 분석
- Porter's Five Forces 분석
- 공급기업의 협상력
- 구매자의 협상력
- 신규 참가업체의 위협
- 대체품의 위협
- 경쟁 기업 간 경쟁 관계
- 투자분석
제5장 시장 규모와 성장 예측
- 구성 요소별
- 하드웨어
- 소프트웨어
- 서비스
- 배포 모델별
- On-Premise
- 온디맨드 및 클라우드
- 조직 규모별
- 중소기업
- 대기업
- 최종 사용자 업계별
- 은행, 금융 서비스 및 보험(BFSI)
- 정부 및 방위
- 에너지 및 유틸리티
- 소매 및 전자상거래
- 의료 및 생명과학
- 통신 및 IT 서비스
- 제조
- 지역별
- 북미
- 미국
- 캐나다
- 멕시코
- 남미
- 브라질
- 아르헨티나
- 칠레
- 페루
- 기타 남미
- 유럽
- 독일
- 영국
- 프랑스
- 이탈리아
- 스페인
- 기타 유럽
- 아시아태평양
- 중국
- 일본
- 한국
- 인도
- 호주
- 뉴질랜드
- 기타 아시아태평양
- 중동
- 아랍에미리트(UAE)
- 사우디아라비아
- 튀르키예
- 기타 중동
- 아프리카
- 남아프리카
- 기타 아프리카
- 북미
제6장 경쟁 구도
- 전략적 개발
- 벤더 포지셔닝 분석
- 기업 프로파일
- Amazon Web Services, Inc.(AWS)
- Google LLC
- Microsoft Corporation
- IBM Corporation
- Hewlett Packard Enterprise(HPE)
- Dell Technologies Inc.
- SAS Institute Inc.
- Oracle Corporation
- Fujitsu Limited
- Intel Corporation
- ATOS SE
- Juniper Networks Inc.
- NEC Corporation
- Cisco Systems, Inc.
- Teradata Corporation
- Cray Inc.(HPE Cray)
- Altair Engineering Inc.
- Cloudera, Inc.
- Huawei Technologies Co., Ltd.
- Hitachi Vantara LLC
- Super Micro Computer, Inc.
제7장 시장 기회와 향후 전망
KTH 26.01.22The high-performance data analytics market is expected to grow from USD 125.99 billion in 2025 to USD 152.6 billion in 2026 and is forecast to reach USD 398.17 billion by 2031 at 21.12% CAGR over 2026-2031.

Momentum comes from the convergence of AI, cloud computing, and the swelling volume of enterprise data. Financial services remain a prime adopter as real-time fraud analytics become essential for secure transaction banking. Software accounts for 46.2% revenue, while services are expanding fastest on the back of specialized AI consulting. On-premise deployments presently lead with 57.8% share, yet cloud-based solutions are the clear growth engine at a 30.1% CAGR as providers scale global GPU capacity. Regionally, North America commands 35.4% share, but Asia-Pacific is on track for the quickest gains given sweeping digital-transformation programs. Large enterprises dominate adoption, though SMEs are narrowing the gap thanks to plummeting GPU rental rates, exemplified by USD 3.35-per-hour H100 instances that undercut hyperscaler list prices by more than 90%.
Global High-Performance Data Analytics Market Trends and Insights
Accelerating Adoption of Real-Time Analytics in BFSI for Fraud Detection
Financial institutions have recorded a tenfold rise in social-engineering scams, now 23% of digital-banking fraud cases, prompting rapid rollouts of high-performance fraud-detection engines. TD Bank achieved enterprise-wide real-time monitoring after winning the 2024 FICO Decisions Award. AI-enabled platforms are attaining 98.5% detection accuracy while processing 1 Gbps data streams without latency. As a result, BFSI institutions are embedding low-latency analytics into payment rails, credit-risk scoring, and know-your-customer checks to safeguard reputational and financial capital. These deployments underpin a 5.2% lift in the overall CAGR for the high-performance data analytics market.
Surge in AI/ML Model Training Requiring Petabyte-Scale Data Processing
Generative-AI models are doubling in parameter count every six months, demanding petabyte-scale data ingestion and exascale compute clusters. Hyperscale data-center investment tied to AI workloads is set to climb from USD 162.79 billion in 2024 to USD 608.54 billion by 2030. Providers such as Microsoft and Google have earmarked a combined USD 155 billion for next-generation AI facilities. This capital outlay elevates demand for distributed file systems, high-throughput interconnects, and advanced scheduling software, translating into a 6.8% positive push on market growth.
High Total Cost of Ownership for Dedicated HPC Clusters
Capital expenditure on data-center builds is projected to surpass USD 250 billion in 2025, and expanding power needs add a further USD 500 billion through 2030. Many developing nations face electricity shortfalls that hinder the launch of local HPC facilities. Organizations struggle to justify on-premise clusters once equipment, cooling, and skilled-staff costs are tallied, curbing adoption in resource-constrained regions and trimming overall CAGR by 2.1%.
Other drivers and restraints analyzed in the detailed report include:
- Growth of Edge-to-Cloud HPC for Smart Manufacturing
- Falling Cost-Per-Core for GPU/CPU Clusters Enabling Affordable HPC for SMEs
- Shortage of Skilled HPC & Parallel-Programming Professionals
For complete list of drivers and restraints, kindly check the Table Of Contents.
Segment Analysis
The software segment generated 45.78% of revenue in 2025, reflecting demand for user-friendly analytics engines, data-fabric layers, and AI orchestration tools. Vendors are embedding workflow automation and feature-store capabilities that hasten model deployment across business units. DevOps integration is tightening feedback cycles, and license structures are shifting toward consumption-based billing that aligns cost with value creation. Hardware sales remain foundational, propelled by silicon advances such as NVIDIA Blackwell Ultra GPUs that field higher tensor-core density for transformer workloads.
Services are the quickest-expanding line, projected at 25.05% CAGR through 2031. Consulting teams now bundle data-strategy design, MLOps implementation, and continuous-model-tuning services, filling expertise gaps in complex hybrid stacks. Providers are launching AI-as-a-Service offerings that include managed feature engineering, bias auditing, and federated-learning orchestration. These shifts broaden addressable demand and lift the high-performance data analytics market size for service engagements, especially among first-time enterprise adopters.
On-premise deployments held 57.05% share in 2025, anchored by sectors that guard latency or sovereignty, including government and banking. Organizations cite direct hardware control and compliance with strict data-residency statutes as prime motives. Many firms also leverage existing data-center sunk costs, optimizing occupancy rates by refreshing nodes rather than migrating wholesale to cloud.
Cloud platforms are climbing at a 29.25% CAGR, propelled by elastic scaling, consumption pricing, and global edge-zone rollouts. Providers have broadened confidential-computing instances and sovereign-cloud regions to mollify regulatory concerns. Hybrid and multi-cloud patterns now dominate greenfield projects, combining local accelerators with burst capacity for AI training. The shift is enlarging the high-performance data analytics market size attached to consumption models while easing entry for resource-constrained enterprises.
The High-Performance Data Analytics Market Report is Segmented by Component (Hardware, Software, and Services), Deployment Model (On-Premise, and On-Demand/Cloud), Organization Size (Small and Medium Enterprises, and Large Enterprises), End-User Industry (BFSI, Government and Defense, Energy and Utilities, and More), and Geography. The Market Forecasts are Provided in Terms of Value (USD).
Geography Analysis
North America maintained 34.85% revenue leadership in 2025, buoyed by deep hyperscaler footprints and early enterprise AI adoption. U.S. data-center supply rose by 26% year on year to 5.2 GW, matching proliferating AI inference demand. Banks such as TD leverage national payment telemetry for instant fraud scoring, underscoring sector maturity. Rental rates in Northern Virginia advanced 41.6% in 2024, evidencing tight capacity that spurs continued build-outs.
Asia-Pacific is the fastest-growing region with a 27.2% CAGR outlook. India plans to double installed data-center capacity to nearly 1.8 GW by 2026, underwritten by multibillion-dollar commitments from domestic and global investors. Taiwan's facility builds are forecast to exceed USD 3 billion by 2028 to service chip-design simulations and large-language-model training. China is closing the model-quality gap with the United States, with provincial grants catalyzing next-generation AI frameworks. Yet, stringent data-localization rules are compelling firms to engineer country-specific analytics stacks rather than unified global fabrics.
Europe is scaling edge-to-cloud initiatives to modernize manufacturing and critical infrastructure. The EU aims to reach 75% business-cloud adoption and deploy 10,000 climate-neutral edge nodes by 2030. National programs channel capital toward 6G testbeds, telco-edge cloud pilots, and industrial metaverse demonstrators that require low-latency analytics. The opening of the first European AI factories in 2024 provides sovereign compute for automotive, aerospace, and energy firms seeking to train models without exporting data.
- Amazon Web Services, Inc. (AWS)
- Google LLC
- Microsoft Corporation
- IBM Corporation
- Hewlett Packard Enterprise (HPE)
- Dell Technologies Inc.
- SAS Institute Inc.
- Oracle Corporation
- Fujitsu Limited
- Intel Corporation
- ATOS SE
- Juniper Networks Inc.
- NEC Corporation
- Cisco Systems, Inc.
- Teradata Corporation
- Cray Inc. (HPE Cray)
- Altair Engineering Inc.
- Cloudera, Inc.
- Huawei Technologies Co., Ltd.
- Hitachi Vantara LLC
- Super Micro Computer, Inc.
Additional Benefits:
- The market estimate (ME) sheet in Excel format
- 3 months of analyst support
TABLE OF CONTENTS
1 Introduction
- 1.1 Study Assumptions and Market Definition
- 1.2 Scope of the Study
2 Research Methodology
3 Executive Summary
4 Market Landscape
- 4.1 Market Overview
- 4.2 Market Drivers
- 4.2.1 Accelerating Adoption of Real-Time Analytics in BFSI for Fraud Detection in North America
- 4.2.2 Surge in AI/ML Model Training Requiring Petabyte-Scale Data Processing in Asia
- 4.2.3 Growth of Edge-to-Cloud HPC for Smart Manufacturing in Europe
- 4.2.4 National Defense Big-Data Modernization Programs Across Middle East Governments
- 4.2.5 Renewable-Energy Grid Optimization Initiatives Driving HPC Analytics in South America
- 4.2.6 Falling Cost-per-Core for GPU/CPU Clusters Enabling Affordable HPC for SMEs Globally
- 4.3 Market Restraints
- 4.3.1 High Total Cost of Ownership for Dedicated HPC Clusters in Caribbeans and Africa
- 4.3.2 Shortage of Skilled HPC and Parallel Programming Professionals in Europe and Oceania
- 4.3.3 Data-Sovereignty Regulations Limiting Cross-Border Cloud Analytics in Asia
- 4.3.4 Infrastructure Reliability Issues in Emerging Markets Hampering Continuous Data Streams
- 4.4 Regulatory Outlook
- 4.5 Technological Outlook
- 4.5.1 High-Performance Cluster Computing Evolution
- 4.5.2 Grid Computing
- 4.5.3 In-Memory Analytics
- 4.5.4 In-Database Analytics
- 4.6 Porter's Five Forces Analysis
- 4.6.1 Bargaining Power of Suppliers
- 4.6.2 Bargaining Power of Buyers
- 4.6.3 Threat of New Entrants
- 4.6.4 Threat of Substitutes
- 4.6.5 Intensity of Competitive Rivalry
- 4.7 Investment Analysis
5 Market Size and Growth Forecasts
- 5.1 By Component
- 5.1.1 Hardware
- 5.1.2 Software
- 5.1.3 Services
- 5.2 By Deployment Model
- 5.2.1 On-Premise
- 5.2.2 On-Demand/Cloud
- 5.3 By Organization Size
- 5.3.1 Small and Medium Enterprises (SMEs)
- 5.3.2 Large Enterprises
- 5.4 By End-User Industry
- 5.4.1 Banking, Financial Services and Insurance (BFSI)
- 5.4.2 Government and Defense
- 5.4.3 Energy and Utilities
- 5.4.4 Retail and E-Commerce
- 5.4.5 Healthcare and Life Sciences
- 5.4.6 Telecommunication and IT Services
- 5.4.7 Manufacturing
- 5.5 By Geography
- 5.5.1 North America
- 5.5.1.1 United States
- 5.5.1.2 Canada
- 5.5.1.3 Mexico
- 5.5.2 South America
- 5.5.2.1 Brazil
- 5.5.2.2 Argentina
- 5.5.2.3 Chile
- 5.5.2.4 Peru
- 5.5.2.5 Rest of South America
- 5.5.3 Europe
- 5.5.3.1 Germany
- 5.5.3.2 United Kingdom
- 5.5.3.3 France
- 5.5.3.4 Italy
- 5.5.3.5 Spain
- 5.5.3.6 Rest of Europe
- 5.5.4 Asia-Pacific
- 5.5.4.1 China
- 5.5.4.2 Japan
- 5.5.4.3 South Korea
- 5.5.4.4 India
- 5.5.4.5 Australia
- 5.5.4.6 New Zealand
- 5.5.4.7 Rest of Asia-Pacific
- 5.5.5 Middle East
- 5.5.5.1 United Arab Emirates
- 5.5.5.2 Saudi Arabia
- 5.5.5.3 Turkey
- 5.5.5.4 Rest of Middle East
- 5.5.6 Africa
- 5.5.6.1 South Africa
- 5.5.6.2 Rest of Africa
- 5.5.1 North America
6 Competitive Landscape
- 6.1 Strategic Developments
- 6.2 Vendor Positioning Analysis
- 6.3 Company Profiles (includes Global level Overview, Market level overview, Core Segments, Financials as available, Strategic Information, Products and Services, and Recent Developments)
- 6.3.1 Amazon Web Services, Inc. (AWS)
- 6.3.2 Google LLC
- 6.3.3 Microsoft Corporation
- 6.3.4 IBM Corporation
- 6.3.5 Hewlett Packard Enterprise (HPE)
- 6.3.6 Dell Technologies Inc.
- 6.3.7 SAS Institute Inc.
- 6.3.8 Oracle Corporation
- 6.3.9 Fujitsu Limited
- 6.3.10 Intel Corporation
- 6.3.11 ATOS SE
- 6.3.12 Juniper Networks Inc.
- 6.3.13 NEC Corporation
- 6.3.14 Cisco Systems, Inc.
- 6.3.15 Teradata Corporation
- 6.3.16 Cray Inc. (HPE Cray)
- 6.3.17 Altair Engineering Inc.
- 6.3.18 Cloudera, Inc.
- 6.3.19 Huawei Technologies Co., Ltd.
- 6.3.20 Hitachi Vantara LLC
- 6.3.21 Super Micro Computer, Inc.
7 Market Opportunities and Future Outlook
- 7.1 White-space and Unmet-Need Assessment
