
|
시장보고서
상품코드
1910691
액화석유가스(LPG) 시장 : 점유율 분석, 업계 동향 및 통계, 성장 예측(2026-2031년)Liquefied Petroleum Gas (LPG) - Market Share Analysis, Industry Trends & Statistics, Growth Forecasts (2026 - 2031) |
||||||
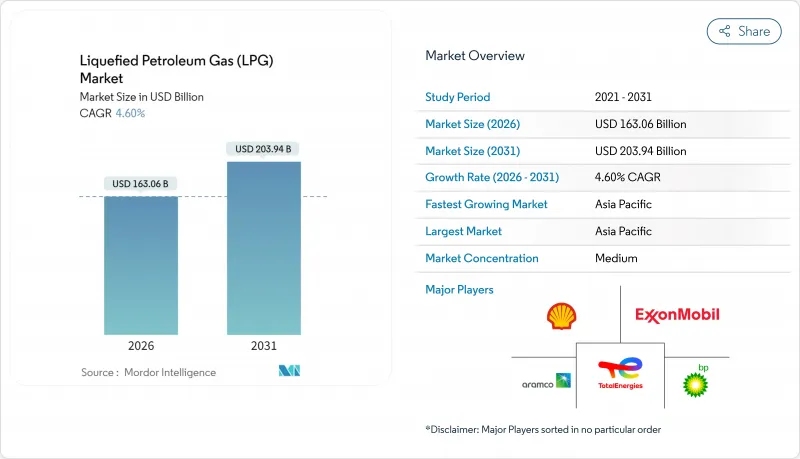
액화석유가스 시장은 2025년 1,558억 9,000만 달러로 평가되었으며, 2026년 1,630억 6,000만 달러에서 2031년까지 2,039억 4,000만 달러에 이를 것으로 예측됩니다.
예측기간(2026-2031년)의 CAGR은 4.60%로 예상됩니다.
수요의 탄력성은 아시아의 석유화학 원료 성장, 인도와 인도네시아의 대규모 농촌 요리 프로그램, IMO-2020 규제 강화 후 고황 연료로부터의 지속적인 대체 수요에 의해 뒷받침됩니다. 공급의 다양성은 카타르와 아랍에미리트(UAE)에서 생산량을 증가시키고 북미 생산자가 셰일 유래 생산량을 극대화하면서 확대하고 있지만, 수출 병목 현상으로 인해 가격 변동이 빈번하게 발생하고 있습니다. EU 탈탄소화 규제 하에서 바이오 LPG가 기세를 늘리면서 인도, 미국, 서아프리카에서는 파이프라인 투자를 통해 물류 비용과 안전 위험을 줄이기 위해 노력하고 있습니다. 따라서 시장 진출기업은 안정적인 가정 소비, 확대하는 석유화학 수요, 저탄소 분자를 평가하는 규제 변화라는 균형잡힌 기회군을 능숙하게 활용하고 있습니다.
세계의 액화석유가스(LPG) 시장의 동향 및 인사이트
LPG 스토브 프로그램을 통한 청정 연료에 대한 접근성 확대
인도네시아에서는 5,000만 인구가 등유에서 LPG로 전환하면서 신속한 확장성을 보여주었고 다른 개발도상국들에게 참고 모델이 되었습니다. 인도의 'Pradhan Mantri Ujjwala Yojana' 프로그램은 2024년 750만 개의 신규 봄베 연결을 추가해 보조금 합리화가 진행되는 가운데 수입량을 24% 증가시켰습니다. 서아프리카 국가 정부는 현재 세계 은행의 LPG 파트너십과 협력하여 이러한 발전을 벤치마킹하고 있습니다. 카메룬에서는 2030년까지 보급률을 12%에서 58%로 높이는 것을 목표로 하고 있습니다. 농촌 지역의 전력 공급 격차가 해소되지 않는 상황에서는 특히 송전망의 신뢰성이 낮은 지역에서 LPG는 전기 조리기구에 대해 경쟁력 있는 위치를 유지하고 있습니다. 따라서 보조금의 지속적인 대상 선정과 라스트마일 유통의 혁신이 가정에서의 보급을 지속시키기 위한 열쇠가 됩니다.
석유화학 원료에 대한 수요 급증으로 아시아 무역 흐름의 재구성
중국의 프로판 탈수소화 능력은 2024년 연간 2,260만 톤에 달하였고, 경기 순환에 의한 감속에도 불구하고 안정된 해상 수입을 뒷받침하고 있습니다. 이에 따라 인도는 바디나르에 연간 150만 톤의 에탄 분해 플랜트를 건설하기 위해 80억 달러를 투입하여 국내 원료 확보와 해외 의존 억제를 도모했습니다. 미국에서 중국으로의 에탄 수출은 관세 인하로 인한 재정거래의 경제성 개선으로 2025년에 추가적으로 9-34% 증가한 것으로 나타났습니다. 라이온델바젤이 정유소 유닛을 폐쇄함에 따라 프로파일렌 수급의 축소로 인해 미국제 폴리머 등급 가격은 파운드당 0.40달러를 넘어섰습니다. 총 160억 달러를 넘는 아시아의 파이프라인 및 저장 인프라가 지역적인 수요 변동을 흡수하면서 장기적인 액화석유가스 시장의 성장을 지지하는 기반이 될 전망입니다.
미국 수출 제약에 따른 가격 변동
2024년 미국 걸프 지역의 터미널 가동률은 100% 가까이에서 추이하였고 몽벨뷰 항구의 화물 프리미엄은 32.5센트/갤런까지 상승했지만 잉여 프로판이 저장 시설에 유입됨으로써 하락했습니다. 엔터프라이즈의 300,000 배럴 규모 휴스턴 확장 계획은 2026년 말까지 실현이 불투명할 전망이며 ONEOK-MPLX의 400,000 배럴 규모 텍사스시티 프로젝트는 2028년 완공까지 기다려야 하기 때문에 당분간 공급 능력은 부족합니다. 미국은 일량 213만 배럴 규모인 프로판 생산량의 70%를 수출하고 있으며, 재정 거래의 해소는 재고의 급증과 가격 불안정화를 초래합니다. 가장 큰 구매자인 중국의 입장은 지정학적 위험을 증폭시킵니다. 관세 분쟁이 재연되면 아시아 수입업체는 고가의 중동산 화물로 이동할 수밖에 없습니다. 변동성 증가는 2024년에 에탄 프로판 파생 상품 거래량이 43% 급증한 사태에서도 드러났듯이 헤징의 이용 확대로 이어지고 있습니다.
부문 분석
액화천연가스(NGL)는 북미 셰일가스 및 중동의 수반가스 프로젝트에 의한 저한계비용을 배경으로 2025년에는 액화석유가스(LPG) 시장에서 60.45%의 점유율을 획득했습니다. 카타르는 노스필드 확장으로 2024년 1,070만 톤에서 2030년 1,760만 톤으로 LPG 생산량이 증가할 전망입니다. 한편, ADNOC 가스의 3가지 계획은 동기간에 250만 톤을 추가하여 지역공급 안정성을 강화할 전망입니다. 인도나 중국의 정제업자가 석유화학제품으로 전환하면서 연료용 배합 원료의 가동률을 낮췄기 때문에 정제 유래 LPG는 축소되고 있습니다. 바이오 LPG는 시장에서 여전히 소규모이지만 EU 규제와 정부의 인센티브에 의해 신규 생산능력이 발생하기 때문에 2025년 이후 CAGR 14.58%의 확대가 전망됩니다. 이 부문은 드롭인 호환성과 수명 주기 배출량을 최대 90% 줄이는 이점을 가지고 있으며, 공급업체는 기업의 넷 제로 조달 계약에서 프리미엄 가격을 설정할 수 있습니다. 그러나 원료의 이용가능성과 재생가능 디젤과의 경쟁은 단기적인 확대를 제한하고 있으며, 특히 북미에서는 기존 LPG의 공급 과잉으로 인해 그린 프리미엄이 축소되고 있습니다.
도입 경로는 지역에 따라 상이합니다. 유럽에서는 사용 후 식용유와 폐기물 유래의 HVO(수소 처리 식물성 오일)이 주류인 반면, 미국에서는 기존의 재생 가능 디젤 플랜트를 이용한 HEFA(수소 처리 지방산) 프로세스가 선호되고 있습니다. 아시아에서는 바이오 LPG의 도입이 아직 초기 단계이지만 일본과 한국이 제품별 스트림을 통합한 항공 탈탄소화 전략을 발표함에 따라 가속화될 가능성이 있습니다. 액화석유가스(LPG) 시장의 점유율은 재생가능 분자로 이행하는 경향이 있으며 예측기간 동안 확대가 예상됩니다. 그러나 적어도 2030년까지 절대량에서는 화석 유래의 액화천연가스(NGL)가 주도적 지위를 유지할 전망입니다. 이러한 2원 공급 시스템은 기존 사업자가 셰일 관련 확장과 신흥 바이오리파이너리에 대한 투자를 통한 헤지를 촉진하는 요인이 됩니다.
본 보고서는 생산원별(정유소 LPG, 액화천연가스, 바이오 LPG 및 재생 가능 프로판), 유통 채널별(봄베 가스, 파이프라인 및 가상 파이프라인, 벌크 공급 및 소매 벌크 공급), 용도(가정 및 상업용 조리 및 난방, 석유 화학 원료, 자동차용 연료 및 가스 연료 등), 지역(북미, 유럽, 아시아태평양 등)으로 나뉩니다.
지역별 분석
아시아태평양은 2025년 세계 매출의 43.60%를 차지하였고 석유화학 수요가 도시 지역의 유도 전환을 상쇄하기 때문에 2031년까지 연평균 복합 성장률(CAGR) 5.38%를 유지할 것으로 예측됩니다. 중국의 2,260만 톤 PDH(탈수소화 프로판) 생산 능력은 국내 경제의 둔화에도 불구하고 해상 수송 프로판 수요를 보장합니다. 인도에서는 2024년 수입량이 24% 급증했으나 보조금 축소에 따라 증가 속도는 둔화될 전망입니다. 그러나 농촌에 대한 가스 보급 프로그램에서 조리용 가스는 여전히 중요한 역할을 하고 있습니다. 인도네시아가 2050년까지 LPG 사용량을 31% 감량할 방침을 내세우면서 과제가 발생하고 있지만, 동남아시아에서의 산업 및 관광 분야의 확대가 전체적인 수요량을 뒷받침하고 있습니다. 일본과 한국은 안정적인 산업 기반 수요를 유지하는 반면 베트남과 필리핀은 인구 증가와 견조한 건설 부문을 배경으로 새로운 성장 기지로 대두하고 있습니다.
북미는 일량 213만 배럴의 프로판 생산 기반을 활용해 항만 혼잡에도 불구하고 생산량의 70% 이상을 수출하고 있습니다. 캐나다에서는 Keyera사가 Plains사의 NGL 부문을 51억 5,000만 달러에 인수하여 저장 및 분류 기능을 통합하고 태평양 분지에 대한 공급 이중성을 강화합니다. 멕시코는 국내 부족을 보완하는 크로스보더 파이프라인 연결의 혜택을 받고 있으며, 전문 유통업체는 서비스가 도달하지 않는 중앙 고원 도시로 가상 파이프라인을 확대하고 있습니다.
유럽은 러시아에 의존하는 공급의 다변화에 직면하고 있습니다. 폴란드에 대한 의존도가 높기 때문에 공급사는 고가의 운임으로 미국과 중동산 프로판을 조달하는 경향이 있습니다. 영국에서의 6억 파운드 규모의 재생가능 프로판 추진책은 전략적 헤지를 시사하고, OMV 페트롬은 페트로브라지 지역에 투자하여 남동유럽 최초의 주요 SAF-바이오-LPG 허브를 확립했습니다. 중동 생산국(주로 카타르와 UAE)은 2030년까지 940만 톤의 신규 생산 능력을 추가해, 아시아를 위한 경쟁력 있는 공급을 실현할 예정이며 미국의 점유율을 획득하고 있습니다. 사하라 이남 아프리카는 공급 부족이 계속되고 있지만, 남아프리카의 리차드베이 저장 시설(10억 랜드 규모)이 가동을 개시해 지역적인 공급 안정화에 기여하고 있습니다. 라틴아메리카에서는 봄베 안전 사고에 의해 성장이 억제되고 있지만, 콜롬비아와 페루에서는 파이프라인 근대화에 의해 신뢰성 향상과 최종 사용자의 비용 절감을 목표로 하고 있습니다.
기타 혜택
- 시장 예측(ME) 엑셀 시트
- 3개월 애널리스트 서포트
자주 묻는 질문
목차
제1장 서론
- 조사의 전제조건 및 시장의 정의
- 조사 범위
제2장 조사 방법
제3장 주요 요약
제4장 시장 상황
- 시장 개요
- 촉진요인
- LPG 사용 하이브리드 스토브 프로그램으로의 이행(인도, 인도네시아)
- 신흥 아시아에서의 석유화학 원료에 대한 수요 급증
- IMO-2020 대응 연료를 향한 정유소 업그레이드의 가속화
- 농촌의 가정 전기화 지연이 봄베 수요를 뒷받침함(아프리카)
- 보조금 개혁이 상업 부문의 도입을 촉진(중동)
- 북미 및 EU의 탈탄소화 계획에서 재생 가능 프로판의 규모 확대
- 억제요인
- 미국의 셰일 수출 재정 거래에 연동하는 가격 변동성
- 중국 및 EU 도시에서의 인덕션 보급 가속화
- 보다 엄격한 메탄 강도 규제에 의해 LPG보다 파이프라인 천연가스가 우위를 점함
- 봄베 물류에서의 안전 사고로 대중의 신뢰 하락(라틴아메리카)
- 공급망 분석
- 규제 상황
- 기술 전망
- Porter's Five Forces
- 공급자의 협상력
- 소비자의 협상력
- 신규 참가업체의 위협
- 대체 제품 및 서비스의 위협
- 경쟁 기업 간 경쟁 관계
제5장 시장 규모 및 성장 예측
- 생산원별
- 정유소 LPG
- 액화천연가스(수반가스, NGL)
- 바이오 LPG 및 재생 가능 프로판
- 유통 채널별
- 봄베(패키지) 가스
- 벌크 공급 및 소매 벌크 공급
- 파이프라인 및 가상 파이프라인
- 용도별
- 가정 및 업무용 조리 또는 난방
- 산업 및 상업 공정
- 자동차용 연료 및 가스
- 석유화학 원료
- 농업 및 기타
- 지역별
- 북미
- 미국
- 캐나다
- 멕시코
- 유럽
- 독일
- 영국
- 프랑스
- 이탈리아
- 러시아
- 기타 유럽
- 아시아태평양
- 중국
- 인도
- 일본
- 한국
- ASEAN 국가
- 기타 아시아태평양
- 남미
- 브라질
- 아르헨티나
- 기타 남미
- 중동 및 아프리카
- 사우디아라비아
- 아랍에미리트(UAE)
- 남아프리카
- 이집트
- 기타 중동 및 아프리카
- 북미
제6장 경쟁 구도
- 시장 집중도
- 전략적 움직임(M&A, 파트너십, 전력 구매 계약)
- 시장 점유율 분석(주요 기업의 시장 순위 및 점유율)
- 기업 프로파일
- BP plc
- Exxon Mobil Corporation
- Shell plc
- TotalEnergies SE
- Chevron Corporation
- ConocoPhillips
- Abu Dhabi National Oil Company(ADNOC)
- QatarEnergy
- Gazprom PJSC
- Novatek PAO
- China Petroleum & Chemical Corporation(Sinopec)
- China National Petroleum Corporation(CNPC)
- Indian Oil Corporation Ltd
- Reliance Industries Ltd(Reliance Gas)
- SHV Energy BV
- UGI Corp/AmeriGas
- Ferrellgas Partners LP
- Petronas
- PTT Public Company Ltd
- KazMunayGas
제7장 시장 기회 및 미래 전망
CSM 26.02.09The Liquefied Petroleum Gas Market was valued at USD 155.89 billion in 2025 and estimated to grow from USD 163.06 billion in 2026 to reach USD 203.94 billion by 2031, at a CAGR of 4.60% during the forecast period (2026-2031).

Demand resilience is anchored by Asian petrochemical feedstock growth, large-scale rural cooking programs in India and Indonesia, and continuing substitution of high-sulfur fuels after IMO-2020 upgrades. Supply diversity widens as Qatar and the UAE lift output while North American producers maximize shale-derived volumes, yet export bottlenecks keep price swings frequent. Bio-LPG gains momentum under EU decarbonization rules, and pipeline investments in India, the United States, and West Africa seek to trim logistics costs and safety risks. Market participants, therefore, juggle a balanced opportunity set: stable household consumption, expanding petrochemical pull, and regulatory shifts that reward lower-carbon molecules.
Global Liquefied Petroleum Gas (LPG) Market Trends and Insights
LPG-ready cook-stove programmes expand clean fuel access
Indonesia's conversion of 50 million households from kerosene to LPG demonstrates rapid scalability and has become a reference model for other developing nations. India's Pradhan Mantri Ujjwala Yojana added 7.5 million new cylinder connections in 2024, driving a 24% import surge despite ongoing subsidy rationalization. West African governments now partner with the World Bank's Global LPG Partnership to replicate these roll-outs, aiming to lift Cameroon's penetration from 12% to 58% by 2030. Persistent rural electrification gaps leave LPG competitively positioned versus electric cooking, particularly where grid reliability remains low. Therefore, continued subsidy targeting and last-mile distribution innovation are central to sustaining household uptake.
Petrochemical feedstock demand boom reshapes Asian trade flows
China's propane dehydrogenation capacity climbed to 22.6 million t/y in 2024 and underpins steady seaborne imports despite cyclical economic slowdowns. India followed by committing USD 8 billion to a 1.5 million t/y ethane cracker at Vadinar that secures domestic feedstock and curbs foreign dependency. US ethane exports to China are projected to rise another 9-34% in 2025 as lower tariffs improve arbitrage economics. Tightening propylene balances have driven US polymer-grade prices beyond USD 0.40 per pound after LyondellBasell shuttered refinery units. In aggregate, more than USD 16 billion of Asian pipeline and storage infrastructure is set to anchor long-run liquefied petroleum gas market growth by absorbing regional demand volatility.
Price volatility driven by US export constraints
Gulf Coast terminal utilization hovered near 100% in 2024, sending Mont Belvieu cargo premiums to 32.5 c/gal before retreating when surplus propane hit storage. Enterprise's 300,000 b/d Houston expansion will not materialize until late 2026, while the 400,000 b/d ONEOK-MPLX Texas City project arrives only in 2028, leaving an interim capacity crunch. With the United States exporting 70% of its 2.13 million b/d propane output, any arbitrage closure triggers rapid inventory builds and price instability. China's position as the largest buyer magnifies geopolitical risk: a renewed tariff dispute could force Asian importers toward higher-priced Middle Eastern cargos. Volatility encourages heavier use of paper hedging, evidenced by a 43% surge in ethane and propane derivative trading volumes during 2024.
Other drivers and restraints analyzed in the detailed report include:
- Refinery upgrades for IMO-2020 multiply LPG supply points
- Renewable propane scale-up introduces low-carbon competition
- Induction cooking erodes urban LPG demand pockets
For complete list of drivers and restraints, kindly check the Table Of Contents.
Segment Analysis
Natural-gas liquids secured a 60.45% share of the liquefied petroleum gas market in 2025, buoyed by North American shale and Middle Eastern associated-gas projects that keep marginal costs low. Qatar's North Field build-out will elevate national LPG output from 10.7 million t in 2024 to 17.6 million t by 2030, while three ADNOC Gas programs add 2.5 million t over the same horizon, strengthening regional supply security. Refinery-derived LPG has come under pressure as Indian and Chinese refiners pivot toward petrochemicals, trimming run rates for fuels blending streams. Although still modest, the liquefied petroleum gas market size for bio-LPG is anticipated to expand at a 14.58% CAGR when measured from its 2025 baseline as EU mandates and state incentives unlock new production capacity. The segment benefits from drop-in compatibility and up to 90% lifecycle emissions cuts, enabling suppliers to layer premium pricing on corporate net-zero procurement contracts. Nonetheless, feedstock availability and competition with renewable diesel limit near-term scaling, particularly in North America, where conventional LPG oversupply narrows green premiums.
Adoption pathways differ across regions. Europe leans on used cooking oil and waste-based HVO routes, while the United States favors HEFA processes piggybacking on existing renewable diesel plants. Asia's bio-LPG roll-out remains nascent but could accelerate as Japan and South Korea unveil aviation decarbonization strategies that integrate co-product streams. The liquefied petroleum gas market share tilts toward renewable molecules, therefore deepens over the outlook, though absolute volumes remain led by fossil NGLs until at least 2030. This dual-track supply system encourages incumbents to hedge by investing in shale-linked expansions and emerging biorefineries.
The Liquefied Petroleum Gas (LPG) Market Report is Segmented by Source of Production (Refinery-Derived LPG, Natural Gas Liquids, and Bio-LPG/Renewable Propane), Distribution Channel (Cylinder Gas, Pipeline and Virtual Pipeline, and Bulk and Retail Bulk Supply), Application (Residential and Commercial Cooking/Heating, Petrochemical Feedstock, Autofuel/Autogas, and More), and Geography (North America, Europe, Asia-Pacific, and More).
Geography Analysis
Asia-Pacific held 43.60% of global revenue in 2025 and is expected to maintain a 5.38% CAGR to 2031 as petrochemical demand offsets urban induction conversions. China's 22.6 million-t PDH capacity ensures sustained seaborne propane pull, even with domestic economic moderation. India's 24% import surge in 2024 will taper as subsidies tighten, yet cooking gas remains critical for rural inclusion programs. Indonesia's roadmap to cut LPG usage 31% by 2050 introduces headwinds, though Southeast Asian industrial and tourism expansions cushion overall volumes. Japan and South Korea keep steady industrial baseloads, whereas Vietnam and the Philippines are emerging bright spots thanks to population growth and robust construction sectors.
North America leverages a 2.13 million b/d propane production platform, exporting more than 70% of output despite dock congestion. Canada's Keyera acquisition of Plains NGL assets for USD 5.15 billion integrates storage and fractionation, enhancing supply redundancy into Pacific basins. Mexico continues to benefit from cross-border pipeline connections that backstop domestic shortfalls, while specialty distributors expand virtual pipelines into underserved central plateau cities.
Europe grapples with post-Russian supply diversification: Poland's dependence has pushed traders toward US and Middle Eastern cargos at premium freight rates. The United Kingdom's GBP 600 million renewable propane drive signals strategic hedging, and OMV Petrom's Petrobrazi investment cements Southeast Europe's first major SAF-bio-LPG hub. Middle Eastern producers, chiefly Qatar and the UAE, add 9.4 million t of new capacity by 2030, enabling competitive offers into Asia and eroding US share in that corridor. Sub-Saharan Africa remains under-supplied; South Africa's R1 billion Richards Bay storage came online to stabilize regional availability. Latin America's growth is curtailed by cylinder safety incidents, but Colombia and Peru eye pipeline modernization to enhance reliability and lower end-user costs.
- BP plc
- Exxon Mobil Corporation
- Shell plc
- TotalEnergies SE
- Chevron Corporation
- ConocoPhillips
- Abu Dhabi National Oil Company (ADNOC)
- QatarEnergy
- Gazprom PJSC
- Novatek PAO
- China Petroleum & Chemical Corporation (Sinopec)
- China National Petroleum Corporation (CNPC)
- Indian Oil Corporation Ltd
- Reliance Industries Ltd (Reliance Gas)
- SHV Energy B.V.
- UGI Corp / AmeriGas
- Ferrellgas Partners LP
- Petronas
- PTT Public Company Ltd
- KazMunayGas
Additional Benefits:
- The market estimate (ME) sheet in Excel format
- 3 months of analyst support
TABLE OF CONTENTS
1 Introduction
- 1.1 Study Assumptions & Market Definition
- 1.2 Scope of the Study
2 Research Methodology
3 Executive Summary
4 Market Landscape
- 4.1 Market Overview
- 4.2 Market Drivers
- 4.2.1 Shift toward LPG-ready hybrid cook-stove programmes (India, Indonesia)
- 4.2.2 Petrochemical feedstock demand boom in emerging Asia
- 4.2.3 Accelerating refinery upgrades for IMO-2020 compliant fuels
- 4.2.4 Rural household electrification lag sustaining cylinder demand (Africa)
- 4.2.5 Subsidy reforms boosting commercial sector uptake (Middle East)
- 4.2.6 Renewable-propane scale-up in North America & EU decarbonization agendas
- 4.3 Market Restraints
- 4.3.1 Price volatility linked to US shale export arbitrage
- 4.3.2 Accelerating induction cooking penetration in urban China & EU
- 4.3.3 Stricter methane-intensity rules favoring piped natural gas over LPG
- 4.3.4 Cylinder logistics safety incidents undermining public perception (LATAM)
- 4.4 Supply-Chain Analysis
- 4.5 Regulatory Landscape
- 4.6 Technological Outlook
- 4.7 Porter's Five Forces
- 4.7.1 Bargaining Power of Suppliers
- 4.7.2 Bargaining Power of Consumers
- 4.7.3 Threat of New Entrants
- 4.7.4 Threat of Substitute Products & Services
- 4.7.5 Intensity of Competitive Rivalry
5 Market Size & Growth Forecasts
- 5.1 By Source of Production
- 5.1.1 Refinery-derived LPG
- 5.1.2 Natural Gas Liquids (Associated Gas, NGLs)
- 5.1.3 Bio-LPG/Renewable Propane
- 5.2 By Distribution Channel
- 5.2.1 Cylinder (Packaged) Gas
- 5.2.2 Bulk and Retail Bulk Supply
- 5.2.3 Pipeline and Virtual Pipeline
- 5.3 By Application
- 5.3.1 Residential and Commercial Cooking/Heating
- 5.3.2 Industrial and Commercial Processing
- 5.3.3 Autofuel/Autogas
- 5.3.4 Petrochemical Feedstock
- 5.3.5 Agriculture and Others
- 5.4 By Geography
- 5.4.1 North America
- 5.4.1.1 United States
- 5.4.1.2 Canada
- 5.4.1.3 Mexico
- 5.4.2 Europe
- 5.4.2.1 Germany
- 5.4.2.2 United Kingdom
- 5.4.2.3 France
- 5.4.2.4 Italy
- 5.4.2.5 Russia
- 5.4.2.6 Rest of Europe
- 5.4.3 Asia-Pacific
- 5.4.3.1 China
- 5.4.3.2 India
- 5.4.3.3 Japan
- 5.4.3.4 South Korea
- 5.4.3.5 ASEAN Countries
- 5.4.3.6 Rest of Asia-Pacific
- 5.4.4 South America
- 5.4.4.1 Brazil
- 5.4.4.2 Argentina
- 5.4.4.3 Rest of South America
- 5.4.5 Middle East and Africa
- 5.4.5.1 Saudi Arabia
- 5.4.5.2 United Arab Emirates
- 5.4.5.3 South Africa
- 5.4.5.4 Egypt
- 5.4.5.5 Rest of Middle East and Africa
- 5.4.1 North America
6 Competitive Landscape
- 6.1 Market Concentration
- 6.2 Strategic Moves (M&A, Partnerships, PPAs)
- 6.3 Market Share Analysis (Market Rank/Share for key companies)
- 6.4 Company Profiles (includes Global level Overview, Market level overview, Core Segments, Financials as available, Strategic Information, Products & Services, and Recent Developments)
- 6.4.1 BP plc
- 6.4.2 Exxon Mobil Corporation
- 6.4.3 Shell plc
- 6.4.4 TotalEnergies SE
- 6.4.5 Chevron Corporation
- 6.4.6 ConocoPhillips
- 6.4.7 Abu Dhabi National Oil Company (ADNOC)
- 6.4.8 QatarEnergy
- 6.4.9 Gazprom PJSC
- 6.4.10 Novatek PAO
- 6.4.11 China Petroleum & Chemical Corporation (Sinopec)
- 6.4.12 China National Petroleum Corporation (CNPC)
- 6.4.13 Indian Oil Corporation Ltd
- 6.4.14 Reliance Industries Ltd (Reliance Gas)
- 6.4.15 SHV Energy B.V.
- 6.4.16 UGI Corp / AmeriGas
- 6.4.17 Ferrellgas Partners LP
- 6.4.18 Petronas
- 6.4.19 PTT Public Company Ltd
- 6.4.20 KazMunayGas
7 Market Opportunities & Future Outlook
- 7.1 White-space & Unmet-Need Assessment

