
|
시장보고서
상품코드
1910810
질산 : 시장 점유율 분석, 업계 동향 및 통계, 성장 예측(2026-2031년)Nitric Acid - Market Share Analysis, Industry Trends & Statistics, Growth Forecasts (2026 - 2031) |
||||||
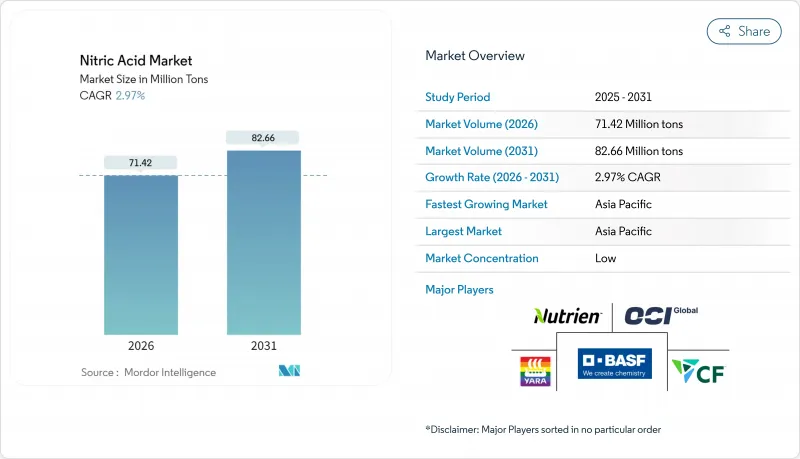
질산 시장은 2025년에 6,936만 톤으로 평가되었으며, 2026년 7,142만 톤에서 2031년까지 8,266만 톤에 이를 것으로 예상됩니다. 예측 기간(2026-2031년)의 CAGR은 2.97%를 나타낼 것으로 전망됩니다.
저탄소 암모니아에 대한 지속적인 투자, 폭발물 수요 증가, 비료 수요의 견조한 성장이 질산 시장의 기반을 지속적으로 유지하고 있지만, 환경 규제 대응 비용의 상승과 가스 가격의 변동이 비용 구조를 재구축하고 있습니다. 유럽에서는 BAT-AEL 기준의 강화에 따라 녹색 생산 수법으로의 이행이 급속히 진행되는 한편, 북미에서는 에너지 안보 강화를 위해 블루 암모니아 프로젝트를 활용하고 있습니다. 탄소회수기술, 재생가능수소, 선진촉매를 조기에 통합한 기업은 상품가격 변동이 격화하는 가운데 이익률의 회복력을 높여가고 있습니다.
세계의 질산 시장 동향과 전망
유럽 전역에서 저탄소 질산암모늄 비료 수요가 급증
유럽의 비료 제조업체는 2030년까지 수소 원료의 42%를 재생 가능하게 하는 "재생에너지 지령 III"의 요건을 충족하기 위해 재생 가능 수소로의 전환을 진행하고 있습니다. 녹색 원료 확보에 성공한 선행 기업은 공급 충격의 영향을 받기 어렵고, 스코프 3 배출량 감축을 목표로 하는 식품 소매 체인과의 판매 계약을 체결 가능합니다. 주요 제조업체는 이에 대응하여 대규모 CCS 프로젝트를 추진하고 있으며, 야라의 2026년 슬라이스 스킬 CCS 시설은 스코프 1 배출량을 대폭 삭감할 것으로 전망되고 있습니다. 이 전환은 질산 시장과 유럽 연합의 기후 목표와의 연계가 깊어지고 녹색 암모니아 회랑의 새로운 합작 투자를 촉진합니다.
EU 자동차 경량화 목표를 향한 폴리아미드 6,6 채용 확대
EU의 승용차 CO2 배출량 규제(95g/km)에 의해 금속에서 고성능 폴리머로의 대체가 진전하고 있습니다. 폴리아미드 6,6은 최대 40%의 경량화를 실현하여 구조 강도를 손상시키지 않고 EV의 항속 거리를 향상시킵니다. 질산 유도체인 아디프산이 주요 전구체이기 때문에 폴리아미드 6,6으로의 전환이 진행됨에 따라 지역의 질산 수요가 증가합니다. 서플라이 체인은 고순도 등급에 주력해, 폴리머 제조업체용 전자 그레이드 질산의 증산 계획이 우베 코산 주식회사에 의해 진행되고 있습니다. 자동차 Tier 1 공급업체는 보다 엄격한 유로 7 규정에 앞서 일관된 품질과 원료의 안정적인 공급을 보장하기 위해 질산 제조업체와 장기 수지 구매 계약을 조정 중입니다.
EU의 N2O 배출규제 강화(BAT-AEL)가 설비투자와 운영비용을 끌어올립니다.
유럽위원회에 의한 LVIC BREF(최고의 이용 가능한 기술에 관한 환경 기준 문서)의 개정 작업이 진행되고 있어 아산화질소 배출 기준이 인하될 전망입니다. 이에 따라 노후화된 설비에 있어서 개수 또는 신규 배출 억제 장치의 도입이 강요되고 있습니다. 2차 촉매 시스템 및 3차 분해 장치를 도입하려면 라인당 800만 달러를 초과하는 자본 투자가 필요하며 중견 플랜트의 이익률을 압박할 수 있습니다. BOC 리미티드의 CO2 포집·액화 플랜트와 같이, 통합형 CCS나 선진적 버너를 갖춘 사업자는 장기 공급 계약의 입찰에 있어서 코스트 우위성을 누릴 것입니다. 이 정책환경은 플랜트 폐쇄와 자산교환을 가속화하고 컴플라이언스 투자를 위한 재무적 여유를 가진 톱티어 생산자를 중심으로 질산 시장을 통합하는 방향으로 이끌고 있습니다.
부문 분석
2025년 시점에서 약질산이 시장 점유율의 57.45%를 차지해 비료나 중간체 용도에 있어서 범용성을 반영했습니다. 이 부문은 부식 관리 비용이 낮고 생산자는 최소한의 업그레이드로 단일 모노 프레셔 루프를 실행할 수 있다는 장점이 있습니다. 유럽이 약산 중화에 의존하는 질산염 방출 조절 비료를 의무화하는 가운데 약질산 관련 시장 규모는 꾸준한 확대가 예상됩니다.
다음으로 큰 점유율을 차지하는 진한 질산은 폭발물과 전자기기 수요 증가를 배경으로 CAGR 3.48%로 기세를 늘리고 있습니다. 고순도 라인의 생산 능력 증강, 특히 우베 코산 주식회사에 의한 야마구치현에서의 확장은 특수 부문의 프리미엄 획득을 목적으로 하고 있습니다. 발연 질산은 틈새 분야이지만 항공우주 추진 분야에서 전략적으로 중요한 위치를 차지하고 있습니다.
질산 시장 세분화는 농도(약질산(68% 이하), 진한 질산(68-98%), 발연/적발연(98% 초과)), 최종사용자산업(비료, 화학제조, 폭발물, 항공우주, 잉크, 안료·염료, 기타 최종사용자산업), 지역(아시아태평양, 북미, 유럽남미)
지역별 분석
아시아태평양은 2025년 질산 시장의 57.60%를 차지했고 중공업, 비료 사용량, 전자기기 제조의 동시성장에 따라 CAGR 3.62%를 나타낼 전망입니다. 중국은 환경 검사에 의해 구식 설비의 촉매 업그레이드가 추진되는 가운데 질산계 중간체에 대한 투자를 계속하고 있습니다. 인도의 디팩 퍼티라이저스사의 다해지 프로젝트는 연간 45만 톤의 종합 생산 능력을 추가해, 이 나라의 자급률 향상과 순수입량의 삭감에 공헌하고 있습니다.
유럽에서는 고에너지 비용과 엄격한 배출 규제에 의해 점유율이 축소를 계속하고 있습니다. BAT-AEL 기준의 강화에 의해 채산성이 낮은 생산자는 설비 갱신이나 철수를 강요받아 BASF나 Yara 등의 통합 대기업에 의한 생산 집약이 진행되고 있습니다. 북미는 풍부한 셰일 가스와 발전 중인 블루 암모니아 사업이 쫓겨나고 있습니다. OCI의 보몬트 공장은 2025년부터 저탄소 공급 루트를 확립해 멕시코 만안의 질산·질산염 플랜트에 공급을 개시했습니다.
남미는 구조적으로 질소 부족이 계속되고 있으며, 브라질에서는 수요의 95%를 수입으로 충당하고 있습니다. 대두 생산자가 수출용 프리미엄 인증을 추구하는 가운데, 녹색 비료의 도입은 증가 경향이 있습니다. 그러나 통화 변동과 인프라 병목 현상은 질산의 즉각적인 생산 능력 투자를 제한합니다.
기타 혜택 :
- 엑셀 형식 시장 예측(ME) 시트
- 애널리스트 서포트(3개월간)
자주 묻는 질문
목차
제1장 서론
- 조사 전제조건과 시장 정의
- 조사 범위
제2장 조사 방법
제3장 주요 요약
제4장 시장 상황
- 시장 개요
- 시장 성장 촉진요인
- 유럽 전역에 있어서 저탄소성 질산암모늄 비료 수요 급증
- EU 자동차 경량화 목표에 따른 폴리아미드 6,6(아디프산 유도체)의 채용 확대
- 인도의 질산염계 의약품 클러스터에 있어서 현장 약질산 플랜트에 대한 정부의 우대조치
- 폭발물 제조 분야 수요 증가
- 시장 성장 억제요인
- EU의 BAT-AEL 강화에 의한 N2O 배출규제의 엄격화가 설비투자(Capex)와 운영비(Opex) 증가
- 천연 가스 가격의 변동이 암모니아에서 질산으로의 마진을 압박
- 질산에 의한 건강 피해
- 밸류체인 분석
- Porter's Five Forces
- 공급기업의 협상력
- 구매자의 협상력
- 신규 참가업체의 위협
- 대체품의 위협
- 경쟁 기업 간 경쟁 관계
- 무역 흐름 분석
- 비용 분석
제5장 시장 규모와 성장 예측(금액 및 수량)
- 분야별
- 희석 질산(68% 이하)
- 농축 질산(68-98%)
- 발연 및 적색 발연(98% 이상)
- 최종 사용자 업계별
- 비료
- 화학 제조
- 폭발물
- 항공우주
- 잉크, 안료 및 염료
- 기타 최종 사용자 산업(제약 및 식품 가공)
- 지역별
- 아시아태평양
- 중국
- 인도
- 일본
- 한국
- 인도네시아
- 말레이시아
- 베트남
- 태국
- 기타 아시아태평양
- 북미
- 미국
- 캐나다
- 멕시코
- 유럽
- 독일
- 영국
- 프랑스
- 이탈리아
- 스페인
- 러시아
- 튀르키예
- 북유럽 국가
- 기타 유럽
- 남미
- 브라질
- 아르헨티나
- 콜롬비아
- 기타 남미
- 중동 및 아프리카
- 사우디아라비아
- 아랍에미리트(UAE)
- 카타르
- 나이지리아
- 이집트
- 남아프리카
- 기타 중동 및 아프리카
- 아시아태평양
제6장 경쟁 구도
- 시장 집중도
- 전략적 움직임(합병·인수, 합작 사업, 생산 능력 확장, 기술 라이선싱)
- 시장 점유율 분석
- 기업 프로파일
- Asahi Kasei Corporation
- BASF
- Borealis AG
- CF Industries Holdings, Inc.
- DFPCL
- ENAEX
- EuroChem Group
- Gujarat Narmada Valley Fertilizers & Chemicals Limited
- Hanwha Group
- TKG HUCHEMS
- INEOS
- Incitec Pivot Fertilisers Pty Ltd
- LSB Industries
- MAXAMCORP HOLDING, SL
- Mitsubishi Chemical Group Corporation
- Nutrien
- OCI Global
- Orica Limited
- Sasol
- China Petrochemical Corporation
- Sumitomo Chemical Co., Ltd.
- Yara
- UBE Corporation
제7장 시장 기회와 향후 전망
KTH 26.01.26The Nitric Acid Market was valued at 69.36 Million tons in 2025 and estimated to grow from 71.42 Million tons in 2026 to reach 82.66 Million tons by 2031, at a CAGR of 2.97% during the forecast period (2026-2031).

Sustained investments in low-carbon ammonia, widening explosives demand, and strong fertilizer offtake continue to anchor the nitric acid market, yet rising environmental compliance costs and volatile gas prices are reshaping cost curves. Europe is moving quickly toward green production methods as BAT-AEL standards tighten, while North America leverages blue ammonia projects to improve energy security. Early movers integrating carbon capture, renewable hydrogen, and advanced catalysts are gaining margin resilience as commodity price swings intensify.
Global Nitric Acid Market Trends and Insights
Surging Demand for Low-Carbon Ammonium-Nitrate Fertilisers Across Europe
Europe's fertilizer producers are pivoting toward renewable hydrogen to satisfy the Renewable Energy Directive III requirement that 42% of hydrogen input be renewable by 2030. Early adopters with secured green feedstock face fewer supply shocks and can lock in offtake agreements with food-retail chains seeking lower scope-3 emissions. Leading producers have responded by advancing large-scale CCS projects, with Yara's 2026 Sluiskil CCS facility expected to materially lower Scope 1 emissions. The shift deepens the link between the nitric acid market and the European Union's climate targets, encouraging new joint ventures in green ammonia corridors.
Rising Adoption of Polyamide 6,6 for EU Automotive Lightweighting Targets
The EU passenger-car CO2 cap of 95 g/km is intensifying the substitution of metals with high-performance polymers. Polyamide 6,6 delivers up to 40% weight savings, improving EV range without compromising structural integrity. Because adipic acid, a nitric acid derivative, remains the main precursor, every incremental shift to polyamide 6,6 boosts regional nitric acid demand. Supply chains are refocusing on high-purity grades, prompting planned capacity additions by UBE Corporation for electronic-grade nitric acid to serve polymer producers. Automotive Tier-1 suppliers are aligning long-term resin offtake contracts with nitric acid producers to secure consistent quality and feedstock reliability ahead of stricter Euro 7 regulations.
EU BAT-AEL Tightening for N2O Emissions Raising Capex and Opex
The European Commission's ongoing revision of the LVIC BREF sets lower nitrous oxide benchmarks, compelling retrofits or new abatement installations across aging assets. Capital requirements for secondary-catalyst systems or tertiary destruction units can exceed USD 8 million per line, eroding margins on middle-aged plants. Operators with integrated CCS or advanced burners, such as BOC Limited's CO2 Recovery and Liquefaction plant, enjoy a cost advantage when bidding long-term supply contracts. The policy environment accelerates plant closures or asset swaps, consolidating the nitric acid market around top-tier producers with balance-sheet capacity for compliance investments.
Other drivers and restraints analyzed in the detailed report include:
- Government Incentives for On-Site Weak Nitric Acid Plants in Indian Pharma Clusters
- Increasing Demand from Explosives Manufacturing
- Volatile Natural Gas Prices Squeezing Ammonia-to-Nitric-Acid Margins
For complete list of drivers and restraints, kindly check the Table Of Contents.
Segment Analysis
Weak nitric acid commanded 57.45% of the market share in 2025, reflecting its versatility in fertilizer and intermediate applications. The segment benefits from lower corrosion management expenses, enabling producers to operate single mono-pressure loops with minimal upgrading. The nitric acid market size tied to weak grades is expected to advance steadily as Europe mandates controlled nitrate release fertilizers that rely on weak acid neutralization.
Concentrated nitric acid, accounting for the next-largest volume slice, is gaining momentum at a 3.48% CAGR on the back of rising explosives and electronics requirements. Capacity additions in high-purity lines, notably UBE's expansion in Yamaguchi Prefecture, aim to capture specialty segment premiums. Fuming nitric acid remains niche yet strategically significant for aerospace propulsion.
The Nitric Acid Market Segments the Industry by Concentration (Weak Nitric Acid (less Than or Equal To 68%), Concentrated Nitric Acid (68 To 98%), and Fuming/Red Fuming (more Than 98%)), End-User Industry (Fertilizers, Chemical Manufacturing, Explosives, Aerospace, Inks, Pigments, and Dyes, and Other End-User Industries), and Geography (Asia-Pacific, North America, Europe, South America, and Middle-East and Africa).
Geography Analysis
Asia-Pacific commands 57.60% of the nitric acid market in 2025 and is expanding at 3.62% CAGR as heavy industry, fertilizer usage, and electronics manufacturing grow in tandem. China continues to invest in nitric-based intermediates, though environmental inspections are pushing older units toward catalytic upgrades. India's Dahej project by Deepak Fertilisers adds 450 KTPA combined capacity, lifting the country's self-reliance ratio and reducing net imports.
Europe's share continues to shrink under high energy costs and stringent emission controls. The tightening BAT-AEL limits will push marginal producers either to retrofit or exit, consolidating output among integrated giants such as BASF and Yara. North America benefits from abundant shale gas and evolving blue ammonia ventures. OCI's Beaumont facility adds a low-carbon supply corridor that feeds Gulf Coast nitric and nitrate plants from 2025.
South America remains structurally short on nitrogen, with 95% of Brazil's needs met via imports. Green-fertilizer uptake is rising as soybean producers pursue premium export certifications. However, currency volatility and infrastructure bottlenecks restrict immediate capacity investments in nitric acid.
- Asahi Kasei Corporation
- BASF
- Borealis AG
- CF Industries Holdings, Inc.
- DFPCL
- ENAEX
- EuroChem Group
- Gujarat Narmada Valley Fertilizers & Chemicals Limited
- Hanwha Group
- TKG HUCHEMS
- INEOS
- Incitec Pivot Fertilisers Pty Ltd
- LSB Industries
- MAXAMCORP HOLDING, SL
- Mitsubishi Chemical Group Corporation
- Nutrien
- OCI Global
- Orica Limited
- Sasol
- China Petrochemical Corporation
- Sumitomo Chemical Co., Ltd.
- Yara
- UBE Corporation
Additional Benefits:
- The market estimate (ME) sheet in Excel format
- 3 months of analyst support
TABLE OF CONTENTS
1 Introduction
- 1.1 Study Assumptions and Market Definition
- 1.2 Scope of the Study
2 Research Methodology
3 Executive Summary
4 Market Landscape
- 4.1 Market Overview
- 4.2 Market Drivers
- 4.2.1 Surging Demand for Low-Carbon Ammonium-Nitrate Fertilisers Across Europe
- 4.2.2 Rising Adoption of Polyamide 6,6 (Adipic-Acid Derivative) for EU Automotive Lightweighting Targets
- 4.2.3 Government Incentives for On-Site Weak Nitric-Acid Plants in Indian Nitrate-Based Pharma Clusters
- 4.2.4 Increasing Demand from Explosives Manufacturing
- 4.3 Market Restraints
- 4.3.1 EU BAT-AEL Tightening for N?O Emissions Raising Capex and Opex
- 4.3.2 Volatile Natural-Gas Prices Squeezing Ammonia-to-Nitric-Acid Margins
- 4.3.3 Health Hazards Caused by Nitric Acid
- 4.4 Value Chain Analysis
- 4.5 Porter's Five Forces
- 4.5.1 Bargaining Power of Suppliers
- 4.5.2 Bargaining Power of Buyers
- 4.5.3 Threat of New Entrants
- 4.5.4 Threat of Substitutes
- 4.5.5 Intensity of Competitive Rivalry
- 4.6 Trade Flow Analysis
- 4.7 Cost Analysis
5 Market Size and Growth Forecasts (Value and Volume)
- 5.1 By Concentration
- 5.1.1 Weak Nitric Acid (less than or equal to 68%)
- 5.1.2 Concentrated Nitric Acid (68 to 98%)
- 5.1.3 Fuming/Red Fuming (more than 98%)
- 5.2 By End-user Industry
- 5.2.1 Fertilisers
- 5.2.2 Chemical Manufacturing
- 5.2.3 Explosives
- 5.2.4 Aerospace
- 5.2.5 Inks, Pigments and Dyes
- 5.2.6 Other End-user Industries (Pharmaceuticals and Food Processing)
- 5.3 By Geography
- 5.3.1 Asia-Pacific
- 5.3.1.1 China
- 5.3.1.2 India
- 5.3.1.3 Japan
- 5.3.1.4 South Korea
- 5.3.1.5 Indonesia
- 5.3.1.6 Malaysia
- 5.3.1.7 Vietnam
- 5.3.1.8 Thailand
- 5.3.1.9 Rest of Asia-Pacific
- 5.3.2 North America
- 5.3.2.1 United States
- 5.3.2.2 Canada
- 5.3.2.3 Mexico
- 5.3.3 Europe
- 5.3.3.1 Germany
- 5.3.3.2 United Kingdom
- 5.3.3.3 France
- 5.3.3.4 Italy
- 5.3.3.5 Spain
- 5.3.3.6 Russia
- 5.3.3.7 Turkey
- 5.3.3.8 Nordic
- 5.3.3.9 Rest of Europe
- 5.3.4 South America
- 5.3.4.1 Brazil
- 5.3.4.2 Argentina
- 5.3.4.3 Colombia
- 5.3.4.4 Rest of South America
- 5.3.5 Middle-East and Africa
- 5.3.5.1 Saudi Arabia
- 5.3.5.2 United Arab Emirates
- 5.3.5.3 Qatar
- 5.3.5.4 Nigeria
- 5.3.5.5 Egypt
- 5.3.5.6 South Africa
- 5.3.5.7 Rest of Middle-East and Africa
- 5.3.1 Asia-Pacific
6 Competitive Landscape
- 6.1 Market Concentration
- 6.2 Strategic Moves (Mergers and Acquisitions, JVs, Capacity Expansions, Tech Licensing)
- 6.3 Market Share Analysis
- 6.4 Company Profiles (includes Global level Overview, Market level overview, Core Segments, Financials as available, Strategic Information, Market Rank/Share, Products and Services, Recent Developments)
- 6.4.1 Asahi Kasei Corporation
- 6.4.2 BASF
- 6.4.3 Borealis AG
- 6.4.4 CF Industries Holdings, Inc.
- 6.4.5 DFPCL
- 6.4.6 ENAEX
- 6.4.7 EuroChem Group
- 6.4.8 Gujarat Narmada Valley Fertilizers & Chemicals Limited
- 6.4.9 Hanwha Group
- 6.4.10 TKG HUCHEMS
- 6.4.11 INEOS
- 6.4.12 Incitec Pivot Fertilisers Pty Ltd
- 6.4.13 LSB Industries
- 6.4.14 MAXAMCORP HOLDING, SL
- 6.4.15 Mitsubishi Chemical Group Corporation
- 6.4.16 Nutrien
- 6.4.17 OCI Global
- 6.4.18 Orica Limited
- 6.4.19 Sasol
- 6.4.20 China Petrochemical Corporation
- 6.4.21 Sumitomo Chemical Co., Ltd.
- 6.4.22 Yara
- 6.4.23 UBE Corporation
7 Market Opportunities and Future Outlook
- 7.1 White-space and Unmet-Need Assessment
- 7.2 Technological Developments in Nitric Acid Manufacturing and Recent Government Incentives
