
|
시장보고서
상품코드
1910920
보험 분석 : 시장 점유율 분석, 업계 동향 및 통계, 성장 예측(2026-2031년)Insurance Analytics - Market Share Analysis, Industry Trends & Statistics, Growth Forecasts (2026 - 2031) |
||||||
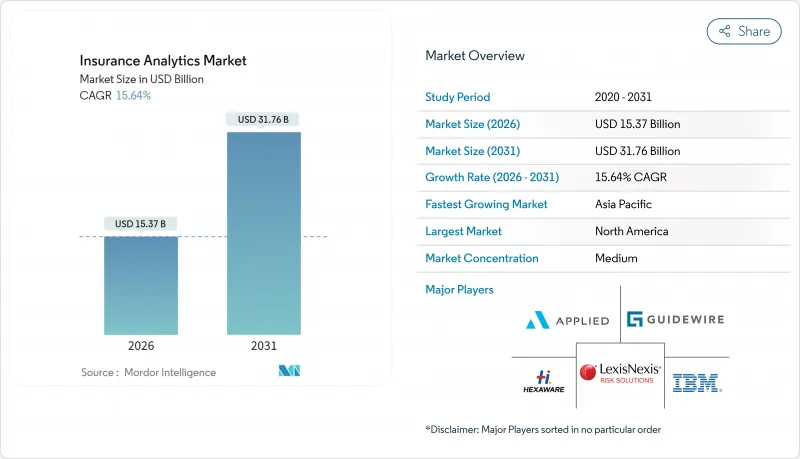
보험 분석 시장은 2025년 132억 9,000만 달러에서 2026년에는 153억 7,000만 달러로 성장해 2026년부터 2031년에 걸쳐 CAGR 15.64%를 나타낼 전망입니다. 2031년까지 317억 6,000만 달러에 달할 것으로 예상됩니다.
시장 확대의 배경은 실시간 지불 능력 보고에 대한 규제 요구 증가, IoT 디바이스로부터의 데이터 스트림의 급속한 증가, 보험 회사의 인수·보험금 청구 업무의 효율화 요구를 들 수 있습니다. 기후 리스크 정량화의 요구 강화, 임베디드 보험 파트너십 증가, 클라우드 툴의 보급으로 기업 규모에 관계없이 도입이 확대되고 있습니다. 기존 테크놀로지 공급업체는 생성형 AI를 기간 시스템에 직접 통합하여 점유율을 지키려고 하는 한편, 보험 테크의 신규 참가 기업은 부정 행위 대책, 파라메트릭 보험, 건강 상태에 기초한 생명 보험 인수 등 틈새 분석 분야에서 규모를 확대하고 있습니다. 지속적인 데이터 프라이버시 의무와 액추어리 데이터 사이언스 인력 부족이 성장을 억제하고 있는 것, 보험 분석 시장은 특히 북미 및 유럽 연합(EU)에서 규제 당국이 AI 거버넌스의 틀을 명확히 하고 있기 때문에 계속 혜택을 받고 있습니다.
세계의 보험 분석 시장 동향과 인사이트
첨단 기술 채택 확대
보험사는 2024년에 AI 도입을 가속시켜 자동차보험사의 88%, 주택보험사의 70%, 생명보험사의 58%가 AI를 활용한 업무 운영으로 이행했습니다. IBM 등의 공급업체는 생성 모델을 인수·보험금 청구 워크플로우에 임베디드해, 자동 손해 평가와 최적 제안의 자동화를 실현하고 있습니다. 클라우드 퍼스트 플랫폼은 현재 비구조화된 이미지 및 텍스트 센서 스트림을 처리하는 컴퓨터 비전, 그래프 및 대규모 언어 모델 기능을 패키징하고 이를 실시간 위험 점수로 변환합니다. NAIC에서 EIOPA에 이르는 규제 당국은 기업이 공정성, 투명성, 이사회의 감독을 문서화할 때 AI 사용을 용인하는 자세를 나타냈습니다. 그 결과 AI 대응 인프라에 대한 기업 지출이 급증하여 보험 분석 시장을 더욱 활성화시켰습니다.
보험사 간 경쟁 격화
AI 가격설정 엔진을 무기로 하는 디지털 전업의 신흥 기업이 기존 기업의 이익률을 계속 압박하고 있으며, 전통적인 보험 회사는 제품 사이클의 단축과 보상 내용의 개별화를 강요받고 있습니다. 벤처 캐피탈의 자금은 실시간 데이터 수집을 활용하여 초단기 보험과 P2P 보험 상품을 전개하는 풀 스택형 인슈어텍 기업으로 이동했습니다. 기존 기업은 인수와 전략적 제휴를 통해 대응하고, 크로스 채널에서의 데이터 가시성을 확보하면서 현대화를 가속시키고 있습니다. 경쟁 격화로 인해 경영진의 우선사항은 채널 확대에서 분석에 의한 차별화로 전환하여 모듈형 리스크 스코어링 API와 클라우드 네이티브 데이터 패브릭에 대한 수요가 가속화되고 있습니다.
엄격한 데이터 프라이버시 및 거버넌스 규정
EU의 AI법 및 GDPR(EU 개인정보보호규정)은 많은 보험 분석 기능을 고위험으로 분류하고 설명 가능성 평가, 데이터 세트 문서화 및 도입 후 모니터링을 의무화합니다. 미국 각 주에서 유사한 규제 수립을 통해 보험 회사는 모델 리스크 관리 인증을 제출해야 하며 프로젝트 타임라인과 규정 준수 예산이 확대되고 있습니다. 다국적 보험사는 관할 구역을 가로지르는 통제의 조화를 도모해야 하며 데이터 계보의 자동 기록이나 바이어스 검출을 자동화할 수 없는 분석 플랫폼의 총 소유 비용을 밀어 올리고 있습니다. 이러한 컴플라이언스 부담은 특히 중소규모 기업에서 도입을 늦추고 예측 CAGR을 2.1포인트 내리고 있습니다.
부문 분석
2025년 보험 분석 시장 규모 중 툴 분야는 90억 1,000만 달러(67.79%의 점유율)를 차지했습니다. 이는 보험사가 데이터 자산에 대한 전략적 통제권을 보유하는 것을 선호한다는 것을 반영합니다. 서비스 분야는 규모가 작은 것으로 보험사가 AI 거버넌스 프레임워크나 멀티 클라우드 최적화에 관한 전문가의 지도를 요구하는 가운데 14.6%의 연평균 복합 성장률(CAGR)로 확대하고 있습니다. 공급업체는 로우코드 모델 관리 대시보드와 사전 구축된 리스크 라이브러리를 통합하고 있지만 보험 회사는 여전히 시스템 통합사업자에 의존하고 이러한 기능을 레거시 기간 시스템에 추가로 도입하고 있습니다. 손실률 개선에 연동하는 컨설팅 요금 체계인 성과 연동형 가격 설정으로의 전환이 서비스 성장을 더욱 뒷받침하고 있습니다.
이종 혼합 보험 계약 관리 시스템을 운영하는 기업은 고비용 플랫폼 재구성을 피하기 위해 데이터 전략 워크숍, 모델 검증 연습, 규제 보고서 자동화 등의 서비스를 선택하는 경향이 있습니다. 한편, 중소기업은 임베디드 지침을 제공하는 패키지형 분석 제품군을 선호합니다. 이를 통해 보험 분석 시장에서 서비스와 도구가 서로 보완되고 경쟁하지 않는 구조가 드러납니다.
2025년 시점에서 보험 분석 시장의 34.12%를 차지한 것은 클레임 관리 분야이며, 조정 담당자의 생산성과 고객 만족도 지표를 향상시키는 스트레이트 스루프 로세싱 엔진이 핵심을 이루었습니다. 그러나 보험사가 비정상적인 감지 네트워크를 도입하고 의심스러운 클레임을 몇 초 안에 파악하여 손실 비용을 두 자리 퍼센트 줄일 수 있기 때문에 사기 감지 솔루션은 18.95%의 연평균 복합 성장률(CAGR)로 확대될 것으로 예측됩니다. 통합된 이미지 감각 및 행동 분석 모듈은 조사주기를 더욱 단축하고 재무 책임자에게 호소하는 투자 수익률(ROI)의 스토리를 구축합니다.
성장의 기세는 타사 데이터 브로커와 원활하게 작동하는 API 첫 번째 부정 감지 플랫폼에서도 발생합니다. 이를 통해 대규모 내부 엔지니어링 없이 위험 신호를 강화할 수 있습니다. 예측 기간 동안 머신러닝 기반의 사기 감지 유틸리티는 파일럿 프로젝트에서 기업 표준으로 전환하고 규제 당국이 사기 방지 대책의 의무화를 진행하는 동안 보험 분석 시장을 재구성할 것입니다.
보험 분석 시장 보고서는 업계를 이하의 요소로 부문화하고 있습니다.구성 요소별(툴과 서비스), 비즈니스 용도별(클레임 관리, 리스크 관리 등), 도입 모드별(On-Premise, 클라우드), 최종 사용자별(보험사 등), 보험 종별(생명·건강 보험, 손해 보험 등), 조직 규모별(대기업, 중소기업 등) 시장 예측은 금액 기준(달러)으로 제공됩니다.
지역별 분석
북미는 2025년 38.02%의 수익 점유율로 보험 분석 시장을 선도했습니다. 이는 탄탄한 클라우드 도입, 깊은 자본 시장, 규제의 명확화와 기술 투자 판단의 가속을 초래하는 NAIC(전미보험감독관협회)의 AI 모델 통달에 뒷받침된 것입니다. 미국의 보험사는 성숙한 인슈어텍 자금조달 파이프라인과 전문 데이터 공급업체에 대한 간편한 액세스로 혜택을 누리고 있으며 캐나다 기업들은 국경을 넘어선 기술 파트너십을 활용하여 인력을 비례적으로 늘리지 않고도 분석 능력을 확장하고 있습니다.
아시아태평양은 중국, 인도, 동남아시아에서 디지털 보험의 침투 가속을 원동력으로 2031년까지 16.25%의 연평균 복합 성장률(CAGR)을 나타낼 것으로 예측되고 있습니다. 지역 내 기존 기업은 하이퍼스케일러와 연계하여 주행 거리에 따른 자동차 보험과 단기 여행 보험을 잇따라 도입하고 있습니다. 둘 다 실시간 데이터 수집에 의존하는 메커니즘입니다. 싱가포르와 한국 정부는 규제 샌드박스를 제공하고 상품 실험을 촉진함으로써 보험 분석 시장 확대의 비옥한 환경을 키우고 있습니다.
유럽에서는 GDPR(EU 개인정보보호규정) 및 EU AI 법의 엄격한 규정 준수 요건에도 불구하고 균형 잡힌 성장을 유지하고 있습니다. 독일, 프랑스, 영국의 보험 회사는 규제 당국의 요구를 충족하면서 인수 분석에 대한 지식을 이끌어내기 위해 설명 가능한 AI 도구에 많은 투자를 하고 있습니다. 북유럽 보험사는 분석 분야의 선구자로서 기후 시나리오 생성 툴과 임베디드 보험 오케스트레이션층의 시험 운용을 진행하고 있으며, 이들이 유럽 전역에서의 보급을 형성할 가능성이 있습니다.
기타 혜택 :
- 엑셀 형식 시장 예측(ME) 시트
- 애널리스트 서포트(3개월간)
자주 묻는 질문
목차
제1장 서론
- 조사 전제조건과 시장 정의
- 조사 범위
제2장 조사 방법
제3장 주요 요약
제4장 시장 인사이트
- 시장 개요
- 시장 성장 촉진요인
- 선진 기술 채용 확대
- 보험 회사 간의 경쟁 격화
- 증대하는 내부·외부 데이터 스트림의 양
- 기후위험의 정량화 요구
- 임베디드 보험 생태계 확대
- 실시간 지불 능력보고를 위한 규제 추진
- 시장 성장 억제요인
- 엄격한 데이터 프라이버시 및 거버넌스 규제
- 사이버 보안과 데이터 침해에 대한 우려 증가
- 액추어리 데이터 사이언스 인력 부족
- 공급업체 록인과 데이터 이식성의 제한
- 밸류체인 분석
- 규제 상황
- 기술 전망
- Porter's Five Forces
- 공급기업의 협상력
- 구매자의 협상력
- 신규 참가업체의 위협
- 대체품의 위협
- 경쟁 기업 간 경쟁 관계
- 업계 생태계 분석
- 주요 이용 사례와 사례 연구
- 거시 경제 동향 평가
- 투자분석
제5장 시장 세분화
- 구성 요소별
- 도구
- 서비스
- 비즈니스 용도별
- 클레임 관리
- 리스크 관리
- 사기 탐지 및 예방
- 프로세스 최적화
- 고객 관리 및 개인화
- 배포 모드별
- On-Premise
- 클라우드
- 최종 사용자별
- 보험사
- 정부기관
- 제3자 관리자, 중개사 및 컨설팅 회사
- 보험 유형별
- 생명 및 건강
- 재산 및 상해
- 자동차
- 특수 보험
- 조직 규모별
- 대기업
- 중소기업(SME)
- 지역별
- 북미
- 미국
- 캐나다
- 멕시코
- 남미
- 브라질
- 아르헨티나
- 콜롬비아
- 기타 남미
- 유럽
- 독일
- 영국
- 프랑스
- 이탈리아
- 스페인
- 러시아
- 네덜란드
- 기타 유럽
- 아시아태평양
- 중국
- 일본
- 한국
- 인도
- 호주
- 싱가포르
- 기타 아시아태평양
- 중동 및 아프리카
- 중동
- 사우디아라비아
- 아랍에미리트(UAE)
- 기타 중동
- 아프리카
- 남아프리카
- 이집트
- 기타 아프리카
- 중동
- 북미
제6장 경쟁 구도
- 시장 집중도
- 전략적 동향
- 시장 점유율 분석
- 기업 프로파일
- IBM Corporation
- Oracle Corporation
- SAP SE
- SAS Institute Inc.
- Microsoft Corporation
- Guidewire Software Inc.
- LexisNexis Risk Solutions(RELX plc)
- Hexaware Technologies Ltd.
- Applied Systems Inc.
- Sapiens International Corporation NV
- OpenText Corporation
- MicroStrategy Incorporated
- Verisk Analytics, Inc.
- Salesforce, Inc.(Tableau)
- Accenture plc
- Cognizant Technology Solutions Corp.
- BAE Systems plc
- Palantir Technologies Inc.
- Fair Isaac Corporation(FICO)
- DataRobot, Inc.
- Optum, Inc.(UnitedHealth Group)
제7장 시장 기회와 향후 전망
KTH 26.01.26The insurance analytics market is expected to grow from USD 13.29 billion in 2025 to USD 15.37 billion in 2026 and is forecast to reach USD 31.76 billion by 2031 at 15.64% CAGR over 2026-2031.
Market expansion is underpinned by mounting regulatory demands for real-time solvency reporting, rapid data-stream proliferation from IoT devices, and insurers' need to streamline underwriting and claims workflows. Heightened climate-risk quantification requirements, rising embedded-insurance partnerships, and the democratization of cloud tools have widened adoption across organization sizes. Incumbent technology vendors are defending share by embedding generative AI directly into core systems, while insurtech entrants scale niche analytics that target fraud, parametric cover, and wellness-based life underwriting. Persistent data-privacy obligations and a tightening actuarial-data-science talent pool temper growth, yet the insurance analytics market continues to benefit from regulators clarifying AI governance frameworks, especially in North America and the European Union.
Global Insurance Analytics Market Trends and Insights
Increased Adoption of Advanced Technologies
Insurers accelerated AI deployment in 2024, with 88% of auto, 70% of home, and 58% of life carriers moving toward AI-enabled operations. Vendors such as IBM embedded generative models into underwriting and claims workflows, enabling automated damage assessment and next-best-offer recommendations . Cloud-first platforms now package computer-vision, graph, and large-language-model capabilities that handle unstructured image, text, and sensor streams, converting them into real-time risk scores. Regulatory bodies from the NAIC to EIOPA signaled acceptance of AI usage when firms document fairness, transparency, and board oversight. Consequently, enterprise spending on AI-ready infrastructure rose sharply, further fueling the insurance analytics market.
Rise in Competition Among Insurers
Digital-only challengers armed with AI pricing engines continue to pressure incumbent margins, forcing traditional carriers to shorten product cycles and personalize coverage. Venture capital funding shifted toward full-stack insurtechs that leverage real-time data ingestion to launch micro-duration or peer-to-peer products. Incumbents responded through acquisitions and strategic partnerships that fast-track modernization while securing cross-channel data visibility. Competitive intensity has reoriented C-suite priorities from channel expansion to analytical differentiation, accelerating demand for modular risk-scoring APIs and cloud-native data fabrics.
Stringent Data-Privacy and Governance Regulations
The EU AI Act and GDPR classify many insurance analytics functions as high risk, mandating explainability assessments, dataset documentation, and post-deployment monitoring. Similar rulemaking in U.S. states obliges carriers to file model-risk-management attestations, extending project timelines and compliance budgets. Multinational carriers must harmonize controls across jurisdictions, driving up the total cost of ownership for analytics platforms that cannot automate lineage logging or bias detection. These compliance burdens slow deployment, particularly for smaller firms, and subtract 2.1 percentage points from forecast CAGR.
Other drivers and restraints analyzed in the detailed report include:
- Growing Volume of Internal and External Data Streams
- Climate-Risk Quantification Demands
- High Concern Over Cybersecurity and Data Breaches
For complete list of drivers and restraints, kindly check the Table Of Contents.
Segment Analysis
Tools contributed USD 9.01 billion to the insurance analytics market size in 2025, equating to 67.79% share and reflecting carriers' preference for retaining strategic control of data assets. Services, although smaller, are scaling at 14.6% CAGR as insurers seek expert guidance for AI-governance frameworks and multi-cloud optimization. Vendors integrate low-code model-management dashboards and pre-built risk libraries, but carriers still rely on systems integrators to retrofit these capabilities into legacy cores. The push toward outcome-based pricing, where consultancy fees hinge on loss-ratio improvements, further underpins services growth.
Enterprises with heterogeneous policy-administration stacks often choose services to avoid costly platform rewrites, engaging providers for data-strategy workshops, model-validation exercises, and regulatory-filing automation. Meanwhile, SMEs favor packaged analytics suites that offer embedded guidance, illustrating how services and tools complement rather than cannibalize each other in the insurance analytics market.
Claims management held a 34.12% insurance analytics market share in 2025, anchored by straight-through-processing engines that boost adjuster productivity and customer satisfaction metrics. Yet fraud detection solutions are projected to scale at a 18.95% CAGR, as carriers deploy anomaly-detection networks that flag suspicious claims within seconds, helping to cut loss costs by double-digit percentages. Integrated image-forensics and behavioral-analytics modules further compress investigation cycles, driving ROI narratives that appeal to finance chiefs.
Growth momentum also arises from API-first fraud platforms that connect seamlessly with third-party data brokers, enriching risk signals without extensive in-house engineering. Over the forecast period, machine-learning-based fraud utilities will migrate from pilot projects to enterprise standards, reshaping the insurance analytics market as regulatory bodies mandate anti-fraud controls.
Insurance Analytics Market Report Segments the Industry Into by Component (Tools and Services), Business Application (Claims Management, Risk Management, and More), Deployment Mode (On-Premise, Cloud), End-User (Insurance Companies, and More), Insurance Line (Life and Health, Property and Casualty, and More), Organization Size (Large Enterprises, and SMEs), and Geography. The Market Forecasts are Provided in Terms of Value (USD).
Geography Analysis
North America led the insurance analytics market with 38.02% revenue share in 2025, buoyed by robust cloud adoption, deep capital markets, and the NAIC's AI Model Bulletin, which provides regulatory clarity and accelerates tech-investment decisions. U.S. carriers benefit from mature insurtech funding pipelines and ready access to specialized data vendors, while Canadian firms leverage cross-border technology partnerships to extend analytic capabilities without proportional head-count increases.
Asia-Pacific is projected to post a 16.25% CAGR through 2031, driven by accelerating digital-insurance penetration in China, India, and Southeast Asia. Regional incumbents collaborate with hyper-scalers to launch pay-as-you-drive auto cover and micro-duration travel policies, both reliant on real-time data ingestion. Governments in Singapore and South Korea provide regulatory sandboxes that stimulate product experimentation, thereby fostering a fertile environment for insurance analytics market expansion.
Europe maintains balanced growth despite stringent GDPR and EU AI Act compliance requirements. Carriers in Germany, France, and the United Kingdom invest heavily in explainable-AI tooling to satisfy regulators while unlocking underwriting insights. Nordic insurers act as analytics bellwethers, piloting climate-scenario generators and embedded-insurance orchestration layers that could shape wider continental adoption.
- IBM Corporation
- Oracle Corporation
- SAP SE
- SAS Institute Inc.
- Microsoft Corporation
- Guidewire Software Inc.
- LexisNexis Risk Solutions (RELX plc)
- Hexaware Technologies Ltd.
- Applied Systems Inc.
- Sapiens International Corporation N.V.
- OpenText Corporation
- MicroStrategy Incorporated
- Verisk Analytics, Inc.
- Salesforce, Inc. (Tableau)
- Accenture plc
- Cognizant Technology Solutions Corp.
- BAE Systems plc
- Palantir Technologies Inc.
- Fair Isaac Corporation (FICO)
- DataRobot, Inc.
- Optum, Inc. (UnitedHealth Group)
Additional Benefits:
- The market estimate (ME) sheet in Excel format
- 3 months of analyst support
TABLE OF CONTENTS
1 INTRODUCTION
- 1.1 Study Assumptions and Market Definition
- 1.2 Scope of the Study
2 RESEARCH METHODOLOGY
3 EXECUTIVE SUMMARY
4 MARKET INSIGHTS
- 4.1 Market Overview
- 4.2 Market Drivers
- 4.2.1 Increased adoption of advanced technologies
- 4.2.2 Rise in competition among insurers
- 4.2.3 Growing volume of internal and external data streams
- 4.2.4 Climate-risk quantification demands
- 4.2.5 Embedded-insurance ecosystem expansion
- 4.2.6 Regulatory push toward real-time solvency reporting
- 4.3 Market Restraints
- 4.3.1 Stringent data-privacy and governance regulations
- 4.3.2 High concern over cybersecurity and data breaches
- 4.3.3 Actuarial-data-science talent gap
- 4.3.4 Vendor lock-in and data-portability limitations
- 4.4 Value Chain Analysis
- 4.5 Regulatory Landscape
- 4.6 Technological Outlook
- 4.7 Porter's Five Forces
- 4.7.1 Bargaining Power of Suppliers
- 4.7.2 Bargaining Power of Buyers
- 4.7.3 Threat of New Entrants
- 4.7.4 Threat of Substitutes
- 4.7.5 Competitive Rivalry
- 4.8 Industry Ecosystem Analysis
- 4.9 Key Use Cases and Case Studies
- 4.10 Assessment of Macroeconomic Trends
- 4.11 Investment Analysis
5 MARKET SEGMENTATION
- 5.1 By Component
- 5.1.1 Tools
- 5.1.2 Services
- 5.2 By Business Application
- 5.2.1 Claims Management
- 5.2.2 Risk Management
- 5.2.3 Fraud Detection and Prevention
- 5.2.4 Process Optimization
- 5.2.5 Customer Management and Personalization
- 5.3 By Deployment Mode
- 5.3.1 On-Premise
- 5.3.2 Cloud
- 5.4 By End-User
- 5.4.1 Insurance Companies
- 5.4.2 Government Agencies
- 5.4.3 Third-Party Administrators, Brokers and Consultancies
- 5.5 By Insurance Line
- 5.5.1 Life and Health
- 5.5.2 Property and Casualty
- 5.5.3 Auto
- 5.5.4 Specialty Lines
- 5.6 By Organization Size
- 5.6.1 Large Enterprises
- 5.6.2 Small and Medium Enterprises (SMEs)
- 5.7 By Geography
- 5.7.1 North America
- 5.7.1.1 United States
- 5.7.1.2 Canada
- 5.7.1.3 Mexico
- 5.7.2 South America
- 5.7.2.1 Brazil
- 5.7.2.2 Argentina
- 5.7.2.3 Colombia
- 5.7.2.4 Rest of South America
- 5.7.3 Europe
- 5.7.3.1 Germany
- 5.7.3.2 United Kingdom
- 5.7.3.3 France
- 5.7.3.4 Italy
- 5.7.3.5 Spain
- 5.7.3.6 Russia
- 5.7.3.7 Netherlands
- 5.7.3.8 Rest of Europe
- 5.7.4 Asia-Pacific
- 5.7.4.1 China
- 5.7.4.2 Japan
- 5.7.4.3 South Korea
- 5.7.4.4 India
- 5.7.4.5 Australia
- 5.7.4.6 Singapore
- 5.7.4.7 Rest of Asia-Pacific
- 5.7.5 Middle East and Africa
- 5.7.5.1 Middle East
- 5.7.5.1.1 Saudi Arabia
- 5.7.5.1.2 United Arab Emirates
- 5.7.5.1.3 Rest of Middle East
- 5.7.5.2 Africa
- 5.7.5.2.1 South Africa
- 5.7.5.2.2 Egypt
- 5.7.5.2.3 Rest of Africa
- 5.7.5.1 Middle East
- 5.7.1 North America
6 COMPETITIVE LANDSCAPE
- 6.1 Market Concentration
- 6.2 Strategic Moves
- 6.3 Market Share Analysis
- 6.4 Company Profiles (includes Global level Overview, Market level overview, Core Segments, Financials as available, Strategic Information, Market Rank/Share for key companies, Products and Services, and Recent Developments)
- 6.4.1 IBM Corporation
- 6.4.2 Oracle Corporation
- 6.4.3 SAP SE
- 6.4.4 SAS Institute Inc.
- 6.4.5 Microsoft Corporation
- 6.4.6 Guidewire Software Inc.
- 6.4.7 LexisNexis Risk Solutions (RELX plc)
- 6.4.8 Hexaware Technologies Ltd.
- 6.4.9 Applied Systems Inc.
- 6.4.10 Sapiens International Corporation N.V.
- 6.4.11 OpenText Corporation
- 6.4.12 MicroStrategy Incorporated
- 6.4.13 Verisk Analytics, Inc.
- 6.4.14 Salesforce, Inc. (Tableau)
- 6.4.15 Accenture plc
- 6.4.16 Cognizant Technology Solutions Corp.
- 6.4.17 BAE Systems plc
- 6.4.18 Palantir Technologies Inc.
- 6.4.19 Fair Isaac Corporation (FICO)
- 6.4.20 DataRobot, Inc.
- 6.4.21 Optum, Inc. (UnitedHealth Group)
7 MARKET OPPORTUNITIES AND FUTURE OUTLOOK
- 7.1 White-space and Unmet-Need Assessment
