
|
시장보고서
상품코드
1911320
플렉스 연료 차량 : 시장 점유율 분석, 업계 동향과 통계, 성장 예측(2026-2031년)Flex-fuel Vehicle - Market Share Analysis, Industry Trends & Statistics, Growth Forecasts (2026 - 2031) |
||||||
플렉스 연료 차량 시장 규모는 2026년 1조 1,028억 8,000만 달러로 평가되었고, 2025년 1조 1,300억 달러에서 성장한 수치입니다. 2031년의 예측으로는 9,761억 2,000만 달러로, 2026-2031년에 걸쳐 CAGR -2.4%로 축소될 전망입니다.
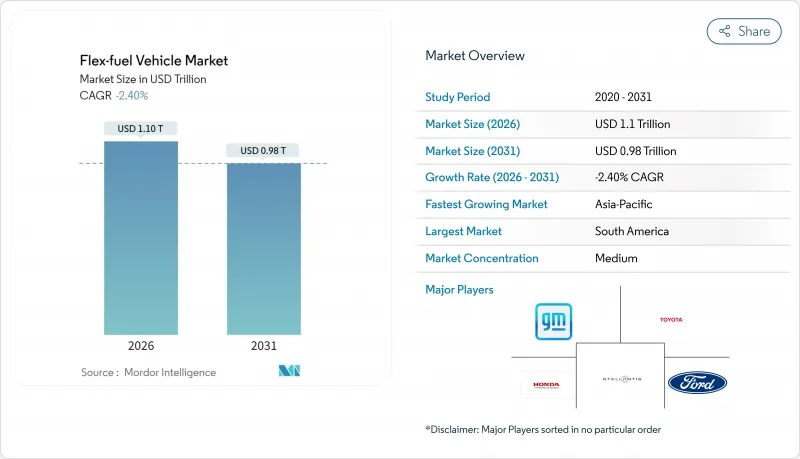
이러한 하락세는 자동차 업계의 배터리 전기 구동계로의 가속화된 전환과 바이오연료 혼합보다 배기가스 제로 솔루션을 선호하는 강화된 규제를 반영합니다. 전기 플랫폼이 신차 투자 대부분을 차지함에 따라 OEM들은 자본 배분을 재검토하고 있으며, 유럽연합의 2035년 내연기관 단계적 폐지 및 중국의 NEV 할당량과 같은 정책 수단이 구조적 역풍을 심화시키고 있습니다. 남미는 브라질의 레노바바이오(RenovaBio) 탄소 크레딧 인센티브를 기반으로 플렉스 연료 차량 시장의 거점으로 남아 있으나, 하이브리드 전기차 보급률이 상승함에 따라 이 지역조차 차량 교체 속도가 둔화되고 있습니다. 승용차는 규모 우위를 유지하며 급격한 판매량 감소로부터 해당 부문을 보호하고 있으나, 총소유비용(TCO) 모델이 점차 전동화를 선호함에 따라 상용 차량은 더 빠르게 감속하고 있습니다. 전반적으로 시장의 전략적 중요성은 직접 전기화를 우선시하는 탈탄소화 의제 속에서 성장 기회에서 전환 헤지로 전환되고 있습니다.
세계의 플렉스 연료 차량 시장 동향 및 인사이트
개발도상국에서의 E-10/E-15의 세계의 전개
인도, 인도네시아, 필리핀에서 확대되는 혼합 의무는 정책 입안자들이 에너지 안보와 농업 소득 다각화를 추구함에 따라 에탄올 수요를 높이고 있습니다. 인도가 2026년까지 20% 혼합을 추진함에 따라 옥수수 수출국에서 순수입국으로 전환되며 세계의 원료 공급이 긴축되고 있습니다. 일본의 2030년까지 E-10, 2040년까지 E-20 도입 로드맵은 전기차 인프라 확장과 동시에 내연기관 옵션을 보존하는 아시아의 조율된 전략을 강조합니다. 가금류 및 축산 부문과의 원료 경쟁으로 투입 가격이 상승하면서 연료 정책과 식량 안보 사이의 미묘한 균형이 드러나고 있습니다. 국영 석유 기업들은 물류 및 가격 책정의 핵심 촉진자로서 지역별 유통 제약 완화에 기여하고 있습니다. 이러한 프로그램들은 종합적으로 배기 가스 CO2 감축 효과를 제공하지만, 전기차 인센티브와 동시에 진행되는 플렉스 연료 차량 시장 위축을 되돌리기는 어렵다.
브라질 Lenovo Bio 탄소 크레딧 프리미엄
Lenovo Bio는 에탄올 공급 체인의 효율성 향상 정도를 금전적으로 평가하는 라이프사이클 기반 탄소 크레딧 기준을 설정합니다. 저탄소 CBIO 인증서 프리미엄은 2025년 초 톤당 CO2e 기준 115달러에 달하며, 사탕수수 및 옥수수 에탄올 공장에 수익성 있는 추가 수입원을 제공합니다. 브라질 중서부 지역 확장으로 이미 25개의 옥수수 에탄올 공장이 가동 중이며, 추가로 15개가 건설 중이어서 2024/25년 수확기 총 생산량은 82억 리터로 증가할 전망입니다. 이 정책의 기술 중립적 프레임워크는 최고 수준의 생산자를 우대하여 정밀 농업 투입재와 폐열 회수 시스템 도입을 장려합니다. 페트로블라스가 '미래 연료법'에 근거하여 고농도 에탄올 혼합 연료를 지지한 것은 이 경로에 대한 국가의 지속적인 지원을 보여줍니다. Lenovo Bio는 설탕 가격에 연동하는 수익 변동을 완화하지만 전기자동차로의 거시적 전환을 완전히 상쇄 할 수는 없습니다.
유럽과 중국에서 가속화된 EV 보급 목표
유럽연합의 2035년 내연기관 차량 판매 금지와 중국의 신에너지차(NEV) 할당량 확대는 자동차 제조사의 투자를 완전 전기화로 전환시키고 있습니다. 중국 브랜드는 2023년 EU 배터리 전기차 판매의 7.9%를 점유했으며, 2027년까지 20%를 차지할 수 있어 경쟁 압력이 증폭될 전망입니다. 유럽의 전기차 시장은 2030년까지 기하급수적으로 성장할 것으로 예상되며, 이는 바이오연료 플랫폼에서 자본을 유출시키는 금융적 자석 역할을 합니다. 중국의 비용 우위는 플렉스 연료 전략을 경제적으로 열등하게 보이게 하여 정책, 인프라, 소비자 선호도의 피드백 루프를 강화합니다. 공공 충전 네트워크가 확장되면서 주행 거리 불안감이 줄어들고 있어 플렉스 연료의 경쟁력이 더욱 약화되고 있습니다. 이 억제요인은 플렉스 연료 차량 시장의 CAGR로 가장 큰 단일 점유율을 차감합니다.
부문 분석
E25-E85 카테고리는 2025년 플렉스 연료 차량 시장 규모에서 48.55%를 차지했으며, 2031년까지 연평균 -2.30% 성장률로 하락할 것으로 전망됩니다. 중간 혼합 연료는 기존 주유소 펌프와 엔진 보정값을 활용하여 고가의 하드웨어 변경 없이도 원활하게 공급됩니다. 브라질의 E30 가솔린 평가는 다양한 에탄올 함량에 원활하게 적응하는 2천만 대의 차량을 활용하여 이러한 최적의 지점에 부합합니다. 캘리포니아의 급속한 E85 소매 판매 증가는 경제성이 허용될 때 지역별 과세 및 가격 인센티브가 운전자들을 고농도 바이오연료 혼합으로 유도할 수 있음을 보여줍니다. 그러나 연구에 따르면 E30은 저속 사전 점화 제어의 전환점에 위치하며, 이보다 높은 에탄올 함량은 엔진 매핑 복잡성과 냉시동 위험을 증가시킵니다. 이러한 실용적 한계는 OEM 설계 선택을 안내하며, 과도기 동안 중간 농도 혼합이 업계의 기본 옵션으로 유지되도록 합니다.
E85 이상의 고농도 혼합 연료는 재생 가능 성분을 극대화하지만 전용 연료 공급망이 필요하며, 에너지 밀도 손실로 주행 거리가 감소하는 단점이 있습니다. E10이나 E15 같은 초급 혼합 연료는 공급망이 아직 발전 중인 시장에 도움이 되지만 탄소 감축 효과가 제한적이어서 엄격한 배출 목표 하에서는 전략적 매력이 떨어진다. 현재의 계층 구조는 전기화가 확산되는 상황에서도 지속가능성과 인프라 현실 사이의 실용적 타협점을 보여줍니다. 전반적으로, 고생산 지역에서 휘발유 대비 가격 차이가 매력적으로 유지된다면 2031년까지 25-85% 에탄올 혼합 연료가 플렉스 연료 채택을 계속 주도할 것입니다.
승용차는 2025년 매출의 64.52%를 차지했으며 상용 부문보다 낮은 -2.18%의 연평균 성장률(CAGR)로 감소할 전망입니다. 특히 에탄올이 할인된 가격에 거래되는 지역에서 소비자의 연료 선택 선호도는 기본 수요를 유지합니다. 브라질 소형차 부문은 여전히 플렉스 연료를 기본 사양으로 채택하고 있으며, 인도의 타타 펀치 플렉스 연료는 비용에 민감한 시장에서도 혁신 가능성을 보여줍니다. 경상용 밴은 적재량 요구와 내연기관에 대한 제재를 시작하는 도시 지역 규제를 균형 있게 고려하는 중간 위치를 차지합니다. 반면 중형 트럭과 버스는 장기 운영 비용 절감을 약속하는 배터리 전기차 및 수소 모델로 자본을 전환하는 차량 운영사들로 인해 가장 빠르게 감소 중입니다.
승용차 부문의 회복력은 분산된 연료 보급과 개별 가격 차익 거래 행동에서 비롯되며, 이는 중앙 집중식 차량 조달에서는 찾아볼 수 없다. 오토바이는 신흥 틈새 시장을 형성 중이며, 혼다는 동남아시아의 국내 에탄올 공급망을 활용할 수 있는 플렉스 호환 엔진을 도입했습니다. 그러나 강화되는 도시 대기질 규제와 혼잡세는 전기 스쿠터 및 소형 전기차로의 전환을 가속화할 전망입니다. 결과적으로 승용차는 플렉스 연료 차량 시장에서 판매량 선두를 유지하겠지만, 해당 부문의 전략적 중요성은 향후 10년간 감소할 것으로 예상됩니다.
지역별 분석
2025년에는 남미가 42.10%의 점유율로 선두를 차지했습니다. 이는 브라질이 4만 대 이상의 소매 펌프와 견조한 CBIO 탄소 신용 시장을 포함한 통합 에탄올 에코시스템을 구축한 것으로 주도하고 있습니다. 이 나라의 '미래 연료법'에 의해 의무 혼합률이 35%로 인상됨에 따라 국내 수요는 견조하게 추이해, 옥수수 에탄올의 확대가 원료 리스크의 분산화에 기여하고 있습니다. 스텔란티스의 56억 유로 규모의 바이오하이브리드 투자는 에탄올과 전기의 시너지 효과를 입증하는 '살아있는 실험실'로서의 이 지역의 역할을 뒷받침합니다. 아르헨티나와 파라과이는 사탕수수 비에탄올 수입으로 수요를 보완하고 공급망 경제를 안정시키는 지역 무역 허브로서의 기반을 구축하고 있습니다.
아시아태평양 지역은 적극적인 혼합 정책에도 불구하고 2031년까지 연평균 -2.23% 성장률로 가장 빠르게 감소하는 블록입니다. 중국의 신에너지차(NEV) 보급에 대한 국가적 집중과 지방 정부의 배터리 전기 트럭 보조금 정책이 플렉스 연료 투자를 제약합니다. 인도의 에탄올 프로그램은 옥수수 수입 증가로 원료 공급에 역풍을 맞으며 비용 경쟁력이 약화되고 있습니다. 일본의 E10 공약은 정책적 확실성을 제공하지만, 국내 자동차 제조사들은 연구개발을 고체 배터리로 전환하며 틈새 스포츠 모델을 제외한 플렉스 연료 생산을 제한하고 있습니다. 동남아시아 국가들은 B40 바이오디젤 및 에탄올 시범 사업을 모색 중이지만, 전기차 인센티브가 도시 소비자층을 점유하기 시작하고 있습니다.
북미는 45Z 세액공제 지원으로 대규모 에탄올 생산 능력을 유지하지만, OEM들이 신제품 라인업을 전기 플랫폼에 집중하면서 시장 침투율은 정체 상태다. 캘리포니아의 무공해 차량 의무화 정책이 이러한 전환을 가속화합니다. 유럽도 유사한 양상을 보인다 : 독일의 2035년 이후 e-연료 예외 규정 추진에도 불구하고, 규제 패키지는 압도적으로 구매자들을 BEV로 유도합니다.
아프리카에서는 식량 안보와 경제 다각화에 연동된 연료 다양화 전략이 약간의 기회를 제공하고 있지만, 인프라 부족과 구매력의 한계가 보급의 방해가 되고 있습니다.
기타 혜택 :
- 엑셀 형식 시장 예측(ME) 시트
- 애널리스트의 3개월간 지원
자주 묻는 질문
목차
제1장 서론
- 조사의 전제조건
- 조사 범위
제2장 조사 방법
제3장 주요 요약
제4장 시장 상황
- 시장 개요
- 시장 성장 촉진요인
- 개발도상국에서의 E-10/E-15 세계의 도입
- 브라질 Lenovo Bio 탄소 크레딧 프리미엄
- 미국 45Z 세액 공제 후 셀룰로오스 계 에탄올 가격 전환점
- EV정책의 불확실성을 헤지하는 OEM의 플렉스 전략
- 기존 차량용 차세대 포트 연료 분사 키트
- 에탄올 호환 후처리 비용 하락
- 시장 성장 억제요인
- 유럽 및 중국에서 가속적인 EV 보급 목표
- BEV 플랫폼으로의 OEM 자본 지출 재분배
- 가뭄 다발 지역에서의 에탄올 원료공급 제한
- 영하 기후에서의 냉시동 배출량 급증
- 가치/공급망 분석
- 규제 상황
- 기술의 전망
- Porter's Five Forces
- 공급기업 협상력
- 소비자 협상력
- 신규 참가업체 위협
- 대체품 위협
- 경쟁 기업간 경쟁 관계
제5장 시장 규모와 성장 예측(금액(달러))
- 에탄올 혼합율별
- E10-E25
- E25-E85
- E85 이상
- 차량 유형별
- 승용차
- 소형 상용차
- 대형 상용차
- 연료유형별
- 가솔린
- 디젤 호환형 듀얼 연료
- 판매 채널별
- OEM 장착
- 애프터마켓용 전환 키트
- 지역별
- 북미
- 미국
- 캐나다
- 기타 북미
- 남미
- 브라질
- 아르헨티나
- 기타 남미
- 유럽
- 독일
- 프랑스
- 영국
- 스페인
- 기타 유럽
- 아시아태평양
- 중국
- 인도
- 일본
- 한국
- 기타 아시아태평양
- 중동 및 아프리카
- 아랍에미리트(UAE)
- 사우디아라비아
- 튀르키예
- 이집트
- 남아프리카
- 기타 중동 및 아프리카
- 북미
제6장 경쟁 구도
- 시장 집중도
- 전략적 동향
- 시장 점유율 분석
- 기업 프로파일
- Stellantis NV
- Volkswagen AG
- General Motors Co.
- Ford Motor Co.
- Toyota Motor Corp.
- Honda Motor Co.
- 현대자동(주)
- Kia Corp.
- Nissan Motor Co.
- Renault SA
- Subaru Corp.
- BMW AG
- Volvo Car Corp.
- Tata Motors Ltd.
- Mahindra & Mahindra Ltd.
- SAIC Motor Corp.
- Great Wall Motor Co.
- Geely Automobile Holdings
- JAC Motors
- Changan Automobile
제7장 시장 기회와 장래의 전망
HBR 26.01.29Flex-fuel Vehicle market size in 2026 is estimated at USD 1102.88 billion, growing from 2025 value of USD 1130 billion with 2031 projections showing USD 976.12 billion, growing at -2.4% CAGR over 2026-2031.

The downturn mirrors the auto sector's accelerated pivot toward battery-electric drivetrains and tightening regulations that favor zero-tailpipe-emission solutions over biofuel blending. OEMs are reassessing capital allocation as electric platforms capture the bulk of new-model investment, while policy instruments such as the European Union's 2035 combustion-engine phase-out and China's NEV quotas deepen the structural headwinds. South America remains the stronghold for the flex-fuel vehicle market, anchored by Brazil's RenovaBio carbon-credit incentives, yet even this region faces slower fleet renewals as hybrid-electric penetration rises. Passenger cars retain scale advantages that shield the segment from steeper volume loss, but commercial fleets are decelerating faster because total cost-of-ownership models increasingly favor electrification. Overall, the market's strategic relevance is shifting from growth opportunity to transition hedge amid a decarbonization agenda that prioritizes direct electrification.
Global Flex-fuel Vehicle Market Trends and Insights
E-10/E-15 global roll-outs in developing nations
Expanding blend mandates across India, Indonesia, and the Philippines are elevating ethanol demand as policymakers seek energy security and farm-income diversification. India's push toward one-fifth blending by 2026 is turning the country from a corn exporter into a net importer, thereby tightening global feedstock supply. Japan's roadmap for E-10 by 2030 and E-20 by 2040 underscores a coordinated Asian strategy that preserves internal-combustion options while EV infrastructure scales. Feedstock competition with poultry and livestock sectors is lifting input prices, exposing the delicate balance between fuel policy and food security. National oil companies remain critical facilitators of logistics and pricing, helping mitigate regional distribution constraints. Collectively, these programs deliver incremental tail-pipe CO2 cuts but struggle to reverse the flex-fuel vehicle market contraction amid simultaneous EV incentives.
Brazilian RenovaBio carbon-credit premiums
RenovaBio sets life-cycle-based carbon-credit benchmarks that monetize every incremental efficiency gain along the ethanol supply chain. Premiums for low-carbon CBIO certificates reached USD 115 per tonne-CO2e in early 2025, adding profitable revenue streams to sugarcane and corn ethanol plants. Expansion in Brazil's Center-West has already spawned 25 operating corn-ethanol mills with another 15 under construction, lifting total output to 8.2 billion liters for the 2024/25 harvest. The policy's technology-neutral framework favors best-in-class producers, incentivizing precision-agriculture inputs and waste-heat recovery systems. Petrobras' endorsement of higher ethanol blends under the "Fuel of the Future" law signals sustained state-backed support for the pathway. While RenovaBio softens revenue volatility tied to sugar prices, it cannot fully offset the macro shift toward electric alternatives.
Accelerated EV adoption targets in Europe & China
The European Union's 2035 combustion ban and China's escalating NEV quotas are redirecting automaker investment toward full electrification. Chinese brands already occupied 7.9% of EU battery-electric sales in 2023 and may capture 20% by 2027, amplifying competitive pressure. The European EV market is forecast to grow exponentially by 2030, a financial magnet that drains capital from biofuel platforms. China's cost advantage makes flex-fuel strategies appear economically inferior, reinforcing a feedback loop of policy, infrastructure, and consumer preference. As public charging networks expand, range anxiety wanes, further eroding flex-fuel defensibility. The restraint subtracts the largest single share from the flex-fuel vehicle market CAGR.
Other drivers and restraints analyzed in the detailed report include:
- Cellulosic-ethanol price inflection after U.S. 45Z credit
- OEM flex-strategy to hedge EV policy uncertainty
- OEM cap-ex re-allocation toward BEV platforms
For complete list of drivers and restraints, kindly check the Table Of Contents.
Segment Analysis
The E-25 to E-85 category held 48.55% of flex-fuel vehicle market size in 2025 and is forecast to slip at a -2.30% CAGR to 2031. Moderate blends thrive on existing filling-station pumps and engine calibrations that avoid costly hardware changes. Brazil's evaluation of E30 gasoline aligns with this sweet spot, leveraging a 20-million-vehicle fleet that seamlessly adapts to varying ethanol content. California's rapid E85 retail sales underscore how regional taxation and price incentives can nudge drivers toward higher biofuel mixes when economics allow. Yet research indicates E30 sits at the inflection point for low-speed pre-ignition control, where further ethanol raises engine-mapping complexity and cold-start risk. This practical ceiling guides OEM design choices and keeps mid-range blends the industry's default during the transition period.
High blends above E85, while showcasing maximum renewable content, demand dedicated fuel networks and carry energy-density penalties that erode driving range. Entry-level blends such as E10 or E15 aid markets that are still developing supply chains, but they deliver limited carbon reduction, reducing their strategic appeal under stringent emissions goals. The current hierarchy signals a pragmatic compromise between sustainability and infrastructural reality, even as electrification gains traction. Overall, ethanol blends between 25% and 85% will continue to dominate flex-fuel adoption through 2031, provided price differentials against gasoline remain attractive in high-production regions.
Passenger cars generated 64.52% of 2025 revenue and will taper at a slower -2.18% CAGR than commercial segments. Consumer preference for fuel choice, especially where ethanol trades at a discount, sustains baseline demand. Brazil's compact-car segment still counts flex-fuels as the default configuration, while India's Tata Punch Flex Fuel showcases innovation potential even in cost-sensitive markets. Light-commercial vans occupy an intermediate position, balancing payload needs with urban-zone regulations that are starting to penalize combustion engines. In contrast, heavy-duty trucks and buses are declining fastest as fleet operators shift capital toward battery-electric and hydrogen models that promise long-term operating savings.
The resilience of the passenger car cohort stems from decentralized refueling and individual price arbitrage behavior, both absent in centralized fleet procurement. Motorcycles offer an emerging niche, with Honda introducing flex-compatible engines that can utilize domestic ethanol streams in Southeast Asia. Still, rising urban clean-air rules and congestion charges are likely to accelerate the migration toward electric scooters and compact EVs. Consequently, passenger cars will preserve volume leadership in the flex-fuel vehicle market, yet the segment's strategic importance is expected to diminish over the next decade.
The Flex-Fuel Vehicle Market is Segmented by Ethanol Blend Type (E-10 To E-25, E-25 To E-85, E-85 and Above), Vehicle Type (Passenger Cars, Light Commercial Vehicles, and Heavy Commercial Vehicles), Fuel Type (Gasoline and Diesel-Compatible Dual-Fuel), Sales Channel (OEM-Fitted and Aftermarket Conversion Kits), and Geography. The Market Forecasts are Provided in Terms of Value (USD).
Geography Analysis
South America led with 42.10% share in 2025, powered by Brazil's integrated ethanol ecosystem, which includes more than 40,000 retail pumps and a robust CBIO carbon-credit market. The country's "Fuel of the Future" law raising mandatory blends to 35% keeps domestic demand buoyant, while corn-ethanol expansion diversifies feedstock risk. Stellantis' EUR 5.6 billion Bio-Hybrid investment underscores the region's role as a living laboratory for ethanol-electric synergy. Argentina and Paraguay supplement demand by importing sugarcane ethanol, anchoring a regional trade hub that stabilizes supply-chain economics.
Asia-Pacific, despite active blending policies, is the fastest-declining bloc at -2.23% CAGR through 2031. China's national focus on NEV roll-outs, coupled with provincial subsidies for battery-electric trucks, constrains flex-fuel investments. India's ethanol program faces feedstock headwinds as corn imports grow, dampening cost competitiveness. Japan's E-10 pledge provides policy certainty, but domestic automakers are channeling R&D into solid-state batteries, limiting flex-fuel output beyond niche sports models. Southeast Asian nations are exploring B40 biodiesel and ethanol pilots, yet EV incentives are starting to capture the urban consumer segment.
North America retains large ethanol production capacity supported by the 45Z credit, yet market penetration is flat because OEMs aim new product pipelines at electric platforms. California's zero-emission vehicle mandate accelerates this swing. Europe shows similar patterns: notwithstanding Germany's push for e-fuels carve-outs post-2035, the regulatory package overwhelmingly steers buyers toward BEVs.
In the Middle East and Africa, fuel diversification strategies tied to food-security and economic diversification provide modest openings, but infrastructure gaps and limited purchasing power restrain widespread uptake.
- Stellantis NV
- Volkswagen AG
- General Motors Co.
- Ford Motor Co.
- Toyota Motor Corp.
- Honda Motor Co.
- Hyundai Motor Co.
- Kia Corp.
- Nissan Motor Co.
- Renault SA
- Subaru Corp.
- BMW AG
- Volvo Car Corp.
- Tata Motors Ltd.
- Mahindra & Mahindra Ltd.
- SAIC Motor Corp.
- Great Wall Motor Co.
- Geely Automobile Holdings
- JAC Motors
- Changan Automobile
Additional Benefits:
- The market estimate (ME) sheet in Excel format
- 3 months of analyst support
TABLE OF CONTENTS
1 Introduction
- 1.1 Study Assumptions
- 1.2 Scope of the Study
2 Research Methodology
3 Executive Summary
4 Market Landscape
- 4.1 Market Overview
- 4.2 Market Drivers
- 4.2.1 E-10/E-15 Global Roll-Outs In Developing Nations
- 4.2.2 Brazilian Renovabio Carbon-Credit Premiums
- 4.2.3 Cellulosic-Ethanol Price Inflection After U.S. 45Z Credit
- 4.2.4 OEM Flex-Strategy To Hedge EV Policy Uncertainty
- 4.2.5 Next-Gen Port-Fuel-Injection Kits For Legacy Fleets
- 4.2.6 Ethanol-Compatible After-Treatment Cost Deflation
- 4.3 Market Restraints
- 4.3.1 Accelerated EV Adoption Targets In Europe & China
- 4.3.2 OEM Cap-Ex Re-Allocation Toward BEV Platforms
- 4.3.3 Limited Ethanol Feed-Stock In Drought-Prone Geographies
- 4.3.4 Cold-Start Emission Spikes In Sub-Zero Climates
- 4.4 Value / Supply-Chain Analysis
- 4.5 Regulatory Landscape
- 4.6 Technological Outlook
- 4.7 Porter's Five Forces
- 4.7.1 Bargaining Power of Suppliers
- 4.7.2 Bargaining Power of Consumers
- 4.7.3 Threat of New Entrants
- 4.7.4 Threat of Substitutes
- 4.7.5 Intensity of Competitive Rivalry
5 Market Size & Growth Forecasts (Value (USD))
- 5.1 By Ethanol Blend Type
- 5.1.1 E-10 to E-25
- 5.1.2 E-25 to E-85
- 5.1.3 E-85 and Above
- 5.2 By Vehicle Type
- 5.2.1 Passenger Cars
- 5.2.2 Light Commercial Vehicles
- 5.2.3 Heavy Commercial Vehicles
- 5.3 By Fuel Type
- 5.3.1 Gasoline
- 5.3.2 Diesel-compatible Dual-Fuel
- 5.4 By Sales Channel
- 5.4.1 OEM-fitted
- 5.4.2 Aftermarket Conversion Kits
- 5.5 By Geography
- 5.5.1 North America
- 5.5.1.1 United States
- 5.5.1.2 Canada
- 5.5.1.3 Rest of North America
- 5.5.2 South America
- 5.5.2.1 Brazil
- 5.5.2.2 Argentina
- 5.5.2.3 Rest of South America
- 5.5.3 Europe
- 5.5.3.1 Germany
- 5.5.3.2 France
- 5.5.3.3 United Kingdom
- 5.5.3.4 Spain
- 5.5.3.5 Rest of Europe
- 5.5.4 Asia-Pacific
- 5.5.4.1 China
- 5.5.4.2 India
- 5.5.4.3 Japan
- 5.5.4.4 South Korea
- 5.5.4.5 Rest of Asia-Pacific
- 5.5.5 Middle East and Africa
- 5.5.5.1 United Arab Emirates
- 5.5.5.2 Saudi Arabia
- 5.5.5.3 Turkey
- 5.5.5.4 Egypt
- 5.5.5.5 South Africa
- 5.5.5.6 Rest of Middle East and Africa
- 5.5.1 North America
6 Competitive Landscape
- 6.1 Market Concentration
- 6.2 Strategic Moves
- 6.3 Market Share Analysis
- 6.4 Company Profiles (includes Global Level Overview, Market Level Overview, Core Segments, Financials as Available, Strategic Information, Market Rank/Share for Key Companies, Products and Services, SWOT Analysis, and Recent Developments)
- 6.4.1 Stellantis NV
- 6.4.2 Volkswagen AG
- 6.4.3 General Motors Co.
- 6.4.4 Ford Motor Co.
- 6.4.5 Toyota Motor Corp.
- 6.4.6 Honda Motor Co.
- 6.4.7 Hyundai Motor Co.
- 6.4.8 Kia Corp.
- 6.4.9 Nissan Motor Co.
- 6.4.10 Renault SA
- 6.4.11 Subaru Corp.
- 6.4.12 BMW AG
- 6.4.13 Volvo Car Corp.
- 6.4.14 Tata Motors Ltd.
- 6.4.15 Mahindra & Mahindra Ltd.
- 6.4.16 SAIC Motor Corp.
- 6.4.17 Great Wall Motor Co.
- 6.4.18 Geely Automobile Holdings
- 6.4.19 JAC Motors
- 6.4.20 Changan Automobile
7 Market Opportunities & Future Outlook
- 7.1 White-space & Unmet-need Assessment
