


|
시장보고서
상품코드
1911442
자판기 : 시장 점유율 분석, 업계 동향과 통계, 성장 예측(2026-2031년)Vending Machine - Market Share Analysis, Industry Trends & Statistics, Growth Forecasts (2026 - 2031) |
||||||
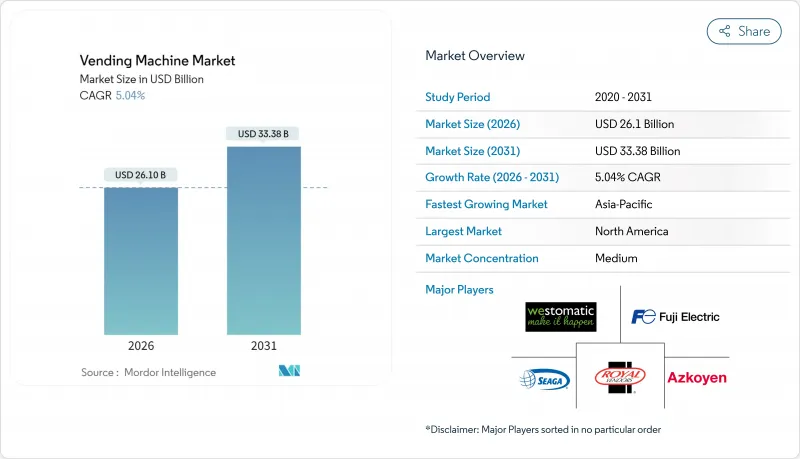
자판기 시장은 2025년 248억 5,000만 달러에서 2026년에는 261억 달러로 성장할 것으로 보입니다. 2026-2031년에 걸쳐 CAGR 5.04%로 성장을 지속하여 2031년까지 333억 8,000만 달러에 달할 것으로 전망됩니다.

현재 세계의 자판기 시장의 현재 확장은 AI 기반 상품 구성 최적화, 예측 유지보수, 그리고 동전 기반 방식에서 현금 없는 비접촉 결제 방식으로의 급속한 전환에 힘입고 있습니다. 규제적 요인들?특히 유럽의 생산자 책임 확대(EPR) 의무와 북미의 직장 내 ESG 평가표?은 운영사들로 하여금 반환형 자판기와 건강 제품 포맷을 도입하도록 압박하며 경쟁 구도를 재편하고 있습니다. 연결된 자산을 데이터 중심 소프트웨어 계층과 결합한 운영사들은 이제 마진이 압박받는 하드웨어가 아닌 인사이트를 통해 수익을 창출하며, 결제 처리업체, 자산 관리 플랫폼, 서비스 통합업체가 수익 풀에서 점유율을 확대하는 생태계를 촉진하고 있습니다. 아시아태평양 지역의 급속한 도시화와 모바일 지갑의 보편화는 막대한 미개척 시장 잠재력을 제공하며, 동시에 성숙 시장의 인건비 압박은 기업들로 하여금 교통 허브, 병원, 산업 단지에 소규모 소매점을 자동화하도록 유도하고 있습니다.
세계의 자판기 시장 동향 및 인사이트
이동 중 소비를 위한 포장 및 신선 식품 수요 증가
통근자, 사무직 직원, 학생들이 전통적 소매보다 속도와 접근성을 우선시함에 따라 식품 서비스 편의성이 세계의 자판기 시장을 지속적으로 견인하고 있습니다. 미국 노동통계국(BLS)은 1997년부터 2025년까지 자판기 식품 가격이 140.66% 급등했으며, 특히 2023년에는 14.81% 증가해 해당 카테고리의 가격 결정력을 입증했습니다. 도쿄의 AI 탑재 샐러드 자판기는 손실을 최소화하고 마진을 높이기 위해 가격을 동적으로 조정합니다. 운영사들은 예측 수요 모델을 적용해 미세 위치별로 SKU를 최적화함으로써 폐기물을 줄이고 평방피트당 수익을 증대시킵니다. 제어대기포장(CAP) 공급업체와의 협력을 통해 신선 농산물의 유통기한을 5일로 연장함으로써 교통 허브와 고등교육 캠퍼스에서 제품 범위를 확대하고 있습니다.
현금없는 비접촉 결제 기술의 급속한 보급
세계의 자판기 시장의 두 번째 성장 동력은 동전과 지폐를 탭 앤 고(Tap-and-Go) 또는 QR 기반 결제 방식으로 꾸준히 대체하는 추세로, 2030년까지 연평균 12.65% 성장률을 기록할 전망입니다. 2024년 캔탈루프(Cantaloupe)는 미주와 유럽의 전역에서 115만 개 이상의 연결 단말기를 처리하며 결제 현대화의 규모의 경제를 입증했습니다. 2024년 7월 일본 지폐 재디자인은 개조 작업의 복잡성을 보여줍니다. 출시 시점 기준 단 30%의 기계만 재구성되어 운영사들은 업그레이드 비용과 판매 차질 가능성을 저울질해야 했습니다. 인도에서는 중앙은행의 QR 코인 시범 사업이 유촉진요인구가 많은 장소에 디지털 지갑을 배치하며, 신흥 시장이 물리적 현금을 건너뛸 수 있음을 시사합니다. 2-5%의 처리 수수료가 총마진을 압박하지만, 운영사들은 평균 거래액 증가와 현금 처리 비용 절감을 통해 가치를 회수합니다.
고액의 자본 지출, 설치비, 유지비
선행 투자는 세계의 자판기 시장에 신규 진입하는 기업들에게 여전히 진입 장벽으로 작용합니다. 냉장 기능, 비전 센싱, 다중 결제 모듈을 갖춘 현대식 스마트 기기는 기존 코일 방식 기계보다 훨씬 높은 자본 지출을 요구합니다. 운영사들은 소프트웨어 라이선스, 연결성, EMV 공동 인증 리더기 같은 규제 준수 업그레이드 비용도 예산에 반영해야 합니다. 원자재 가격 변동성은 추가 부담을 가중시킵니다. 미국 재무부의 2024년 구리 비용 검토 보고서는 여전히 2024년 거래의 69.5%를 차지하는 동전 처리 장치의 마진 압박을 강조했습니다. 많은 신흥 경제국의 엄격한 대출 기준은 투자 회수 기간을 연장시켜 소규모 노선 운영자들이 기기 교체 시기를 미루게 합니다.
부문 분석
자동판매기는 오랫동안 세계의 자동판매기 시장의 주력으로 2025년에는 세계 시장의 55.12%를 차지했습니다. 광범위한 설치 기반은 예측 가능한 수익을 보장하지만 성장 잠재력은 상대적으로 낮습니다. 반면 스마트/IoT 기기는 연평균 9.78%의 성장률을 보이며 소프트웨어 중심 비즈니스 모델로의 장기적 전환을 시사합니다. 연결형 기기에 기인한 세계의 자판기 시장 규모는 2025년 79억 달러에서 2031년 138억 4천만 달러로 확대될 전망입니다. 이 성장은 클라우드 기반 플릿 대시보드 및 프로그램형 광고를 통한 부가 수익을 창출하여 하드웨어 마진 압박을 완화합니다.
특허 출원은 혁신의 가능성을 입증합니다. 코카콜라의 미세 원료 관리 특허는 원격으로 맛을 조정하여 서비스 요청을 줄입니다. 셀룰러 데이터 가격 하락으로 거리 블록 단위의 지역별 상품 구성을 구현하는 알고리즘 플래노그램이 상업적 실현 가능성을 확보하고 있습니다. AI 모듈이 실시간 수요에 따라 SKU 진열을 재구성할 때 초기 도입업체들은 판매 전환율이 두 자릿수 증가했다고 보고합니다. 이러한 배경 속에서 반자동 기계는 제한된 투자 수익률(ROI)을 가진 과도기적 형태로 점차 사라지고 있습니다.
음료는 2025년 매출의 32.85%를 차지하며 여전히 핵심 품목이었으나, 지속가능성 법규로 인해 반환형 자판기가 10.71%의 연평균 성장률(CAGR)로 가장 빠르게 성장하는 부문로 부상했습니다. 더 많은 관할 구역에서 의무적 보증금 제도를 도입함에 따라 2031년까지 세계의 자판기 시장 규모에 대한 기여도가 3배 증가할 것으로 전망됩니다. 전통적인 스낵 및 포장 식품 자판기는 여전히 핵심 식사 시간대를 담당하지만, 염분 및 당분 함량 규제로 인해 제품 포트폴리오 개편이 요구됩니다. 비식품 필수품(개인보호장비, 휴대폰 액세서리 등)은 낮은 물량 처리량을 상쇄하는 가격 탄력성의 도움으로 더 이상 틈새 시장이 아닙니다.
TOMRA의 연간 480억개 용기 회수 실적은 규모의 경제가 폐기물 관리 효율성에 미치는 영향을 입증합니다. 2025년 동안 여러 EU 식료품점은 현장 압축기를 도입해 반환 과정의 물류 비용을 절감하고 운영자 수익률을 높였습니다. 이와 병행하여 도쿄의 AI 기반 신선식품 판매기는 동적 가격 책정 엔진을 통해 신선식품의 손실 문제를 극복할 수 있음을 증명하며, 메뉴 다각화의 광범위한 타당성을 입증하고 있습니다.
지역별 분석
북미는 보편화된 광대역 및 카드 결제 인프라를 활용하여 2025년 세계의 자판기 시장 매출의 32.74%를 차지했습니다. 미국은 팬데믹 이후 위생 우선순위를 정부 건물 전반에 걸친 비접촉식 개인보호장비(PPE) 디스펜서로 전환했으며, 캐나다는 탄소 감축 목표를 통해 에너지 효율적인 냉장 설비 개조를 장려했습니다. 멕시코는 규모는 작지만 음료 대기업들이 예상되는 EPR(생산자 책임 재활용) 법안 시행에 대비하며 리버스 벤딩 시범 사업을 확대 중입니다. 인건비 상승은 세 시장 모두에서 자동화 도입을 가속화하여 성숙도 압박에도 불구하고 중간 단일 자릿수 성장을 유지하고 있습니다.
아시아태평양 지역은 9.86%라는 가장 높은 연평균 성장률(CAGR) 전망을 기록했으며, 도시 이주와 모바일 결제 보편화를 통해 세계의 자판기 시장에 중요한 규모를 더하고 있습니다. 중국의 QR 코드 중심 소비 문화는 스마트 기기 보급을 가속화하는 반면, 일본은 화폐 재설계로 인해 기존 기계의 70%가 일시적으로 규정을 준수하지 못하는 상황에 직면했습니다. 태국의 타오빈 네트워크는 6,000대의 기계를 통해 매일 20만 개의 음료를 판매하며 노동력 대체 경제의 대표 사례로 꼽힌다. 인도의 중앙은행 QR 코인 프로젝트는 소매 결제 현대화를 위한 국가 주도의 추진을 시사합니다.
유럽의 성장 궤적은 보다 안정적이지만 규제 촉매에 기반합니다. 영국의 2027년 보증금 반환 제도는 반환 자판기 설치를 촉진하며, 독일 브레멘 공항은 2025년 6월 인공지능 감시 자율 운영 매장을 개장했습니다. 이미 대부분 현금 없는 사회인 스칸디나비아 운영사들은 이제 기업 캠퍼스에 ESG 준수 스낵 라인을 마케팅 중입니다. 남유럽은 모바일 지갑 보급률에서는 뒤처지지만, 공항과 철도역 등 관광 연계 시설을 통한 도입으로 추격 중이며, 이로 인해 해당 지역은 높은 한 자릿수 성장률을 유지하고 있습니다.
기타 혜택 :
- 엑셀 형식 시장 예측(ME) 시트
- 애널리스트의 3개월간 지원
자주 묻는 질문
목차
제1장 서론
- 조사의 전제조건과 시장 정의
- 조사 범위
제2장 조사 방법
제3장 주요 요약
제4장 시장 상황
- 시장 개요
- 시장 성장 촉진요인
- 이동 중 소비를 위한 포장 및 신선 식품 수요 증가
- 현금없는 비접촉 결제 기술의 급속한 보급
- 예측 유지보수를 위한 IoT 기반 스마트 자판기 군 배치
- 확대 생산자 책임 제도가 자동 회수기의 설치를 촉진
- 직장에서의 ESG 목표가 건강하고 지속 가능한 자판기 서비스의 제공을 촉진
- 농촌 의료 네트워크에서의 의약품 및 개인보호장비(PPE) 자판기
- 시장 성장 억제요인
- 고액의 자본 지출, 설치비, 유지 관리비
- 공공기관의 당분 함유 음료 및 칼로리 제한
- 연결된 기계의 사이버 보안 및 데이터 개인정보 보호 위험
- 특정 공공 장소에서의 위생 및 파손 우려
- 밸류체인 분석
- 규제 상황
- 기술의 전망
- Porter's Five Forces 분석
- 신규 참가업체의 위협
- 구매자의 협상력
- 공급기업의 협상력
- 대체품의 위협
- 경쟁 기업간 경쟁 관계
- 지속가능성과 순환형 경제분석
- 시장의 거시 경제 동향 평가
제5장 시장 규모와 성장 예측
- 기술별
- 자동판매기
- 반자동판매기
- 스마트/IoT 지원 판매기
- 제품 유형별
- 스낵 및 포장 식품
- 음료
- 담배 및 니코틴 제품
- 비식품 필수품(PPE, 전자기기, 퍼스널케어)
- 반환형 자동판매기(재활용)
- 용도/도입 장소별
- 상업 건물 및 사무실
- 교통 허브(공항, 철도, 버스, 지하철)
- 교육기관
- 의료시설
- 접객 및 레저 시설
- 산업 및 제조 허브
- 기타(주택, 소매몰)
- 결제 수단별
- 현금
- 카드 기반 무현금 (신용/직불, NFC)
- 모바일 월렛과 QR코드
- 생체인증 및 얼굴인식
- 지역별
- 북미
- 미국
- 캐나다
- 멕시코
- 유럽
- 독일
- 영국
- 프랑스
- 이탈리아
- 스페인
- 러시아
- 기타 유럽
- 아시아태평양
- 중국
- 일본
- 인도
- 한국
- 호주
- 기타 아시아태평양
- 남미
- 브라질
- 아르헨티나
- 기타 남미
- 중동
- 사우디아라비아
- 아랍에미리트(UAE)
- 튀르키예
- 기타 중동
- 아프리카
- 남아프리카
- 나이지리아
- 기타 아프리카
- 북미
제6장 경쟁 구도
- 시장 집중도 분석
- 전략적 동향과 발전
- 시장 점유율 분석
- 기업 프로파일
- Fuji Electric Co., Ltd.
- Crane Merchandising Systems(Crane NXT)
- Azkoyen Group
- Evoca Group
- SandenVendo GmbH
- Westomatic Vending Services Ltd.
- Royal Vendors, Inc.
- Seaga Manufacturing, Inc.
- Jofemar SA
- Selecta Group
- Cantaloupe Inc.(USA Technologies)
- 365 Retail Markets LLC
- TCN Vending Machine Co., Ltd.
- Guangzhou Baoda Intelligent Technology Co., Ltd.
- Daalchini Technologies Pvt. Ltd.
- Canteen Vending Services(Compass Group)
- Aramark Corporation
- FAS International SpA
- Vending.com(Federal Machine Corp.)
- Vendekin Technologies Pvt. Ltd.
제7장 시장 기회와 장래의 전망
HBR 26.01.29The vending machine market is expected to grow from USD 24.85 billion in 2025 to USD 26.1 billion in 2026 and is forecast to reach USD 33.38 billion by 2031 at 5.04% CAGR over 2026-2031.
The current expansion of the global vending machine market is powered by AI-driven assortment optimization, predictive maintenance, and the rapid migration from coin-based mechanisms to cashless and contact-free payments. Regulatory triggers-particularly extended-producer-responsibility (EPR) mandates in Europe and workplace ESG scorecards in North America-push operators to deploy reverse-vending and healthy-product formats, reshaping the competitive playbook. Operators that marry connected fleets with data-rich software layers now monetize insights, rather than margin-squeezed hardware, catalyzing an ecosystem where payment processors, fleet-management platforms, and service integrators capture a growing share of profit pools. Asia-Pacific's urbanization boom and mobile-wallet ubiquity provide outsized white-space potential; simultaneous labor-cost pressures in mature markets lead enterprises to automate micro-retail at transit hubs, hospitals, and industrial campuses.
Global Vending Machine Market Trends and Insights
Increasing Demand for Packaged and Fresh Food for On-the-Go Consumption
Food-service convenience continues to lift the global vending machine market as commuters, office staff, and students prioritize speed and accessibility over traditional retail. The U.S. Bureau of Labor Statistics recorded a 140.66% jump in vending-food prices between 1997 and 2025, with a notable 14.81% increase in 2023, confirming the category's pricing power. Tokyo's AI-equipped salad units adjust prices dynamically to minimize shrinkage and elevate margins. Operators overlay predictive-demand models that fine-tune SKUs by micro-location, cutting waste and boosting revenue per square foot. Partnerships with controlled-atmosphere-packaging suppliers now make fresh produce viable for five-day shelf lives, broadening product scope at transportation hubs and higher-education campuses.
Rapid Adoption of Cashless and Contactless Payment Technologies
A second tailwind for the global vending machine market is the steady replacement of coins and bills with tap-and-go or QR-based options, advancing 12.65% CAGR through 2030. Cantaloupe processed more than 1.15 million connected endpoints across the Americas and Europe in 2024, underscoring scale economics behind payment modernization. Japan's July 2024 banknote redesign illustrates the retro-fit complexity: only 30% of machines were reconfigured at launch, forcing operators to weigh upgrade costs against possible sales disruption. In India, the Reserve Bank's QR-coin pilot places digital wallets at high-footfall locations, an early indication that emerging markets may leapfrog physical cash. Although processor fees of 2-5% compress gross margins, operators recoup value via higher average tickets and lower cash-handling overhead.
High Capital, Installation, and Maintenance Expenditures
Up-front investment remains a gating factor for new entrants to the global vending machine market. Modern smart units with refrigeration, vision sensing, and multi-payment modules require meaningfully higher capital outlays than legacy coil machines. Operators must also budget for software licences, connectivity, and regulatory compliance upgrades such as EMV-co-certified readers. Raw-material volatility adds further strain; the U.S. Department of the Treasury's 2024 copper cost review highlighted margin pressure on coin mechanisms that still serve 69.5% of 2024 transactions. Tight lending standards in many emerging economies elongate payback periods, causing smaller route owners to defer fleet renewal.
Other drivers and restraints analyzed in the detailed report include:
- Deployment of IoT-Enabled Smart Vending Fleets for Predictive Maintenance
- Extended-Producer-Responsibility Rules Spurring Reverse-Vending Installations
- Cyber-Security and Data-Privacy Risks for Connected Machines
For complete list of drivers and restraints, kindly check the Table Of Contents.
Segment Analysis
Automatic machines, long the workhorse of the global vending machine market, held 55.12% global vending machine market share in 2025. Their wide installed base anchors predictable revenue but offers fewer upside levers. Smart/IoT units, meanwhile, are scaling at a 9.78% CAGR, signaling a secular shift toward software-centric business models. The global vending machine market size attributed to connected machines is projected to expand from USD 7.9 billion in 2025 to USD 13.84 billion by 2031. This growth unlocks ancillary revenue for cloud-based fleet dashboards and programmatic advertising, cushioning hardware margin compression.
Patent filings corroborate the innovation runway. Coca-Cola's micro-ingredient management patents enable remote flavor tweaks, lowering service calls. Algorithmic planograms that localize assortments at street-block granularity are hitting commercial viability as cellular data prices fall. Early adopters report double-digit upticks in sales conversion when AI modules reorder the SKU face according to real-time demand. Against that backdrop, semi-automatic machines are tapering as a transitional form factor with limited ROI.
Beverages remained kingpin at 32.85% of 2025 revenues; nevertheless, sustainability legislation positions reverse-vending machines as the fastest clip at 10.71% CAGR. Their contribution to global vending machine market size is forecast to triple by 2031 as more jurisdictions introduce mandatory deposit schemes. Traditional snack and packaged-food machines continue to serve core meal occasions, yet salt- and sugar-content regulations require portfolio revamps. Non-food essentials-think PPE and phone accessories-are no longer niche, aided by price elasticity that offsets lower volume throughput.
TOMRA's 48 billion annual container capture underscores how scale addresses waste-management economics. During 2025, several EU grocers integrated on-site compactors, pulling logistics costs out of the return loop and raising operator ROI. Parallel to that, AI-driven fresh-food units in Tokyo are proving that perishables can beat shrinkage headwinds with dynamic pricing engines, validating broader menu diversification.
The Vending Machine Market Report is Segmented by Technology (Automatic, Semi-Automatic, and Smart/IoT-Enabled), Product Type (Snacks and Packaged Food, Beverages, and More), Application (Commercial Buildings and Offices, Transportation Hubs, Educational Institutions, and More), Payment Mode (Cash, Card-Based Cashless, Mobile Wallet and QR, and More), and Geography. The Market Forecasts are Provided in Terms of Value (USD).
Geography Analysis
North America accounted for 32.74% of 2025 global vending machine market revenue, leveraging ubiquitous broadband and card-payments infrastructure. The United States channeled post-pandemic hygiene priorities into contact-free PPE dispensers across government buildings, while Canada's carbon-reduction targets incentivized energy-efficient refrigeration retrofits. Mexico, though smaller, is scaling reverse-vending pilots as beverage majors prepare for anticipated EPR laws. Labor-cost inflation hastens automation uptake across all three markets, sustaining mid-single-digit growth despite maturity pressures.
Asia-Pacific registered the highest 9.86% CAGR outlook, adding critical mass to the global vending machine market through urban migration and mobile money ubiquity. China's QR-first consumer culture accelerates smart-unit penetration, while Japan wrestles with currency redesigns that have rendered 70% of older machines temporarily non-compliant. Thailand's Tao Bin network sells 200,000 drinks daily via 6,000 machines, a poster child for labor substitution economics. India's Reserve Bank QR-coin initiative signals a state-sponsored push to modernize micro-retail payments.
Europe's trajectory is steadier but underpinned by regulatory catalysts. The UK's 2027 Deposit Return Scheme ramps reverse-vending installations, while Germany's Bremen Airport opened an AI-policed autonomous store in June 2025. Scandinavian operators, already largely cashless, now market ESG-compliant snack lines to corporate campuses. Southern Europe lags on mobile-wallet density yet catches up via tourism-linked deployments in airports and railway stations, ensuring the region maintains a high-single-digit growth clip.
- Fuji Electric Co., Ltd.
- Crane Merchandising Systems (Crane NXT)
- Azkoyen Group
- Evoca Group
- SandenVendo GmbH
- Westomatic Vending Services Ltd.
- Royal Vendors, Inc.
- Seaga Manufacturing, Inc.
- Jofemar S.A.
- Selecta Group
- Cantaloupe Inc. (USA Technologies)
- 365 Retail Markets LLC
- TCN Vending Machine Co., Ltd.
- Guangzhou Baoda Intelligent Technology Co., Ltd.
- Daalchini Technologies Pvt. Ltd.
- Canteen Vending Services (Compass Group)
- Aramark Corporation
- FAS International S.p.A.
- Vending.com (Federal Machine Corp.)
- Vendekin Technologies Pvt. Ltd.
Additional Benefits:
- The market estimate (ME) sheet in Excel format
- 3 months of analyst support
TABLE OF CONTENTS
1 INTRODUCTION
- 1.1 Study Assumptions and Market Definition
- 1.2 Scope of the Study
2 RESEARCH METHODOLOGY
3 EXECUTIVE SUMMARY
4 MARKET LANDSCAPE
- 4.1 Market Overview
- 4.2 Market Drivers
- 4.2.1 Increasing demand for packaged and fresh food for on-the-go consumption
- 4.2.2 Rapid adoption of cashless and contactless payment technologies
- 4.2.3 Deployment of IoT-enabled smart vending fleets for predictive maintenance
- 4.2.4 Extended-producer-responsibility rules spurring reverse-vending installations
- 4.2.5 Workplace ESG targets boosting healthy and sustainable vending offerings
- 4.2.6 Medicine and PPE vending in rural healthcare networks
- 4.3 Market Restraints
- 4.3.1 High capital, installation and maintenance expenditures
- 4.3.2 Sugary-drink and calorie restrictions in public institutions
- 4.3.3 Cyber-security and data-privacy risks for connected machines
- 4.3.4 Hygiene and vandalism concerns in certain public areas
- 4.4 Value Chain Analysis
- 4.5 Regulatory Landscape
- 4.6 Technological Outlook
- 4.7 Porter's Five Forces Analysis
- 4.7.1 Threat of New Entrants
- 4.7.2 Bargaining Power of Buyers
- 4.7.3 Bargaining Power of Suppliers
- 4.7.4 Threat of Substitutes
- 4.7.5 Competitive Rivalry
- 4.8 Sustainability and Circular-Economy Analysis
- 4.9 Assessment of Macro Economic Trends on the Market
5 MARKET SIZE AND GROWTH FORECASTS (VALUES)
- 5.1 By Technology
- 5.1.1 Automatic Vending Machines
- 5.1.2 Semi-Automatic Vending Machines
- 5.1.3 Smart / IoT-Enabled Vending Machines
- 5.2 By Product Type
- 5.2.1 Snacks and Packaged Food
- 5.2.2 Beverages
- 5.2.3 Tobacco and Nicotine Products
- 5.2.4 Non-Food Essentials (PPE, Electronics, Personal Care)
- 5.2.5 Reverse Vending Machines (Recycling)
- 5.3 By Application / Deployment Location
- 5.3.1 Commercial Buildings and Offices
- 5.3.2 Transportation Hubs (Airports, Rail, Bus, Metro)
- 5.3.3 Educational Institutions
- 5.3.4 Healthcare Facilities
- 5.3.5 Hospitality and Leisure Venues
- 5.3.6 Industrial and Manufacturing Sites
- 5.3.7 Others (Residential, Retail Malls)
- 5.4 By Payment Mode
- 5.4.1 Cash
- 5.4.2 Card-Based Cashless (Credit/Debit, NFC)
- 5.4.3 Mobile Wallet and QR
- 5.4.4 Biometric and Facial Recognition
- 5.5 By Geography
- 5.5.1 North America
- 5.5.1.1 United States
- 5.5.1.2 Canada
- 5.5.1.3 Mexico
- 5.5.2 Europe
- 5.5.2.1 Germany
- 5.5.2.2 United Kingdom
- 5.5.2.3 France
- 5.5.2.4 Italy
- 5.5.2.5 Spain
- 5.5.2.6 Russia
- 5.5.2.7 Rest of Europe
- 5.5.3 Asia-Pacific
- 5.5.3.1 China
- 5.5.3.2 Japan
- 5.5.3.3 India
- 5.5.3.4 South Korea
- 5.5.3.5 Australia
- 5.5.3.6 Rest of Asia-Pacific
- 5.5.4 South America
- 5.5.4.1 Brazil
- 5.5.4.2 Argentina
- 5.5.4.3 Rest of South America
- 5.5.5 Middle East
- 5.5.5.1 Saudi Arabia
- 5.5.5.2 UAE
- 5.5.5.3 Turkey
- 5.5.5.4 Rest of Middle East
- 5.5.6 Africa
- 5.5.6.1 South Africa
- 5.5.6.2 Nigeria
- 5.5.6.3 Rest of Africa
- 5.5.1 North America
6 COMPETITIVE LANDSCAPE
- 6.1 Market Concentration Analysis
- 6.2 Strategic Moves and Developments
- 6.3 Market Share Analysis
- 6.4 Company Profiles (includes Global overview, Market overview, Core segments, Financials as available, Strategic info, Market rank/share, Products and services, Recent developments)
- 6.4.1 Fuji Electric Co., Ltd.
- 6.4.2 Crane Merchandising Systems (Crane NXT)
- 6.4.3 Azkoyen Group
- 6.4.4 Evoca Group
- 6.4.5 SandenVendo GmbH
- 6.4.6 Westomatic Vending Services Ltd.
- 6.4.7 Royal Vendors, Inc.
- 6.4.8 Seaga Manufacturing, Inc.
- 6.4.9 Jofemar S.A.
- 6.4.10 Selecta Group
- 6.4.11 Cantaloupe Inc. (USA Technologies)
- 6.4.12 365 Retail Markets LLC
- 6.4.13 TCN Vending Machine Co., Ltd.
- 6.4.14 Guangzhou Baoda Intelligent Technology Co., Ltd.
- 6.4.15 Daalchini Technologies Pvt. Ltd.
- 6.4.16 Canteen Vending Services (Compass Group)
- 6.4.17 Aramark Corporation
- 6.4.18 FAS International S.p.A.
- 6.4.19 Vending.com (Federal Machine Corp.)
- 6.4.20 Vendekin Technologies Pvt. Ltd.
7 MARKET OPPORTUNITIES AND FUTURE OUTLOOK
- 7.1 White-Space and Unmet-Need Assessment
- 7.2 Forecast of Technology Convergence and New Business Models
