


|
시장보고서
상품코드
1934695
미국의 핀테크 시장 : 시장 점유율 분석, 업계 동향과 통계, 성장 예측(2026-2031년)United States Fintech - Market Share Analysis, Industry Trends & Statistics, Growth Forecasts (2026 - 2031) |
||||||
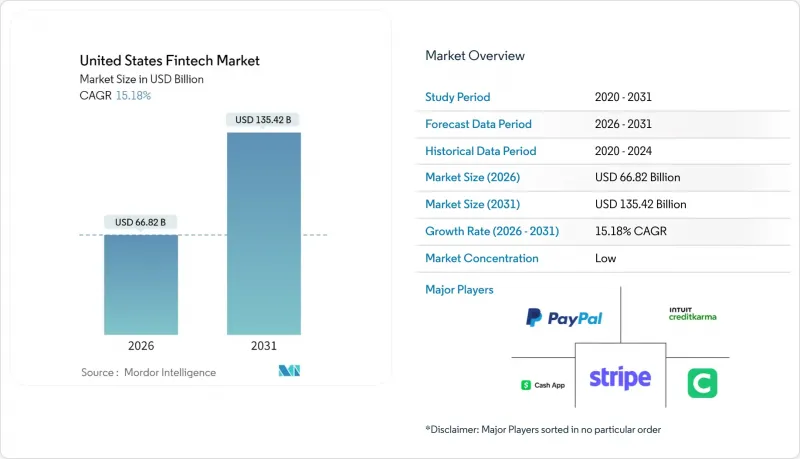
미국 핀테크 시장 규모는 2025년 580억 1,000만 달러에서 2026년 668억 2,000만 달러로 성장하여, 2031년에는 1,354억 2,000만 달러에 이를 것으로 예상되며, 2026-2031년까지 연평균 15.18%로 확대될 것으로 전망됩니다.
전국 규모의 실시간 결제 인프라, 임베디드 금융의 보급, 인공지능을 활용한 리스크 관리 도구의 조합은 고객의 기대치를 재구성하고 기존 기업에 현대화를 요구하고 있습니다. 벤처캐피털 투자는 2024년 침체기 이후 회복세를 보이기 시작했지만, 은행과 핀테크 기업의 제휴에 대한 규제 당국의 감시가 여전히 엄격해 신제품 출시 속도에 영향을 미치고 있습니다. 지역별로는 미국의 핀테크 시장은 서부의 기술 생태계의 혜택을 계속 누리고 있지만, 남부는 낮은 운영 비용과 주정부의 지원 정책으로 인해 가장 빠른 성장세를 보이고 있습니다. 경쟁의 강도는 중간 정도이며, 단일 기업의 점유율이 두 자릿수를 넘는 기업이 없어 수직통합형 스페셜리스트나 지역 은행계 플랫폼이 성장할 수 있는 여지가 남아있습니다.
미국의 핀테크 시장 동향 및 인사이트
실시간 결제 도입으로 디지털화 확산 가속화
FedNow는 2024년 8월까지 초기 35개 참여 은행에서 1,300개 이상의 금융기관으로 확대하여 공공 인프라가 네트워크 효과의 장벽을 극복할 수 있음을 보여주었습니다. 50만 달러의 거래 한도액은 기존 전신 송금에 의존하던 상업 거래의 흐름을 끌어들이고 있습니다. 한편, The Clearing House의 RTP 네트워크는 2024년 3분기에 8,700만 건(총 690억 달러)의 송금을 처리하여 전분기 대비 약 17% 증가하였습니다. 핀테크 사업자들은 이러한 기반을 활용하여 즉시 청구서 결제 서비스, 급여 선지급 서비스 등을 제공함으로써 일일 활성 사용자 수를 확대하고 있습니다. 그러나 여러 즉시 결제 제도가 난립하면서 상호운용성 문제가 발생하고 있으며, 지역 은행을 위해 결제의 복잡성을 추상화할 수 있는 오케스트레이션 플랫폼이 우위를 점하고 있습니다.
수직형 SaaS 플랫폼을 통한 임베디드 금융 도입
수직적 소프트웨어 벤더들은 결제와 대출이 내장된 기능을 통해 수익을 3-4배로 늘리고, 전략적 초점을 라이선싱에서 거래 경제성으로 전환하고 있습니다. 서비스형 뱅킹(BaaS) 중개업체는 규제 공백을 메우고 있지만, 2024년 7월에 발표된 새로운 OCC(통화감독청) 및 FDIC(연방예금보험공사)의 지침으로 인해 스폰서 은행의 실사 비용이 증가하고 있습니다. 테메노스 등 기존 코어뱅킹 사업자들은 기술 스택을 처음부터 구축하는 대신 시장 출시를 앞당기기 위해 미국 BaaS 사업자에 소수 지분 투자를 단행했습니다. 더빈 수정 조항에 따른 교환 한도는 소규모 지역 은행이 SaaS 플랫폼과 제휴할 수 있는 동기를 부여하고, 발행사와의 관계는 분산되며, 서비스 제공 범위는 확대될 것입니다. ISO 20022 데이터 표준은 이러한 수직 통합형 생태계에 내장된 매칭 모듈과 동적 가격 책정 기능을 더욱 강화합니다.
연방 및 주정부 규제의 분절화로 인한 컴플라이언스 부담 증가
핀테크 기업은 50개 주의 송금업체 규제와 더불어 연방정부의 중복된 감독을 준수해야 하며, 이로 인해 법적 비용이 증가하고 제품 출시가 지연될 수 있습니다. 2024년 7월 OCC-FDIC 지침은 BaaS 은행에 보다 엄격한 벤더 관리 규칙을 부과하여 여러 핀테크 스폰서들이 관리 강화를 위해 온보딩을 중단하는 사태가 발생했습니다. 초기 단계의 스타트업은 AML/KYC 요건에 운영 예산의 20%를 지출할 수 있어 실험적인 시도가 제한되고, 자본력이 있는 기존 기업이 유리합니다. 사기 피해에 대한 책임 분담에 대한 CFPB의 잠재적 조치는 불확실성을 더욱 가중시키고 있습니다. 이러한 요인들이 복합적으로 작용하여 미국의 핀테크 시장의 단기적인 확장 속도는 억제될 것으로 보입니다.
부문 분석
디지털 결제는 2025년 기준 미국의 핀테크 시장의 46.78%를 차지할 것으로 예상되며, 카드, 월렛, 계좌이체 등 다양한 소비자 및 가맹점에서의 보급을 반영하고 있습니다. 네오뱅킹은 규모는 작지만, 지점 없는 비즈니스 모델을 통한 서비스 제공 비용 절감과 수수료 없는 저축성 예금 계좌 제안 등을 배경으로 2031년까지 연평균 복합 성장률(CAGR) 21.05%로 확대될 것으로 예측됩니다. 따라서 미국 내 네오뱅킹의 핀테크 시장 규모는 크게 확대될 것으로 예상되며, 자본 시장이 위축된 상황에서도 투자자들을 끌어들일 수 있을 것으로 보입니다.
교차판매가 확대되고 있습니다. 결제 지원 SaaS 업체들은 단기 대출 및 재무 관리 도구를 통합하고, 여러 서비스를 단일 워크플로우로 통합하고 있습니다. 디지털 대출-금융은 26.92%의 건전한 점유율을 유지하고 있으며, 신용 정보가 부족한 차주에 대한 신속한 심사를 가능하게 하는 AI 심사가 기여하고 있습니다. 인슈어테크는 자기자본 규제로 인해 7.36%에 불과하지만, 이용 기반 자동차 보험이나 임베디드형 여행자 보험은 결제 채널과 융합하는 모습을 보이고 있습니다. 디지털 투자는 4.89%로, 골드만삭스가 순수 로보어드바이저 사업에서 철수한 후 통합이 진행되고 있습니다. 기존 기업은 옴니채널 유통을 활용하여 자산을 유지하고 있습니다. 이러한 중복은 모든 제안이 결국 미국의 핀테크 시장에서 지갑 점유율을 놓고 경쟁하고 있음을 보여줍니다.
기타 특전:
- 엑셀 형식 시장 예측(ME) 시트
- 애널리스트 지원(3개월)
자주 묻는 질문
목차
제1장 서론
- 조사의 전제조건과 시장 정의
- 조사 범위
제2장 조사 방법
제3장 주요 요약
제4장 시장 현황
- 시장 개요
- 시장 성장 촉진요인
- 실시간 결제(FedNow, RTP) 도입으로 디지털 전환 가속화
- 수직 SaaS 플랫폼의 임베디드 금융 도입
- 모바일 지갑과 인구 통계학적 비접촉 보급
- AI/ML 기반 신용 및 사기 모델은 위험 경제학을 개선
- "Fin-infra-as-code" 오픈소스 스택으로 시장 출시 시간 단축
- 미국 대형 은행들의 토큰화 예금 및 프로그래밍 가능 화폐 시범 사업
- 시장 제약
- 분산된 연방 및 주 규정으로 인해 준수 부담이 증가
- 실시간 철도 운송에서 사기 및 사이버 보안 비용 증가
- 2022년 이후 자금 조달 축소 및 기업 가치 하락
- 후원은행 연합에 대한 OCC/FDIC 감독 강화
- 가치/공급망 분석
- 규제 상황
- 기술 전망
- Porter's Five Forces
- 신규 가입자 위협
- 공급기업 협상력
- 구매자의 협상력
- 대체품의 위협
- 경쟁 기업간 경쟁 관계
제5장 시장 규모와 성장 예측
- 서비스 제안
- 디지털 결제
- 디지털 대출 및 금융
- 디지털 투자
- 인슈어테크
- 네오뱅킹
- 최종 사용자
- 소매
- 기업
- 사용자
- 모바일 애플리케이션
- 웹/브라우저
- POS/IoT 기기
- 지역별
- 북동부
- 중서부
- 남부
- 서부
제6장 경쟁 구도
- 시장 집중도
- 전략적 움직임
- 시장 점유율 분석
- 기업 프로파일
- PayPal
- Stripe
- Block (Square & Cash App)
- Intuit (QuickBooks / Credit Karma)
- Chime
- SoFi
- Affirm
- Coinbase
- Robinhood
- Fiserv
- FIS
- Plaid
- Adyen
- Wise
- Klarna
- Varo Bank
- Upgrade
- Marqeta
- Navy Federal Credit Union (digital lending)
- Green Dot
제7장 시장 기회 및 향후 전망
LSH 26.03.03The United States fintech market size in 2026 is estimated at USD 66.82 billion, growing from 2025 value of USD 58.01 billion with 2031 projections showing USD 135.42 billion, growing at 15.18% CAGR over 2026-2031.

A combination of nationwide real-time payment infrastructure, embedded finance adoption, and artificial-intelligence-driven risk tools is reshaping customer expectations and forcing incumbents to modernize. Venture capital investment has begun to recover from the 2024 trough, yet regulatory scrutiny of bank-fintech partnerships remains intense, influencing how quickly new products reach the market. Regionally, the United States fintech market continues to benefit from the West's technology ecosystem, even as the South records the fastest growth due to lower operating costs and supportive state policies. Competitive intensity is moderate because no single firm exceeds a double-digit share, leaving space for vertical specialists and community-bank-backed platforms to thrive.
United States Fintech Market Trends and Insights
Real-Time Payments Rollout Accelerates Digital Adoption
FedNow expanded from 35 launch banks to more than 1,300 institutions by August 2024, illustrating how public infrastructure can overcome network-effect barriers. The USD 500,000 transaction ceiling attracts commercial flows that once relied on wires. Concurrently, The Clearing House's RTP network processed 87 million transfers worth USD 69 billion in Q3 2024, growing about 17% quarter-over-quarter. Fintech providers leverage these rails to offer instant bill pay and earned-wage access, boosting daily active users. Yet the proliferation of multiple instant-payment schemes raises interoperability challenges that favor orchestration platforms able to abstract settlement complexity for community banks.
Embedded Finance Uptake by Vertical SaaS Platforms
Vertical software vendors now generate three-to-four times more revenue once payments and lending become embedded features, shifting their strategic focus from licensing fees to transaction economics. Banking-as-a-Service (BaaS) intermediaries fill regulatory gaps, though new OCC and FDIC guidance issued in July 2024 elevates due-diligence costs for sponsor banks. Established core-banking providers such as Temenos took minority stakes in U.S. BaaS players to accelerate time-to-market instead of rebuilding tech stacks from scratch. Interchange caps under the Durbin Amendment incentivize smaller community banks to partner with SaaS platforms, fragmenting issuer relationships but broadening service reach. ISO 20022 data standards further enhance reconciliation and dynamic pricing modules embedded within these vertical ecosystems.
Fragmented Federal & State Regulation Raises Compliance Burden
Fintech firms must navigate 50 state money-transmitter regimes plus overlapping federal oversight, which increases legal costs and lengthens product launches. The July 2024 OCC-FDIC guidance imposed stronger vendor-management rules on BaaS banks, prompting several fintech sponsors to pause onboarding while they upgrade controls. Early-stage startups may spend 20% of operating budgets on AML/KYC requirements, limiting experimentation and favoring well-capitalized incumbents. Potential CFPB action on liability sharing for scam losses adds another layer of uncertainty. Collectively, these factors moderate the near-term expansion pace of the United States fintech market.
Other drivers and restraints analyzed in the detailed report include:
- Mobile Wallet & Contactless Penetration Across Demographics
- AI/ML-Driven Credit & Fraud Models Improve Risk Economics
- Escalating Fraud & Cybersecurity Costs in Real-Time Rails
For complete list of drivers and restraints, kindly check the Table Of Contents.
Segment Analysis
Digital Payments controlled 46.78% of the United States fintech market in 2025, reflecting broad consumer and merchant acceptance across cards, wallets, and account-to-account rails. Neobanking, while smaller, is projected to grow at a 21.05% CAGR through 2031, underpinned by branch-free models that reduce cost-to-serve and enable fee-free checking propositions. The United States fintech market size for Neobanking is therefore expected to widen considerably, attracting investors despite tighter capital markets.
Cross-selling is increasing: payment-facilitating SaaS vendors now embed short-term lending and treasury tools, weaving multiple propositions into a single workflow. Digital Lending & Financing maintains a healthy 26.92% share, aided by AI underwriting that speeds decisions for thin-file borrowers. Insurtech accounts for only 7.36% because of capital adequacy rules, yet its usage-based auto and embedded travel policies illustrate convergence with payment channels. Digital Investments, at 4.89%, is consolidating after Goldman Sachs exited pure robo-advice; incumbents leverage omnichannel distribution to hold assets. These overlaps illustrate how every proposition ultimately competes for wallet share within the United States fintech market.
The United States Fintech Market Report is Segmented by Service Proposition (Digital Payments, Digital Lending & Financing, Digital Investments, Insurtech, Neobanking), End-User (Retail, Businesses), User Interface (Mobile Applications, Web/Browser, POS/IoT Devices), and Geography (Northeast, Midwest, South, West). The Market Forecasts are Provided in Terms of Value (USD).
List of Companies Covered in this Report:
- PayPal
- Stripe
- Block (Square & Cash App)
- Intuit (QuickBooks / Credit Karma)
- Chime
- SoFi
- Affirm
- Coinbase
- Robinhood
- Fiserv
- FIS
- Plaid
- Adyen
- Wise
- Klarna
- Varo Bank
- Upgrade
- Marqeta
- Navy Federal Credit Union (digital lending)
- Green Dot
Additional Benefits:
- The market estimate (ME) sheet in Excel format
- 3 months of analyst support
TABLE OF CONTENTS
1 Introduction
- 1.1 Study Assumptions & Market Definition
- 1.2 Scope of the Study
2 Research Methodology
3 Executive Summary
4 Market Landscape
- 4.1 Market Overview
- 4.2 Market Drivers
- 4.2.1 Real-time payments (FedNow, RTP) rollout accelerates digital adoption
- 4.2.2 Embedded finance uptake by vertical SaaS platforms
- 4.2.3 Mobile wallet & contactless penetration across demographics
- 4.2.4 AI/ML-driven credit & fraud models improve risk economics
- 4.2.5 "Fin-infra-as-code" open-source stacks slash go-to-market time
- 4.2.6 Tokenised deposits & programmable money pilots by U.S. megabanks
- 4.3 Market Restraints
- 4.3.1 Fragmented federal & state regulation raises compliance burden
- 4.3.2 Escalating fraud & cybersecurity costs in real-time rails
- 4.3.3 Funding pull-back & valuation compression post-2022
- 4.3.4 Heightened OCC/FDIC scrutiny of sponsor-bank partnerships
- 4.4 Value / Supply-Chain Analysis
- 4.5 Regulatory Landscape
- 4.6 Technological Outlook
- 4.7 Porter's Five Forces
- 4.7.1 Threat of New Entrants
- 4.7.2 Bargaining Power of Suppliers
- 4.7.3 Bargaining Power of Buyers
- 4.7.4 Threat of Substitutes
- 4.7.5 Competitive Rivalry
5 Market Size & Growth Forecasts
- 5.1 By Service Proposition
- 5.1.1 Digital Payments
- 5.1.2 Digital Lending & Financing
- 5.1.3 Digital Investments
- 5.1.4 Insurtech
- 5.1.5 Neobanking
- 5.2 By End-User
- 5.2.1 Retail
- 5.2.2 Businesses
- 5.3 By User Interface
- 5.3.1 Mobile Applications
- 5.3.2 Web / Browser
- 5.3.3 POS / IoT Devices
- 5.4 By Geography
- 5.4.1 Northeast
- 5.4.2 Midwest
- 5.4.3 South
- 5.4.4 West
6 Competitive Landscape
- 6.1 Market Concentration
- 6.2 Strategic Moves
- 6.3 Market Share Analysis
- 6.4 Company Profiles (includes Global level Overview, Market level overview, Core Segments, Financials as available, Strategic Information, Market Rank/Share, Products & Services, Recent Developments)
- 6.4.1 PayPal
- 6.4.2 Stripe
- 6.4.3 Block (Square & Cash App)
- 6.4.4 Intuit (QuickBooks / Credit Karma)
- 6.4.5 Chime
- 6.4.6 SoFi
- 6.4.7 Affirm
- 6.4.8 Coinbase
- 6.4.9 Robinhood
- 6.4.10 Fiserv
- 6.4.11 FIS
- 6.4.12 Plaid
- 6.4.13 Adyen
- 6.4.14 Wise
- 6.4.15 Klarna
- 6.4.16 Varo Bank
- 6.4.17 Upgrade
- 6.4.18 Marqeta
- 6.4.19 Navy Federal Credit Union (digital lending)
- 6.4.20 Green Dot
7 Market Opportunities & Future Outlook
- 7.1 SME real-time treasury & payables orchestration platforms
- 7.2 Shared synthetic-identity sandbox for secure bank-fintech data exchange
