


|
시장보고서
상품코드
1934710
컨테이너 모니터링 : 시장 점유율 분석, 업계 동향과 통계, 성장 예측(2026-2031년)Container Monitoring - Market Share Analysis, Industry Trends & Statistics, Growth Forecasts (2026 - 2031) |
||||||
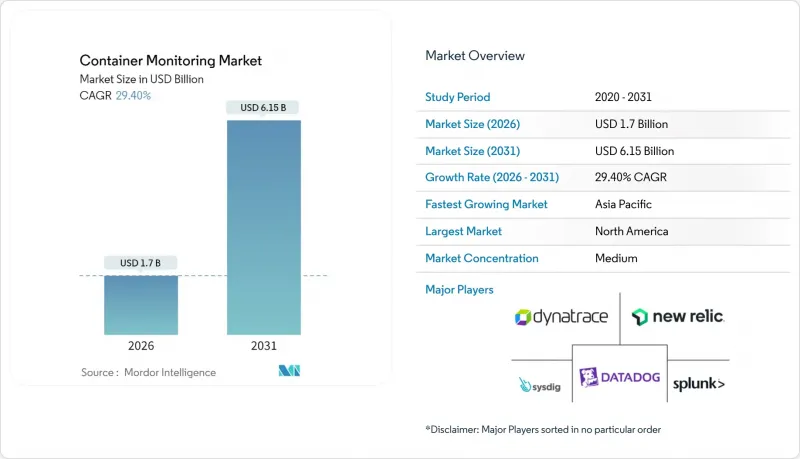
컨테이너 모니터링 시장은 2025년 13억 1,000만 달러에서 2026년에는 17억 달러로 성장하고, 2026-2031년 CAGR 29.4%로 성장을 지속하여, 2031년까지 61억 5,000만 달러에 이를 것으로 예측됩니다.
클라우드 네이티브 아키텍처로 전환하는 기업의 급증, Kubernetes의 우위, eBPF 지원 가시성의 급속한 확산이 이러한 가속화를 뒷받침하고 있습니다. 기업들은 오버헤드를 최소화하면서 텔레메트리의 깊이를 확장할 수 있는 경량화된 커널 레벨의 가시성을 우선시하고 있으며, 에이전트 의존도가 높은 툴에서 벗어나고 있습니다. DevOps의 시프트 레프트(Shift Left) 관행은 소프트웨어 라이프사이클의 초기 단계에 가시성을 도입하고, 프로덕션 릴리스 전 성능 보호를 보장하기 때문에 수요가 더욱 증가하고 있습니다. 보안 및 감사 추적에 대한 규제 요건이 강화되면서 성능, 컴플라이언스, 비용 분석이 통합된 플랫폼이 촉진되고 있으며, 벤더 통합이 지속적으로 발전하고 있습니다.
세계 컨테이너 모니터링 시장 동향 및 인사이트
클라우드 기반 서비스 도입 확대
클라우드 네이티브로의 전환이 컨테이너 모니터링 시장을 주도하고 있으며, 기업들은 모놀리식 용도를 분산형 마이크로서비스로 재구축하고 있습니다. 2024년 기준 퍼블릭 클라우드는 여전히 컨테이너 워크로드의 58.7%를 차지하지만, 하이브리드 및 멀티 클라우드 환경은 2030년까지 연평균 32.1%의 성장률을 보이며 엔드투엔드 가시성 요구사항을 복잡하게 만들고 있습니다. 하이퍼스케일 공급자의 네이티브 모니터링 솔루션은 개방형 텔레메트리 표준을 지원하면서 비용 분석 기능을 통합하여 벤더 종속성에 대한 우려를 줄여줍니다. 엣지 컴퓨팅은 지리적으로 분산된 노드 전체에 원격 측정 지점을 추가하기 때문에 간헐적인 연결성이나 리소스 제약이 있는 디바이스에 대한 솔루션이 필요합니다. 벤더들은 이에 대응하여 클라우드, 엣지, On-Premise 노드에서 거의 실시간으로 이상 징후를 감지하는 AI 기반 상관관계 엔진을 패키징하고 있습니다.
마이크로서비스 아키텍처의 확산
모놀리식 시스템을 수백 개의 느슨하게 연결된 서비스로 분할하면 모니터링 대상 엔드포인트가 급증하고, 호스트 중심 접근 방식으로는 충분하지 않습니다. Istio나 Linkerd와 같은 서비스 메시 계층은 복잡한 동서방향 트래픽을 생성하며, 분산 트레이싱과 레이턴시 히트맵핑을 필요로 합니다. Kubernetes는 포드 레벨의 메트릭을 시각화하는 네이티브 API를 강화하고, OpenTelemetry는 언어 간 메트릭 로그 추적 측정을 표준화하고 있습니다. 조직은 현재 서비스 종속성을 상관관계 분석하여 장애를 식별하고, 인프라의 건전성에서 요청 경로로 초점을 옮기고 있습니다. 컨테이너 내에서 실행되는 이벤트 기반 함수는 실행 기간을 더욱 단축하고, 밀리초 단위의 범위를 포착할 수 있는 고해상도 텔레메트리를 요구합니다.
툴체인의 복잡성과 기술 격차
일반적인 기업에서는 메트릭스 스토어부터 APM 대시보드까지 6가지 이상의 독립적인 모니터링 툴을 운영하느라 애를 먹고 있습니다. 오픈소스 수집 도구와 상용 분석 엔진의 통합은 특히 고급 SRE 인력이 부족한 팀에서 운영 부하를 증가시킵니다. 중소기업은 전문성 부족을 보완하기 위해 매니지드 서비스에 크게 의존하고 있지만, 빠르게 진화하는 eBPF 생태계는 현재 인증 프로그램의 대응 속도를 능가하고 있습니다. 도구의 난립은 데이터 사일로를 만들어 종합적인 사고 대응을 방해하고 ROI를 저해합니다. 교육 정책이 진전되고 있지만, 기술 출시와 광범위한 숙련도 사이에 발생하는 시차로 인해 중기적으로 이러한 제약이 지속될 것으로 예측됩니다.
부문 분석
2025년 기준 컨테이너 모니터링 시장 점유율에서 소프트웨어 플랫폼은 69.60%를 차지했습니다. 이는 기업들이 내부 워크플로우에 맞는 맞춤형 On-Premise 또는 SaaS 스택을 선호하기 때문입니다. 그러나 서비스 분야의 컨테이너 모니터링 시장 규모는 멀티 클라우드 모니터링 도입에 따른 기술 부족을 반영하여 2031년까지 연평균 복합 성장률(CAGR) 30.90%로 확대될 것으로 예측됩니다. 전문 컨설팅 업체는 eBPF 통합, 서비스 메시 트레이싱, 정책-코드 프레임워크를 턴키 계약으로 패키징하여 가치 실현 시간을 단축합니다.
매니지드 모니터링 서비스는 24시간 365일 SRE 체제를 갖추지 못한 중소기업이 선호하는 서비스로, AI를 활용한 경보 분류와 비용 최적화를 구독 모델에 통합하고 있습니다. 하이퍼스케일 클라우드 제공업체들은 장기적인 고객 정착을 보장하기 위해 전문 서비스를 확장하고, 가시성 설계도를 대규모 마이그레이션 계약에 번들로 제공합니다. 컴플라이언스 규제가 강화됨에 따라 감사 대응형 보고 서비스가 수요를 증가시켜 컨테이너 모니터링 시장이 제품 수익과 전문 지식 기반 계약의 균형을 유지할 수 있도록 보장합니다.
2025년 컨테이너 모니터링 시장 규모의 56.90%를 클라우드 우선 구현이 차지할 것으로 예상되며, 인프라 오버헤드가 거의 없는 점과 클라우드 로그와의 긴밀한 연동이 그 원인으로 꼽힙니다. 하이브리드 모델은 31.20%의 연평균 복합 성장률(CAGR)로 성장하고 있으며, 이는 실제 아키텍처가 데이터센터, 퍼블릭 클라우드, 엣지 노드에 걸쳐 있으며, 단일 관리 화면에서 공유해야 하기 때문입니다. 기업은 새로운 노드를 자동으로 감지하고, 수동 조정 없이 방화벽을 통해 텔레메트리를 백홀링할 수 있으며, 배포 독립적인 에이전트가 필요합니다.
벤더의 로드맵은 데이터 주권 영역을 존중하면서 세계 쿼리 기능을 유지하는 정책 기반 배치를 우선시하고 있습니다. 엣지 실적는 메트릭을 로컬에서 버퍼링하고, 연결 가능한 시간대에 집계 데이터를 중앙 저장소로 단계적으로 전송하는 스트리밍 우선 아키텍처가 필수적입니다. 이러한 하이브리드 설계는 각 사업부마다 다른 속도로 현대화를 추진하는 조직에서 장기적인 성장을 확고히 할 수 있도록 돕습니다.
2025년 기준 컨테이너 모니터링 시장 매출에서 대기업이 71.80%를 차지했습니다. 이는 복잡한 환경 규모와 엄격한 거버넌스 때문인 것으로 분석됩니다. 반면, 중소기업은 31.00%의 가장 높은 CAGR을 보였는데, 이는 종량제 및 로우터치(low-touch) SaaS 도입 프로세스가 비용과 복잡성의 장벽을 제거했기 때문입니다. 로우코드 대시보드, 자동 측정, 가이드 복구 기능을 통해 린 데브옵스 팀의 학습 곡선을 단축할 수 있습니다.
각 벤더들은 AI 코파일럿을 통합하여 깊은 성능 전문 지식 없이도 최적화할 수 있는 기회를 제공함으로써 진입장벽을 더욱 낮추고 있습니다. 디지털 퍼스트 스타트업이 규모를 확장하면서 감사 로그, 이상 징후 분석과 같은 엔터프라이즈급 기능을 조기에 도입하여 계정당 평균 수익을 늘리고 있습니다. 이러한 민주화로 인해 컨테이너 모니터링 시장은 포춘지 선정 500대 기업의 예산 범위를 넘어 확장되고 있습니다.
컨테이너 모니터링 시장은 제공 형태(소프트웨어 및 서비스), 도입 형태(클라우드 기반 등), 조직 규모(대기업, 중소기업), 컨테이너 플랫폼(Kubernetes 등), 모니터링 모드(호스트 에이전트 기반 등), 클라우드 유형(퍼블릭 클라우드 등), 최종사용자 산업(BFSI 등), 지역별로 분류됩니다. 최종 사용자 산업(BFSI 등), 지역별로 분류됩니다. 시장 예측은 금액(USD)으로 제공됩니다.
지역별 분석
북미는 성숙한 데브옵스 문화, 엄격한 규제 요건, 주요 벤더의 본사 소재지 등을 배경으로 2025년 전 세계 매출의 38.85%를 차지할 것으로 예상됐습니다. 미국 전역의 금융기관에서는 SOC 2 조회를 며칠이 아닌 몇 분 만에 처리하기 위해 eBPF를 이용한 드리프트 감지를 도입하고 있습니다. 지역별로 분산된 하이퍼스케일 클라우드 가용성 영역은 프리뷰 버전의 모니터링 기능 출시를 가속화하고, 벤더의 R&D와 정교한 얼리 어답터 피드백 루프를 통해 선순환 구조를 만들어내고 있습니다.
아시아태평양은 인도, 중국, 동남아시아의 급속한 디지털화에 힘입어 31.60%의 가장 빠른 CAGR을 나타낼 것으로 예측됩니다. 인도의 온라인 약국 Tata 1mg은 높은 카디널리티 스토리지 백엔드를 채택하여 시계열 메트릭을 압축하여 세밀함을 유지하면서 40%의 비용 절감을 달성했습니다. 중국의 대형 EC 기업들은 용도 당 수천 개의 마이크로서비스를 운영하고 있으며, 100만 개 이상의 노드에서 발생하는 콜 그래프를 해결하는 차세대 추적 분석이 요구되고 있습니다. 일본 제조업체는 컨테이너 모니터링을 MES 시스템과 통합하여 로봇의 정확도에 영향을 미칠 수 있는 공장 현장의 지연 시간을 추적하고 있습니다.
유럽에서는 데이터 처리의 최소화를 증명하는 GDPR(EU 개인정보보호규정) 주도의 가관측성으로 인해 꾸준한 보급이 이루어지고 있습니다. 독일 자동차 제조업체는 Prometheus 메트릭스와 CAN 버스 텔레메트리를 융합하여 IT와 OT 레이어를 가로지르는 통합 뷰를 구축하고 있습니다. 역내 각국 정부는 AI 책임법을 마련하고 있으며, 벤더들은 감사인이 검증할 수 있는 설명 가능한 이상 징후 감지 모델을 공개하도록 요구하고 있습니다. 이러한 요구로 인해 EU 데이터센터 내 감사 가능한 파이프라인과 영구 불변의 스토리지를 제공하는 플랫폼에 대한 선호도가 높아지고 있습니다.
라틴아메리카, 중동 및 아프리카은 신흥이면서도 빠르게 성장하고 있습니다. 하이퍼스케일 공급자의 클라우드 지역 확장으로 텔레메트리의 왕복 지연 시간이 단축되어 지역 은행과 통신 사업자들이 관리형 가시성 스위트 도입을 촉진하고 있습니다. 남아프리카공화국에서는 컨테이너 모니터링이 전국적인 5G 구축을 지원하기 위한 기반으로 활용되고 있는데, 이는 광범위한 셀 에지 클러스터의 노드 상태 분석이 필요한 전국적인 5G 구축을 지원하기 위한 것입니다. 신흥 시장의 전반적인 모멘텀은 컨테이너 모니터링 시장 솔루션에 대한 세계 수요가 다양성과 탄력성을 유지할 수 있도록 보장합니다.
기타 특전:
- 엑셀 형식 시장 예측(ME) 시트
- 애널리스트 지원(3개월)
자주 묻는 질문
목차
제1장 서론
제2장 조사 방법
제3장 주요 요약
제4장 시장 구도
제5장 시장 규모와 성장 예측
제6장 경쟁 구도
제7장 시장 기회와 향후 전망
LSH 26.03.05The container monitoring market is expected to grow from USD 1.31 billion in 2025 to USD 1.7 billion in 2026 and is forecast to reach USD 6.15 billion by 2031 at 29.4% CAGR over 2026-2031.

Surging enterprise transition to cloud-native architectures, the dominance of Kubernetes, and the rapid infusion of eBPF-enabled observability underpin this acceleration. Enterprises prioritize lightweight, kernel-level visibility that minimizes overhead while expanding telemetry depth, prompting a clear pivot away from agent-heavy tooling. Demand intensifies further as DevOps shift-left practices embed observability earlier in software lifecycles, ensuring performance guardrails before production release. Heightened regulatory expectations for security and audit trails encourage unified platforms that combine performance, compliance, and cost analytics, giving rise to sustained vendor consolidation.
Global Container Monitoring Market Trends and Insights
Growing Adoption of Cloud-Based Services
Cloud-native transformation propels the container monitoring market as enterprises re-platform monolithic applications into distributed microservices. Public cloud still held 58.7% of container workloads in 2024, yet hybrid and multi-cloud environments are scaling at 32.1% CAGR to 2030, complicating end-to-end visibility requirements. Native observability offerings from hyperscale providers reduce lock-in fears by supporting open telemetry standards while embedding cost analytics. Edge computing adds telemetry points across geographically dispersed nodes, forcing solutions to handle intermittent connectivity and resource-constrained devices. Vendors respond by packaging AI-driven correlation engines that flag anomalies across cloud, edge, and on-premise nodes in near real time.
Proliferation of Micro-Services Architecture
Breaking monoliths into hundreds of loosely coupled services multiplies monitoring endpoints, rendering host-centric approaches insufficient. Service mesh layers such as Istio and Linkerd introduce complex east-west traffic that requires distributed tracing and latency heat-mapping. Kubernetes enhances its native APIs to surface pod-level metrics, while OpenTelemetry standardizes instrumentation for metrics, logs, and traces across languages. Organizations now correlate service dependencies to isolate failures, shifting focus from infrastructure health to request pathways. Event-driven functions running inside containers further shorten execution windows, demanding high-resolution telemetry that can capture millisecond-level spans.
Tool-Chain Complexity and Skills Gap
A typical enterprise wrestles with more than six discrete observability tools, ranging from metrics stores to APM dashboards. Integrating open-source collectors with commercial analytics engines inflates operational overhead, especially for teams lacking senior SRE talent. SMEs rely heavily on managed services to bridge expertise deficits, yet rapidly evolving eBPF ecosystems outpace current certification programs. Tool sprawl introduces data silos that hinder holistic incident response, undermining ROI. Training initiatives progress, but the lag between technology release and widespread competence preserves this restraint through the medium term.
Other drivers and restraints analyzed in the detailed report include:
- DevOps Shift-Left Culture Driving Continuous Monitoring
- Rising Compliance and Container-Security Mandates
- Escalating Telemetry Storage and Licensing Costs
For complete list of drivers and restraints, kindly check the Table Of Contents.
Segment Analysis
Software platforms accounted for 69.60% of the container monitoring market share in 2025 as enterprises preferred customizable on-premise or SaaS stacks that align with internal workflows. The container monitoring market size for services, however, is projected to expand at a 30.90% CAGR to 2031, reflecting the skills deficit around multi-cloud observability rollouts. Specialized consultancies package eBPF integration, service-mesh tracing, and policy-as-code frameworks into turnkey engagements that shorten time-to-value.
Managed monitoring offerings resonate with SMEs that lack 24X7 SRE coverage, bundling AI-powered alert triage and cost optimization into subscription models. Hyperscale cloud providers expand professional services to secure long-term account stickiness, bundling observability blueprints with broader migration deals. As compliance rules tighten, audit-ready reporting services add incremental demand, ensuring that the container monitoring market continues to balance product revenue with expertise-driven engagements.
Cloud-first implementations comprised 56.90% of the container monitoring market size in 2025, benefiting from near-zero infrastructure overhead and tight coupling with cloud logs. Hybrid models are pacing a 31.20% CAGR because real-world architectures straddle data centers, public clouds, and edge nodes that must share a single pane of glass. Enterprises require deployment-agnostic agents capable of auto-discovering new nodes and backhauling telemetry through firewalls without manual tuning.
Vendor roadmaps prioritize policy-driven placement that respects data-sovereignty zones while preserving global query capabilities. Edge footprints necessitate streaming-first architectures that buffer metrics locally, then trickle aggregates to central stores during connectivity windows. Such hybrid-aware design cements long-term growth as organizations modernize at uneven velocities across business units.
Large enterprises represented 71.80% of the container monitoring market revenue in 2025, owing to complex estate sizes and stringent governance. Yet SMEs display the steepest 31.00% CAGR as consumption-based pricing and low-touch SaaS onboarding remove cost and complexity barriers. Low-code dashboards, auto-instrumentation, and guided remediation shrink the learning curve for lean DevOps teams.
Vendors embed AI copilots that surface optimization opportunities without requiring deep performance expertise, further lowering entry thresholds. As digital-first startups scale, they adopt enterprise-grade features such as audit logging and anomaly analytics early, expanding average revenue per account. This democratization broadens the container monitoring market beyond Fortune 500 budgets.
Container Monitoring Market is Segmented by Offerings (Software and Services), Deployment (Cloud-Based, and More), Organization Size (Large Enterprises and Small and Medium-Sized Enterprises), Container Platform (Kubernetes, and More), Monitoring Mode (Host-Agent-Based, and More), Cloud Type (Public Cloud, and More), End-User Industry (BFSI, and More), and Geography. The Market Forecasts are Provided in Terms of Value (USD).
Geography Analysis
North America contributed 38.85% of global revenue in 2025, buoyed by mature DevOps cultures, stringent regulatory mandates, and the headquarters presence of leading vendors. Financial institutions across the United States implement eBPF-powered drift detection to satisfy SOC 2 queries in minutes instead of days. Hyperscale cloud availability zones clustered across the region accelerate the release of preview observability features, creating a virtuous cycle between vendor R&D and sophisticated early-adopter feedback loops.
Asia-Pacific is poised for the fastest 31.60% CAGR, propelled by rapid digitization across India, China, and Southeast Asia. Indian e-pharmacy Tata 1mg achieved 40% cost savings after adopting high-cardinality storage backends that compress time-series metrics without losing granularity. Chinese e-commerce giants deploy thousands of microservices per application, forcing next-generation trace analytics that resolve call graphs exceeding a million nodes. Japanese manufacturers integrate container monitoring with MES systems to track factory-floor latency that can impact robotics precision.
Europe records steady uptake underpinned by GDPR-driven observability to prove data-processing minimization. German automotive firms blend Prometheus metrics with CAN bus telemetry to create unified views spanning IT and OT layers. Governments across the region refine AI accountability laws, prompting vendors to expose explainable anomaly detection models that auditors can review. These demands consolidate preference for platforms offering auditable pipelines and long-term immutable storage resident within EU datacenters.
Latin America, and Middle East and Africa form nascent yet accelerating pockets. Cloud region expansions by hyperscale providers shorten telemetry round-trip latency, encouraging regional banks and telcos to adopt managed observability suites. In South Africa, container monitoring underpins nationwide 5G rollouts that require node health analytics across sprawling cell-edge clusters. Collective momentum in emerging markets guarantees that global demand for container monitoring market solutions remains diversified and resilient.
- Datadog, Inc.
- Dynatrace, LLC
- Splunk Inc.
- New Relic, Inc.
- Sysdig, Inc.
- SolarWinds Worldwide, LLC
- Broadcom Inc. (CA APM)
- AppDynamics LLC
- ScienceLogic, Inc.
- LogicMonitor, Inc.
- Grafana Labs, Inc.
- Red Hat, Inc.
- Instana Inc.
- ManageEngine (Zoho Corp. Pvt Ltd.)
- Zabbix LLC
- Checkmk GmbH
- OpsRamp, Inc.
- Netdata Inc.
- StackState B.V.
- Fairwinds Ops, Inc.
- Elastic N.V.
- Zenoss, Inc.
Additional Benefits:
- The market estimate (ME) sheet in Excel format
- 3 months of analyst support
TABLE OF CONTENTS
1 INTRODUCTION
- 1.1 Study Assumptions and Market Definition
- 1.2 Scope of the Study
2 RESEARCH METHODOLOGY
3 EXECUTIVE SUMMARY
4 MARKET LANDSCAPE
- 4.1 Market Overview
- 4.2 Market Drivers
- 4.2.1 Growing adoption of cloud-based services
- 4.2.2 Proliferation of micro-services architecture
- 4.2.3 DevOps shift-left culture driving continuous monitoring
- 4.2.4 Rising compliance and container-security mandates
- 4.2.5 eBPF-enabled deep, low-overhead observability
- 4.2.6 FinOps cost-optimization pressures at container level
- 4.3 Market Restraints
- 4.3.1 Tool-chain complexity and skills gap
- 4.3.2 Escalating telemetry storage and licensing costs
- 4.3.3 Shortage of container-observability talent
- 4.3.4 Data-sovereignty limits on cross-border telemetry flows
- 4.4 Industry Value Chain Analysis
- 4.5 Regulatory Landscape
- 4.6 Technological Outlook
- 4.7 Porter's Five Forces Analysis
- 4.7.1 Threat of New Entrants
- 4.7.2 Bargaining Power of Buyers
- 4.7.3 Bargaining Power of Suppliers
- 4.7.4 Threat of Substitutes
- 4.7.5 Intensity of Competitive Rivalry
- 4.8 Impact of Macroeconomic Factors on the Market
5 MARKET SIZE AND GROWTH FORECASTS (VALUES)
- 5.1 By Offerings
- 5.1.1 Software
- 5.1.2 Services
- 5.2 By Deployment
- 5.2.1 Cloud-based
- 5.2.2 On-premise
- 5.2.3 Hybrid
- 5.3 By Organization Size
- 5.3.1 Large Enterprises
- 5.3.2 Small and Medium-sized Enterprises
- 5.4 By Container Platform
- 5.4.1 Kubernetes
- 5.4.2 Docker Swarm
- 5.4.3 Apache Mesos
- 5.4.4 HashiCorp Nomad
- 5.4.5 Other Runtimes
- 5.5 By Monitoring Mode
- 5.5.1 Host-agent-based
- 5.5.2 Sidecar/Service-mesh
- 5.5.3 Agentless/eBPF
- 5.6 By Cloud Type
- 5.6.1 Public Cloud
- 5.6.2 Private Cloud
- 5.6.3 Hybrid Multi-cloud
- 5.7 By End-user Industry
- 5.7.1 IT and Telecom
- 5.7.2 BFSI
- 5.7.3 Retail and E-commerce
- 5.7.4 Manufacturing and Industrial
- 5.7.5 Healthcare and Life Sciences
- 5.7.6 Other End-user Industries
- 5.8 By Geography
- 5.8.1 North America
- 5.8.1.1 United States
- 5.8.1.2 Canada
- 5.8.1.3 Mexico
- 5.8.2 South America
- 5.8.2.1 Brazil
- 5.8.2.2 Argentina
- 5.8.2.3 Chile
- 5.8.2.4 Rest of South America
- 5.8.3 Europe
- 5.8.3.1 Germany
- 5.8.3.2 United Kingdom
- 5.8.3.3 France
- 5.8.3.4 Italy
- 5.8.3.5 Spain
- 5.8.3.6 Rest of Europe
- 5.8.4 Asia-Pacific
- 5.8.4.1 China
- 5.8.4.2 India
- 5.8.4.3 Japan
- 5.8.4.4 South Korea
- 5.8.4.5 Malaysia
- 5.8.4.6 Singapore
- 5.8.4.7 Australia
- 5.8.4.8 Rest of Asia-Pacific
- 5.8.5 Middle East and Africa
- 5.8.5.1 Middle East
- 5.8.5.1.1 United Arab Emirates
- 5.8.5.1.2 Saudi Arabia
- 5.8.5.1.3 Turkey
- 5.8.5.1.4 Rest of Middle East
- 5.8.5.2 Africa
- 5.8.5.2.1 South Africa
- 5.8.5.2.2 Nigeria
- 5.8.5.2.3 Rest of Africa
- 5.8.5.1 Middle East
- 5.8.1 North America
6 COMPETITIVE LANDSCAPE
- 6.1 Market Concentration
- 6.2 Strategic Moves
- 6.3 Market Share Analysis
- 6.4 Company Profiles (includes Global level Overview, Market level overview, Core Segments, Financials as available, Strategic Information, Market Rank/Share for key companies, Products and Services, and Recent Developments)
- 6.4.1 Datadog, Inc.
- 6.4.2 Dynatrace, LLC
- 6.4.3 Splunk Inc.
- 6.4.4 New Relic, Inc.
- 6.4.5 Sysdig, Inc.
- 6.4.6 SolarWinds Worldwide, LLC
- 6.4.7 Broadcom Inc. (CA APM)
- 6.4.8 AppDynamics LLC
- 6.4.9 ScienceLogic, Inc.
- 6.4.10 LogicMonitor, Inc.
- 6.4.11 Grafana Labs, Inc.
- 6.4.12 Red Hat, Inc.
- 6.4.13 Instana Inc.
- 6.4.14 ManageEngine (Zoho Corp. Pvt Ltd.)
- 6.4.15 Zabbix LLC
- 6.4.16 Checkmk GmbH
- 6.4.17 OpsRamp, Inc.
- 6.4.18 Netdata Inc.
- 6.4.19 StackState B.V.
- 6.4.20 Fairwinds Ops, Inc.
- 6.4.21 Elastic N.V.
- 6.4.22 Zenoss, Inc.
7 MARKET OPPORTUNITIES AND FUTURE OUTLOOK
- 7.1 White-space and unmet-need assessment
