
|
시장보고서
상품코드
1937263
통신 서비스 보증 : 시장 점유율 분석, 업계 동향과 통계, 성장 예측(2026-2031년)Telecom Service Assurance - Market Share Analysis, Industry Trends & Statistics, Growth Forecasts (2026 - 2031) |
||||||
통신 서비스 보증 시장은 2025년에 122억 5,000만 달러로 평가되며, 2026년 134억 6,000만 달러에서 2031년까지 215억 8,000만 달러에 달할 것으로 예측됩니다.
예측 기간(2026-2031년)의 CAGR은 9.88%로 예상됩니다.
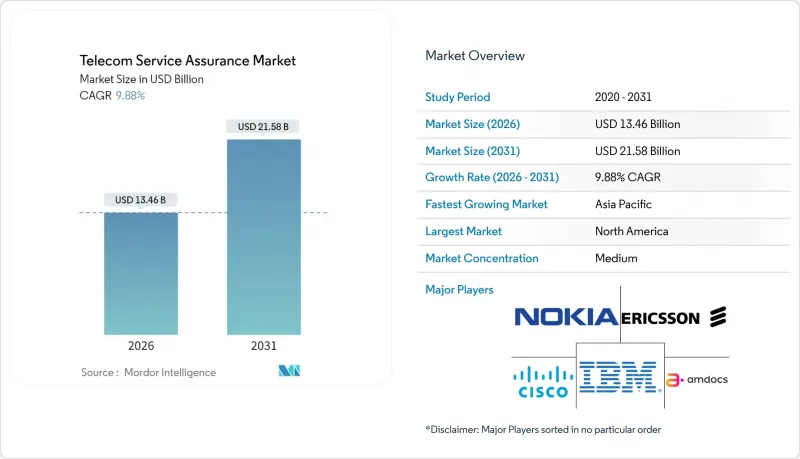
성능 모니터링에 대한 요구 증가, 5G 독립형 도입, AI 중심의 제로 터치 운영, 통신사업자들이 사후 대응형에서 사전 대응형 네트워크 관리 패러다임으로 전환하면서 단기적으로 지출을 늘리고 있습니다. 프라이빗 네트워크와 IoT의 수직적 이용 사례가 대상 시장을 확대하는 한편, 하이퍼스케일러와의 제휴를 통해 보증 아키텍처는 클라우드 네이티브 및 오픈 API 설계로 방향을 전환하고 있습니다. 경쟁의 강도는 중간 수준을 유지하고 있으며, 대형 다국적 기업은 인수를 통해 인접한 기능을 통합하고, 엔드 투 엔드 포트폴리오를 강화하기 위해 노력하고 있습니다. 2025년에도 북미가 시장을 장악했으나, 아시아태평양의 빠른 5G 구축과 기업의 디지털화가 가장 빠른 지역 성장을 이끌었습니다. STIR/SHAKEN에서 EU AI 법규에 이르기까지 점점 늘어나는 컴플라이언스 요구사항은 통신 서비스 보증 시장을 미션 크리티컬한 지출 카테고리로 더욱 확고히 하고 있습니다.
세계 통신 서비스 보증 시장 동향 및 인사이트
AI 중심의 제로터치 운영 도입
2024-2025년까지 통신 사업자들이 운영 비용 절감과 서비스 품질 향상을 목표로 TM 포럼의 자율성 레벨 4-5를 달성하기 위해 광범위한 자동화 구상을 통해 네트워크 운영을 재구축하고 있습니다. 에릭슨과 AWS가 공동 개발한 Agentic AI는 의도 기반 오케스트레이션이 수동 개입을 줄이고 고객 만족도를 향상시킨다는 것을 입증했습니다. TM포럼의 경제모델에 따르면 AI 기반 폐쇄형 루프 제어가 성숙 단계에 접어들면 Tier 1 사업자당 연간 평균 8억 달러의 비용절감 효과가 있을 것으로 예측됩니다. 2024년 말까지 전 세계 통신 사업자의 87%가 최소 한 가지 이상의 AI 이용 사례를 도입했으나, 절반이 '파편화된 데이터 수집'을 가장 큰 장벽으로 꼽아 통합 보증 데이터 레이크에 대한 수요를 촉진했습니다. 규제 당국도 힘을 보탰습니다. EU의 AI 법은 투명성과 감사 가능성을 갖춘 모델을 요구하고, 설명 가능성을 통합한 보증 플랫폼의 조달 기준을 강화했습니다. 이러한 요인들이 결합되어 AI 네이티브 보증 모듈에 대한 지출 배분이 확대되고 통신 서비스 보증 시장의 성장이 가속화되었습니다.
5G SA 구축에 필요한 실시간 SLA 가시성 확보
2024년에는 북미, 유럽 및 주요 아시아태평양 시장에서 5G 독립형 상용 네트워크가 대규모로 가동될 것이며, 이에 따라 전례 없는 수준의 내결함성 요구사항이 요구될 것입니다. NETSCOUT은 가상 탭 기술을 출시하여 클라우드화된 코어 전체에서 마이크로초 단위의 분석이 가능한 100Gbps 트래픽 스트림을 수집할 수 있게 되었습니다. Spirent의 액티브 어슈어런스 프로브는 고객에게 영향을 미치기 전에 슬라이스 성능을 검증하는 합성 트래픽을 생성하여 기존의 반응형 운영 모델을 전환했습니다. 서비스 프로바이더는 전송, 코어, RAN의 메트릭을 통합 대시보드로 연결하는 슬라이스 분석에 우선순위를 두었습니다. 이는 기존의 OSS/BSS가 커버할 수 없었던 영역입니다. 표준화 단체인 TM Forum과 3GPP는 슬라이스별 KPI를 확정하고, 벤더들이 이를 네이티브에 통합하도록 추진했습니다. 특히 로봇 및 AR 분야에서 기업의 SLA에 대한 기대치가 높아지면서 실시간 보증은 선택적 기능에서 계약상 필수 요건으로 더욱 강화되었습니다.
Tier 1 MNO의 설비투자 동결(2024-25년)
2024년 5G 무선설비 구축이 정점을 찍고 거시경제의 불확실성이 높아지면서 통신사업자의 설비투자는 급격히 축소되었습니다. Dell'Oro의 조사에 따르면 업계 전체 설비투자는 전년 대비 8% 감소했으며, 2027년까지 연평균 2%의 성장률을 보일 것으로 예측됩니다. 미국의 주요 통신사들은 인프라 지출을 전년도 예산 대비 약 50% 삭감하고, 비필수적인 소프트웨어 확장을 연기했습니다. 보증 업체들은 판매 주기가 길어지고 ROI(투자수익률)에 대한 엄격한 심사에 직면했으나, 예측 유지보수 및 에너지 최적화와 같은 비용 절감의 장점을 활용하여 조달 후보 리스트에 남게 되었습니다. 애널리스트들은 5G 수익화 시책이 성숙해지는 2025년 말에 예산이 풀릴 것으로 예상하고 있으며, 보증 지출은 RAN(무선 액세스 네트워크)의 재집중화와 함께 회복될 것으로 전망하고 있습니다.
부문 분석
성능 모니터링 및 분석 분야는 2025년 34.78%의 매출을 차지할 것으로 예상되며, 주요 네트워크 현대화 프로그램의 기반이 되고 있습니다. 이 부문의 높은 점유율은 무선, 전송 및 핵심 영역에 대한 실시간 가시성 확보에 대한 시급한 요구가 반영된 결과입니다. 시스코의 AI 강화 텔레메트리 스트림은 사업자가 임계값 기반 경보에서 혼잡을 방지하는 예측 분석으로 전환한 좋은 예입니다. 성능 모니터링과 관련된 통신 서비스 보증 시장 규모는 슬라이스 지원 메트릭스의 확대로 인해 견고한 한 자릿수 중반의 CAGR을 유지할 것으로 예측됩니다.
자동화된 근본 원인 파악 및 복구는 TM 포럼의 레벨 4 자율성 목표에 힘입어 2031년까지 연평균 복합 성장률(CAGR) 11.02%로 예측되는 고성장 틈새 시장으로 부상했습니다. 통신사업자는 열화된 슬라이스를 몇 초 만에 자가 복구하는 폐루프 피드백을 통해 평균복구시간(MTTR)을 최대 60%까지 단축했습니다. 각 벤더들은 수십억 개의 이벤트를 상관관계 분석하여 복구 스크립트를 제안하는 머신러닝 정책 엔진을 번들로 제공함으로써 문제 해결 인력을 줄였습니다. 2025년에는 30개 이상의 세계 통신사업자가 근본 원인 AI 모듈에 대한 RFP를 발행하여 파일럿 단계에서 주류 도입으로 가는 성숙 경로를 제시하고 있습니다.
2025년에도 On-Premise 플랫폼은 50.62%의 점유율을 유지했습니다. 이는 통신사업자가 기밀성이 높은 핵심 데이터를 엄격하게 관리하고자 하는 의도를 반영한 것입니다. 그러나 컨테이너화와 CI/CD 파이프라인의 확산으로 통신 서비스 보증 시장의 클라우드 네이티브형 솔루션은 연간 12.08%의 성장률을 보였습니다. 레드햇의 쿠버네티스 기반 오픈소스 레퍼런스 스택은 탄력적인 확장성과 매니지드 서비스를 통한 비용 우위를 보여주었습니다. 동시에 인포비스타의 KLERITY는 멀티 테넌트 기능을 갖춘 벤더 독립적인 보증을 제공하며, SaaS 모드로 기업 고객을 지원합니다.
하이브리드 모드가 표준 아키텍처로 부상하고 있습니다. 대규모 패킷 중개 및 합법적인 가로채기 워크로드는 On-Premise에 유지하면서, AI 훈련 및 장기 분석은 퍼블릭 클라우드로 전환하는 형태입니다. 이러한 이중 구조로 데이터 주권 지침에 대응하면서도 모델 훈련에 하이퍼스케일러의 GPU를 활용할 수 있습니다. 하이브리드 아키텍처의 통신 서비스 보증 시장 규모는 2031년까지 102억 9,000만 달러에 달할 것으로 예상되며, 전체 시장의 CAGR과 동일한 성장률로 확대될 것으로 예측됩니다.
지역별 분석
북미는 2025년 31.88%의 점유율을 유지했습니다. 이는 STIR/SHAKEN 준수 기한과 독립형 핵심 기술의 조기 상용화가 주도하고 있습니다. AT&T, Verizon 등의 사업자는 기지국 전력 소비를 5% 절감하는 레벨 4 에너지 최적화 이용 사례를 시범 도입했습니다. AWS 및 Google Cloud와의 통합으로 이 지역에서는 보증을 코드화하는 파이프라인으로의 전환이 가속화되고 있습니다. 북미 관련 통신 서비스 보증 시장 규모는 민간 5G 구상의 확대에 따라 2031년까지 71억 8,000만 달러에 달할 것으로 예상되며, 한 자릿수 성장세를 유지할 것으로 전망됩니다.
아시아태평양은 인도, 태국, 호주의 전국적인 5G 커버리지를 바탕으로 2031년까지 연평균 12.12%의 성장률을 기록하며 주요 성장 동력으로 부상할 것으로 예측됩니다. Fitch Ratings는 아시아태평양의 많은 통신 사업자들에게 안정적인 신용 지표를 확인하여 보증 현대화에 대한 지속적인 투자를 가능하게 했습니다. 주요 제조 산업에서 기업 5G와 대규모 IoT의 도입으로 인해, 슬라이스 대응 및 디바이스 중심 모니터링에 대한 수요가 증가하여 LTE 시절에 비해 평균 계약 규모가 두 배로 증가했습니다.
유럽에서는 GDPR(EU 개인정보보호규정)과 다가올 EU AI 법규의 컴플라이언스 부담과 오픈 RAN의 다양화라는 두 마리 토끼를 잡으면서 여전히 큰 기회가 남아있습니다. 통신사업자들은 여러 RU/DU 공급업체를 통합하는 벤더 중립적인 대시보드를 원하고 있으며, 분산형 보증의 매력을 높이고 있습니다. 중동 및 아프리카에서는 정부의 디지털 경제 구상에 따른 Comarch의 멀티 도메인 OSS 도입이 견인차 역할을 했습니다. 라틴아메리카는 5G 보급의 전환점을 맞이하고 있으며, GSMA는 2030년까지 5G 보급률 60%를 예측했습니다. 이러한 전환을 위해서는 제한된 설비 투자 예산을 보완할 수 있는 클라우드 기반 보증 솔루션이 필수적입니다.
기타 특전:
- 엑셀 형식 시장 예측(ME) 시트
- 애널리스트의 3개월간 지원
자주 묻는 질문
목차
제1장 서론
제2장 조사 방법
제3장 개요
제4장 시장 구도
제5장 시장 규모와 성장 예측
제6장 경쟁 구도
제7장 시장 기회와 향후 전망
KSA 26.03.06The telecom service assurance market was valued at USD 12.25 billion in 2025 and estimated to grow from USD 13.46 billion in 2026 to reach USD 21.58 billion by 2031, at a CAGR of 9.88% during the forecast period (2026-2031).

Heightened performance-monitoring needs, 5G standalone adoption, and AI-centric zero-touch operations have boosted near-term spending as operators transition from reactive to proactive network management paradigms. Private-network and IoT vertical use cases are widening the addressable base, while hyperscaler partnerships are redirecting assurance architectures toward cloud-native, open-API designs. Competitive intensity has remained moderate; large multinationals are consolidating adjacent capabilities through acquisitions to strengthen end-to-end portfolios. North America continued to dominate in 2025, yet Asia Pacific's swift 5G rollout and enterprise digitalization yielded the fastest regional growth. Multiplying compliance mandates-from STIR/SHAKEN to the EU AI Act-have further entrenched the telecom service assurance market as a mission-critical spend category.
Global Telecom Service Assurance Market Trends and Insights
AI-centric Zero-touch Operations Adoption
Widespread automation initiatives reshaped network operations in 2024-2025 as operators pursued TM Forum Level 4-5 autonomy to curb operating expenses and sharpen service quality. Ericsson's joint work with AWS on Agentic AI proved that intent-based orchestration can cut manual interventions and lift customer satisfaction. TM Forum economic modelling estimated average annual savings of USD 800 million per tier-1 operator once AI-driven closed-loop control matures. Eighty-seven percent of global carriers had at least one production AI use case by late-2024, yet half cited fragmented data collection as the top barrier, spurring demand for unified assurance data lakes. Regulators added momentum: the EU AI Act requires transparent and auditable models, strengthening procurement criteria for assurance platforms that embed explainability. These forces collectively enlarged spending allocations to AI-native assurance modules, reinforcing growth in the telecom service assurance market.
5G SA Roll-out Demanding Real-time SLA Visibility
Commercial 5G standalone networks ran at scale in North America, Europe, and key Asia Pacific markets during 2024, triggering unprecedented resiliency requirements. NETSCOUT released virtual tap technology to ingest 100 Gbps traffic streams for microsecond-level analytics across cloudified cores. Spirent's active-assurance probes generated synthetic traffic to validate slice performance before customer impact, reversing long-standing reactive operating models. Service providers prioritized slice-aware analytics that tie transport, core, and RAN metrics into unified dashboards, a gap that traditional OSS/BSS could not cover. Standards groups TM Forum and 3GPP finalized slice-specific KPIs, propelling vendors to embed them natively. Heightened enterprise SLA expectations-especially for robotics and AR-further elevated real-time assurance from an optional feature to a contractual necessity.
Capex Freezes by Tier-1 MNOs 2024-25
Carrier capex contracted sharply in 2024 as 5G radio builds peaked and macroeconomic uncertainty rose. Dell'Oro's tracking placed industry capex 8% lower year-over-year, with projections for a 2% CAGR decline through 2027. Large United States operators reduced infrastructure outlays by roughly 50% versus prior budgets, delaying non-essential software expansions. Assurance vendors faced extended sales cycles and heightened ROI scrutiny; however, they leveraged cost-savings narratives-predictive maintenance and energy optimization-to remain on procurement short lists. Analysts expect budgets to thaw in late-2025 once 5G monetization initiatives mature, positioning assurance spending to rebound alongside renewed RAN densification.
Other drivers and restraints analyzed in the detailed report include:
- Compliance Pressure (STIR/SHAKEN, GDPR, EU AI Act)
- Telco API Monetization Needs End-to-end Quality
- Legacy OSS/BSS Integration Complexity
For complete list of drivers and restraints, kindly check the Table Of Contents.
Segment Analysis
Performance Monitoring and Analytics captured 34.78% revenue in 2025, underpinning every major network-modernization program. The segment's high share reflected urgent needs to visualize radio, transport, and core domains in real time. Cisco's AI-augmented telemetry streams exemplified how operators pivoted from threshold-based alarms to predictive analytics that pre-empt congestion. The telecom service assurance market size tied to Performance Monitoring is projected to maintain a robust mid-single-digit CAGR as slice-aware metrics expand.
Automated Root-Cause and Remediation rose as the high-growth niche, forecast at 11.02% CAGR through 2031, propelled by TM Forum Level-4 autonomy targets. Carriers demanded closed-loop feedback that self-heals degraded slices within seconds, slashing MTTR by up to 60%. Vendors bundled machine-learning policy engines that correlate billions of events and recommend remediation scripts, compressing troubleshooting head-counts. Over 30 global operators issued RFPs for root-cause AI modules during 2025, signaling a maturation path from pilot to mainstream adoption.
On-premises platforms still held 50.62% share in 2025 as operators sought tight control over sensitive core data. However, cloud-native instances of telecom service assurance market solutions expanded 12.08% annually, enabled by containerization and CI/CD pipelines. Red Hat's Kubernetes-based OSS reference stack showcased cost benefits from elastic scaling and managed services. Simultaneously, Infovista's KLERITY delivered vendor-agnostic assurance with multi-tenancy to serve enterprise customers in SaaS mode.
Hybrid mode is emerging as the default architecture: heavy packet brokering and lawful-intercept workloads remain on-premises, while AI training and long-term analytics shift to public clouds. This duality addresses data-sovereignty directives yet harnesses hyperscaler GPUs for model training. The telecom service assurance market size for hybrid architectures is forecast at USD 10.29 billion by 2031, advancing on par with overall market CAGR.
The Telecom Service Assurance Market Report is Segmented by Solution Type (Fault and Event Management, Performance Monitoring and Analytics, and More), Deployment Mode (On-Premises, Cloud-Native, and Hybrid), Operator Type (Mobile Network Operators, Fixed and Cable Operators, and More), Application Domain (5G RAN Assurance, Core and Edge Assurance, and More), and Geography. The Market Forecasts are Provided in Terms of Value (USD).
Geography Analysis
North America sustained 31.88% share in 2025, fueled by STIR/SHAKEN compliance deadlines and early standalone-core commercialization. Operators such as AT&T and Verizon piloted Level-4 energy-optimization use cases that trimmed cell-site power by 5%. Integration with AWS and Google Cloud advanced the regional shift toward assurance-as-code pipelines. The telecom service assurance market size tied to North America is projected at USD 7.18 billion by 2031, maintaining mid-single-digit growth as private-5G initiatives scale.
Asia Pacific rose as the primary growth engine, logging a 12.12% CAGR through 2031 on the back of nationwide 5G coverage in India, Thailand, and Australia. Fitch Ratings affirmed stable credit metrics for many Asia-Pacific telcos, enabling sustained investments in assurance modernization. Enterprise 5G and massive IoT deployments across manufacturing corridors spurred demand for slice-aware and device-centric monitoring, doubling average deal sizes compared with LTE-era contracts.
Europe retained significant opportunity, balancing GDPR and impending EU AI Act compliance burdens with open-RAN diversification. Operators sought vendor-neutral dashboards that reconcile multiple RU/DU suppliers, elevating the appeal of disaggregated assurance. Middle East and Africa gained traction through Comarch's multi-domain OSS rollouts, which align with government digital-economy blueprints. Latin America approached the tipping point for 5G dominance, with GSMA projecting 60% 5G penetration by 2030. This transition necessitates cloud-hosted assurance to offset constrained capex budgets.
- ASM Global
- Informa PLC
- Messe Frankfurt GmbH
- Reed Exhibitions (RX Global)
- Maritz Global Events Inc.
- MCI Group
- Cvent Holding Corp.
- GL Events SA
- Comexposium
- Fiera Milano SpA
- Koelnmesse GmbH
- Tarsus Group
- SMG (merged into ASM Global)
- Clarion Events Ltd.
- Viad Corp (GES)
- Emerald Holding Inc.
- Hyve Group plc
- dmg events
- Freeman Company
- Itochu Corp (Congrex)
Additional Benefits:
- The market estimate (ME) sheet in Excel format
- 3 months of analyst support
TABLE OF CONTENTS
1 INTRODUCTION
- 1.1 Study Assumptions and Market Definition
- 1.2 Scope of the Study
2 RESEARCH METHODOLOGY
3 EXECUTIVE SUMMARY
4 MARKET LANDSCAPE
- 4.1 Market Overview
- 4.2 Market Drivers
- 4.2.1 Rapid rebound of in-person business travel budgets
- 4.2.2 Corporate sustainability mandates shifting toward carbon-neutral events
- 4.2.3 Technology-enabled hybrid formats expanding attendee reach
- 4.2.4 Destination marketing incentives in emerging economies
- 4.2.5 Experiential design demand from Gen-Z/Millennial workforces
- 4.2.6 Large-scale infrastructure build-outs in Gulf and ASEAN markets
- 4.3 Market Restraints
- 4.3.1 Volatile air-travel and accommodation pricing
- 4.3.2 Geopolitical uncertainty and visa restrictions
- 4.3.3 Data-privacy and cybersecurity compliance costs for hybrid events
- 4.3.4 Rising ESG scrutiny on event-related carbon footprints
- 4.4 Industry Value Chain Analysis
- 4.5 Regulatory Landscape
- 4.6 Technological Outlook
- 4.7 Porter's Five Forces Analysis
- 4.7.1 Threat of New Entrants
- 4.7.2 Bargaining Power of Buyers
- 4.7.3 Bargaining Power of Suppliers
- 4.7.4 Threat of Substitutes
- 4.7.5 Competitive Rivalry
5 MARKET SIZE AND GROWTH FORECASTS (VALUE)
- 5.1 By Event Type
- 5.1.1 Meetings
- 5.1.2 Incentives
- 5.1.3 Conferences
- 5.1.4 Exhibitions
- 5.1.5 Hybrid/Virtual Events
- 5.2 By Service Type
- 5.2.1 Event Planning and Management
- 5.2.2 Venue Rental
- 5.2.3 Transportation and Logistics
- 5.2.4 Accommodation
- 5.2.5 Food and Catering
- 5.2.6 Audio-Visual and Technology Services
- 5.2.7 Other Service Types
- 5.3 By Venue Type
- 5.3.1 Convention Centers
- 5.3.2 Hotels and Resorts
- 5.3.3 Outdoor / Unconventional Venues
- 5.3.4 Corporate Owned Facilities
- 5.4 By Industry Vertical
- 5.4.1 IT and Telecom
- 5.4.2 Healthcare and Pharmaceuticals
- 5.4.3 Banking, Financial Services and Insurance (BFSI)
- 5.4.4 Automotive and Manufacturing
- 5.4.5 Hospitality and Tourism
- 5.4.6 Government and Public Sector
- 5.4.7 Other Industry Verticals
- 5.5 By Geography
- 5.5.1 North America
- 5.5.1.1 United States
- 5.5.1.2 Canada
- 5.5.1.3 Mexico
- 5.5.2 South America
- 5.5.2.1 Brazil
- 5.5.2.2 Argentina
- 5.5.2.3 Rest of South America
- 5.5.3 Europe
- 5.5.3.1 Germany
- 5.5.3.2 United Kingdom
- 5.5.3.3 France
- 5.5.3.4 Italy
- 5.5.3.5 Spain
- 5.5.3.6 Russia
- 5.5.3.7 Rest of Europe
- 5.5.4 Asia Pacific
- 5.5.4.1 China
- 5.5.4.2 Japan
- 5.5.4.3 India
- 5.5.4.4 South Korea
- 5.5.4.5 Australia
- 5.5.4.6 Rest of Asia Pacific
- 5.5.5 Middle East and Africa
- 5.5.5.1 Middle East
- 5.5.5.1.1 United Arab Emirates
- 5.5.5.1.2 Saudi Arabia
- 5.5.5.1.3 Turkey
- 5.5.5.1.4 Rest of Middle East
- 5.5.5.2 Africa
- 5.5.5.2.1 South Africa
- 5.5.5.2.2 Nigeria
- 5.5.5.2.3 Kenya
- 5.5.5.2.4 Rest of Africa
- 5.5.5.1 Middle East
- 5.5.1 North America
6 COMPETITIVE LANDSCAPE
- 6.1 Market Concentration
- 6.2 Strategic Moves
- 6.3 Market Share Analysis
- 6.4 Company Profiles (includes Global level Overview, Market level overview, Core Segments, Financials as available, Strategic Information, Market Rank/Share for key companies, Products and Services, and Recent Developments)
- 6.4.1 ASM Global
- 6.4.2 Informa PLC
- 6.4.3 Messe Frankfurt GmbH
- 6.4.4 Reed Exhibitions (RX Global)
- 6.4.5 Maritz Global Events Inc.
- 6.4.6 MCI Group
- 6.4.7 Cvent Holding Corp.
- 6.4.8 GL Events SA
- 6.4.9 Comexposium
- 6.4.10 Fiera Milano SpA
- 6.4.11 Koelnmesse GmbH
- 6.4.12 Tarsus Group
- 6.4.13 SMG (merged into ASM Global)
- 6.4.14 Clarion Events Ltd.
- 6.4.15 Viad Corp (GES)
- 6.4.16 Emerald Holding Inc.
- 6.4.17 Hyve Group plc
- 6.4.18 dmg events
- 6.4.19 Freeman Company
- 6.4.20 Itochu Corp (Congrex)
7 MARKET OPPORTUNITIES AND FUTURE OUTLOOK
- 7.1 White-space and Unmet-Need Assessment

