
|
시장보고서
상품코드
1937309
규사 : 시장 점유율 분석, 업계 동향과 통계, 성장 예측(2026-2031년)Silica Sand - Market Share Analysis, Industry Trends & Statistics, Growth Forecasts (2026 - 2031) |
||||||
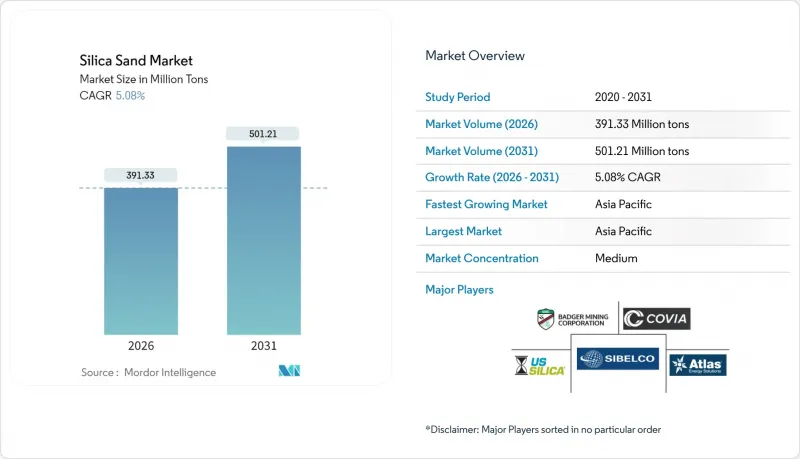
규사 시장은 2025년 3억 7,242만 톤에서 2026년에는 3억 9,133만 톤으로 성장하고, 2026년부터 2031년까지 CAGR 5.08%를 기록하며 2031년까지 5억 121만 톤에 달할 것으로 예측됩니다.
이러한 상승 추세는 고순도 유리, 반도체 웨이퍼, 수압파쇄용 프로판트 및 다양한 산업용 충전재에서 이 광물이 핵심적인 역할을 하고 있기 때문입니다. 환경 규제 강화에도 불구하고 초고투명 태양전지용 유리의 가격 프리미엄, 셰일 우물 수의 지속적 증가, 반도체 제조 공장의 신규 지역 진출이 수요를 뒷받침하고 있습니다. 공급망은 점차 지역화되었고, 분지 내 광산과 다운스트림부문의 협력으로 물류비용이 상쇄되어 허가 지연의 영향을 최소화하고 있습니다. 경쟁적 차별화는 품질 인증, 먼지 저감 기술, 추적성 시스템에 점점 더 의존하고 있으며, 이는 구매자가 건강 및 안전 규정 준수를 관리하는 데 도움이 됩니다.
세계 규사 시장 동향 및 전망
고투명 평면 유리 및 태양열 유리에 대한 수요 증가
태양광발전용 유리 공장에서는 99.99% 이상의 SiO2 함유 원료를 요구하고 있으며, 중국의 태양광발전 설비 증설로 인해 기존 플로트 유리 라인의 공급이 타이트한 가운데, 현물 가격은 톤당 55달러에 근접하고 있습니다. 캐나다 프리미엄 샌드(Canadian Premium Sand)를 비롯한 신규 진입 기업들은 2027년까지 100GW 이상의 패널 생산량에 대응하기 위해 수직통합형 용광로 계획을 추진하고 있습니다. 다국적 플로트 유리 제조업체는 에너지 효율 향상과 고순도 모래의 장기 공급 계약 확보를 위한 용광로 개조에 약 1억 8,000만 달러를 투자할 방침으로, 규사 시장 동향을 뒷받침하고 있습니다. 이러한 자본 투입은 제조업체들이 ISO 9001 표준 인증 저탄소 유리 생산 기술을 추구하는 가운데 고품질 규사가 공급에 있어 중요한 원료로 남아있음을 보여줍니다.
셰일 우물 1공당 프랙샌드 사용량 급증
수평정 1개당 모래 사용량은 우물 연장 및 스테이지 수 증가로 인해 2013년 대비 평균 1,060% 증가하였습니다. 습식 모래 물류로 디젤 사용량 90% 감소, 우물당 10만-30만 달러의 비용 절감. 이에 따라 납품 비용의 변동을 억제하는 분지 내산 브라운샌드로의 전환이 가속화되고 있습니다. OSHA의 호흡성 실리카 규제에 따라 신형 집진 후드 및 밀폐형 컨베이어 채택 추세가 진행되어, 규사 시장에서는 규격 중심의 조달 추세가 정착. 이를 통해 인증 획득 공급업체가 우위를 점하고 있습니다.
높아진 환경 허가 허들
2024년 6월에 시행된 MSHA 실리카 규제는 허용 노출 농도를 50μg/m3로 낮추고 의무적인 건강진단을 추가하여 신규 및 기존 광산 모두에서 컴플라이언스 비용이 증가하고 있습니다. 매니토바 주에서는 규제 당국이 더 자세한 수문지질학적 조사를 요구함에 따라 Sio Silica의 광산 계획이 정체된 상태입니다. 유럽화학제품청(ECHA)의 초안은 작업장 노출 기준 강화를 시사하고 있으며, 밀폐형 처리 회로가 없는 소규모 채석장의 생산량 감소로 이어질 수 있습니다. 이러한 높은 장벽은 신규 프로젝트를 억제하고, 완전한 ESG 보고 프레임워크를 갖춘 사업자에게 생산이 집중될 것으로 예상됩니다.
부문 분석
이산화규소(SiO2) 함량이 99.5% 이상인 고순도 등급은 규사 시장에서 가장 높은 CAGR 6.19%를 기록했습니다. 초순수 모래는 반도체 도가니, 태양전지용 플로트 유리, 리튬이온 배터리 분리막의 기질을 제공합니다. Sibelco의 스프루스파인 확장 계획과 호주 실리카 쿼츠 그룹의 99.997% 순도 달성을 위한 노력은 부가가치 생산능력의 규모 확대를 여실히 보여주고 있습니다.
표준 등급(SiO2 함량 95-99.5%)의 재료는 여전히 주요 공급원이며, 2025년 규사 시장 점유율의 47.58%를 차지할 것으로 예상됩니다. 수요처는 주조용 주형, 건설용 골재, 여과재 등입니다. 철광석 잔여물 정제 기술과 같이 폐기물을 99.99% 순도로 끌어올리는 혁신은 지속가능성과 수익성 향상을 동시에 달성할 수 있지만, 95% 미만의 저순도 모래는 주로 지역 레디믹스트 콘크리트 및 되메우기 용도로만 사용됩니다.
본 규사 보고서는 순도 수준(고순도 : 99.5% SiO2 이상, 표준 : 95-99.5% 미만의 저순도), 최종사용자 산업(유리 제조, 주조, 화학제품 제조, 건설, 페인트 및 코팅, 세라믹 및 내화물, 여과, 석유 및 가스, 기타 최종사용자 산업), 지역(아시아, 아메리카, 유럽, 중동 및 아프리카) 태평양, 북미, 유럽, 남미, 중동 및 아프리카) 별로 분류되어 있습니다.
지역별 분석
아시아태평양은 세계 생산량의 40.21%를 차지하며, 중국의 태양광발전 붐, 인도의 도시 교통 회랑, 인도네시아의 457억 4,000만 달러 규모의 실리콘 다운스트림 사업 계획에 힘입어 6.27%의 CAGR로 성장할 것으로 예상됩니다. 호주 케이프플래터리 광산(SiO2 함량 99.93%)으로 인해 퀸즐랜드주는 2030년까지 생산량을 3배로 확대할 것으로 예상됩니다.
북미의 소비는 셰일 프로판을 중심으로 추진되고 있습니다. 미국은 2024년부터 2025년까지 8억 9천만 달러 상당의 규사를 수출하고 있으며, 캐나다와 일본이 주요 구매국입니다. 멕시코는 제조업의 성장이 수입을 주도하고 있으며, USMCA(미국 - 멕시코-캐나다 협정)의 무역 관계와 미국 공급업체와의 지리적 근접성이 기여하고 있습니다. 2024년 6월부터 시행되는 미국 광산안전보건청(MSHA)의 새로운 실리카 규정에 따라 이 지역의 규제 환경이 강화되어 종합적인 노출 모니터링 및 의료 감시 프로그램이 의무화될 예정입니다.
유럽의 규사 산업은 건설 수요 둔화의 영향으로 어려운 상황에 직면해 있지만, 전문 분야는 성장세를 유지하고 있습니다. 유럽화학제품청의 노출한계치안으로 인해 밀폐처리가 이미 표준화된 북유럽 지역에 공급이 집중될 것으로 예상됩니다. 중동 및 아프리카는 인프라 프로젝트와 유리 용기 수요를 주도하고, 남미의 매력은 자동차 공급망 전환과 새로운 중요 광물 정책에 있습니다.
기타 특전:
- 엑셀 형식의 시장 예측(ME) 시트
- 애널리스트의 3개월간 지원
자주 묻는 질문
목차
제1장 소개
제2장 조사 방법
제3장 주요 요약
제4장 시장 구도
제5장 시장 규모와 성장 예측(금액 및 수량)
제6장 경쟁 구도
제7장 시장 기회와 향후 전망
KSM 26.03.12The Silica Sand market is expected to grow from 372.42 Million tons in 2025 to 391.33 Million tons in 2026 and is forecast to reach 501.21 Million tons by 2031 at 5.08% CAGR over 2026-2031.

The upward trajectory is tied to the central role the mineral plays in high-purity glass, semiconductor wafers, hydraulic fracturing proppants, and a wide array of industrial fillers. Price premiums for ultra-clear solar glass, persistent growth in shale well counts, and the spread of semiconductor fabs into new regions are together sustaining demand even as environmental regulations tighten. Supply chains are gradually localizing, with in-basin mines and downstream alliances offsetting logistics costs and minimizing exposure to permitting delays. Competitive differentiation is increasingly anchored in quality certification, dust-mitigation technology, and traceability systems that help buyers manage health-and-safety compliance.
Global Silica Sand Market Trends and Insights
Rising Demand for Premium-Clarity Flat and Solar Glass
Solar-grade glass plants require feedstock exceeding 99.99% SiO2, pushing spot prices toward USD 55 per ton as China's photovoltaic capacity additions tighten availability for conventional float glass lines. Canadian Premium Sand and other entrants plan vertically integrated furnaces to satisfy more than 100 GW of panel output by 2027. Multinational float-glass makers have earmarked close to USD 180 million for furnace retrofits that boost energy efficiency while locking in long-term offtake contracts for high-purity sand, underscoring trends in the silica sand market. These capital commitments confirm that premium silica will remain a supply-critical input while manufacturers pursue low-carbon glass production techniques certified under ISO 9001 standards.
Surging Frac-Sand Intensity per Shale Well
Individual horizontal wells now average 1,060% more sand than in 2013, driven by longer laterals and higher stage counts. Wet-sand logistics cut diesel usage by 90% and shave USD 100,000-300,000 per well, accelerating the switch to in-basin brown sand that reduces delivered-cost volatility. OSHA respirable-silica rules are spurring adoption of new dust-capture hoods and enclosed conveyors trends in the silica sand market locking in specification-driven procurement that favors certified suppliers.
Escalating Environmental Permitting Hurdles
The MSHA silica rule that took effect in June 2024 lowered permissible exposure to 50 µg/m3 and added mandatory medical surveillance, raising compliance costs for both new and legacy pits. In Manitoba, Sio Silica's proposed mine remains stalled after regulators called for a deeper hydro-geological review. European Chemicals Agency drafts signal tighter workplace exposure requirements that could cut output at smaller quarries lacking enclosed processing circuits. The higher hurdle rate is expected to curtail grassroots projects and concentrate production among operators with full ESG reporting frameworks.
Other drivers and restraints analyzed in the detailed report include:
- Growth in High-Purity Silica for Semiconductor Fabs
- Infrastructure Stimulus-Led Concrete Consumption
- Rapid Substitution by Recycled Cullet in Container Glass
For complete list of drivers and restraints, kindly check the Table Of Contents.
Segment Analysis
High-purity grades above 99.5% SiO2 account for 6.19% CAGR, the fastest within the silica sand market. Ultra-pure sand provides the substrate for semiconductor crucibles, solar float glass, and lithium-ion battery separators. Sibelc o's Spruce Pine expansion and Australian Silica Quartz Group's push to 99.997% purity illustrate the scale-up of value-added capacity.
Standard-grade material ranging from 95-99.5% SiO2 remains the volume anchor, holding 47.58% of the 2025 silica sand market share. Demand stems from foundry molds, construction aggregates, and filter media. Innovations such as iron-ore tailings purification that lifts rejects to 99.99% purity blend sustainability with revenue upside, though low-purity sand below 95% SiO2 is largely restricted to local ready-mix and backfill usage.
The Silica Sand Report is Segmented by Purity Level (High-Purity More Than 99. 5% SiO2, Standard 95-99. 5%, Low-Purity Less Than 95%), End-User Industry (Glass Manufacturing, Foundry, Chemical Production, Construction, Paints and Coatings, Ceramics and Refractories, Filtration, Oil and Gas, and Other End-User Industries), and Geography (Asia-Pacific, North America, Europe, South America, and Middle-East and Africa).
Geography Analysis
Asia-Pacific commands 40.21% of global volume and is projected to grow at a 6.27% CAGR, driven by China's photovoltaic boom, India's urban transport corridors, and Indonesia's USD 45.74 billion silicon-downstream agenda. Australia's Cape Flattery mine, grading 99.93% SiO2, positions Queensland to triple output before 2030.
North America's consumption is propelled by shale proppant at the core. The United States exported USD 809 million worth of silica sand during 2024-2025, with Canada and Japan the top buyers. Mexico's growing manufacturing sector drives imports, benefiting from USMCA trade relationships and proximity to U.S. suppliers. The region's regulatory environment intensifies with new MSHA silica rules effective June 2024, requiring comprehensive exposure monitoring and medical surveillance programs.
Europe faces challenging conditions in silica sand industry with construction demand slowdowns affecting traditional silica sand applications, though specialized segments maintain growth momentum. The European Chemicals Agency's draft exposure limits may concentrate supply in Northern Europe where enclosed processing is already standard. Middle East and Africa draw on infrastructure projects and glass container demand, while South America's allure lies in automotive supply-chain shifts and new critical-minerals policies.
- Atlas Energy Solutions Inc. (Hi-Crush Inc.)
- Badger Mining Corporation
- Chongqing Changjiang River Moulding Material Group Co. Ltd
- COVIA HOLDINGS LLC
- Euroquarz GmbH
- Gulf Coast Sand
- JFE Mineral & Alloy Company Ltd
- Mitsubishi Corporation
- PUM GROUP
- Sibelco
- Sil Industrial Minerals
- Source Energy Services
- Superior Silica Sands
- TOCHU CORPORATION
- U.S. Silica (Apollo Global Management)
Additional Benefits:
- The market estimate (ME) sheet in Excel format
- 3 months of analyst support
TABLE OF CONTENTS
1 Introduction
- 1.1 Study Assumptions and Market Definition
- 1.2 Scope of the Study
2 Research Methodology
3 Executive Summary
4 Market Landscape
- 4.1 Market Overview
- 4.2 Market Drivers
- 4.2.1 Rising demand for premium-clarity flat and solar glass
- 4.2.2 Surging frac-sand intensity per shale well
- 4.2.3 Growth in high-purity silica for semiconductor fabs
- 4.2.4 Infrastructure stimulus-led concrete consumption
- 4.2.5 AI-driven foundry process optimisation
- 4.3 Market Restraints
- 4.3.1 Escalating environmental permitting hurdles
- 4.3.2 Rapid substitution by recycled cullet in container glass
- 4.3.3 Emerging low-quartz proppants (ceramics, resin-coated)
- 4.4 Value Chain Analysis
- 4.5 Porter's Five Forces
- 4.5.1 Bargaining Power of Suppliers
- 4.5.2 Bargaining Power of Buyers
- 4.5.3 Threat of New Entrants
- 4.5.4 Threat of Substitutes
- 4.5.5 Degree of Competition
5 Market Size and Growth Forecasts (Value and Volume)
- 5.1 By Purity Level
- 5.1.1 High-Purity (more than 99.5% SiO2)
- 5.1.2 Standard (95 to 99.5%)
- 5.1.3 Low-Purity (less than 95%)
- 5.2 By End-user Industry
- 5.2.1 Glass Manufacturing
- 5.2.2 Foundry
- 5.2.3 Chemical Production
- 5.2.4 Construction
- 5.2.5 Paints and Coatings
- 5.2.6 Ceramics and Refractories
- 5.2.7 Filtration
- 5.2.8 Oil and Gas
- 5.2.9 Other End-user Industries
- 5.3 By Geography
- 5.3.1 Asia-Pacific
- 5.3.1.1 China
- 5.3.1.2 India
- 5.3.1.3 Japan
- 5.3.1.4 South Korea
- 5.3.1.5 Indonesia
- 5.3.1.6 Australia
- 5.3.1.7 Rest of Asia-Pacific
- 5.3.2 North America
- 5.3.2.1 United States
- 5.3.2.2 Canada
- 5.3.2.3 Mexico
- 5.3.3 Europe
- 5.3.3.1 Germany
- 5.3.3.2 United Kingdom
- 5.3.3.3 Italy
- 5.3.3.4 France
- 5.3.3.5 Russia
- 5.3.3.6 Rest of Europe
- 5.3.4 South America
- 5.3.4.1 Brazil
- 5.3.4.2 Argentina
- 5.3.4.3 Rest of South America
- 5.3.5 Middle-East and Africa
- 5.3.5.1 Saudi Arabia
- 5.3.5.2 United Arab Emirates
- 5.3.5.3 South Africa
- 5.3.5.4 Rest of Middle-East and Africa
- 5.3.1 Asia-Pacific
6 Competitive Landscape
- 6.1 Market Concentration
- 6.2 Strategic Moves
- 6.3 Market Share (%)/Ranking Analysis
- 6.4 Company Profiles (includes Global level Overview, Market level overview, Core Segments, Financials as available, Strategic Information, Market Rank/Share for key companies, Products and Services, and Recent Developments)
- 6.4.1 Atlas Energy Solutions Inc. (Hi-Crush Inc.)
- 6.4.2 Badger Mining Corporation
- 6.4.3 Chongqing Changjiang River Moulding Material Group Co. Ltd
- 6.4.4 COVIA HOLDINGS LLC
- 6.4.5 Euroquarz GmbH
- 6.4.6 Gulf Coast Sand
- 6.4.7 JFE Mineral & Alloy Company Ltd
- 6.4.8 Mitsubishi Corporation
- 6.4.9 PUM GROUP
- 6.4.10 Sibelco
- 6.4.11 Sil Industrial Minerals
- 6.4.12 Source Energy Services
- 6.4.13 Superior Silica Sands
- 6.4.14 TOCHU CORPORATION
- 6.4.15 U.S. Silica (Apollo Global Management)
7 Market Opportunities and Future Outlook
- 7.1 White-space and Unmet-Need Assessment
