


|
시장보고서
상품코드
1937313
의류 물류 : 시장 점유율 분석, 업계 동향과 통계, 성장 예측(2026-2031년)Apparel Logistics - Market Share Analysis, Industry Trends & Statistics, Growth Forecasts (2026 - 2031) |
||||||
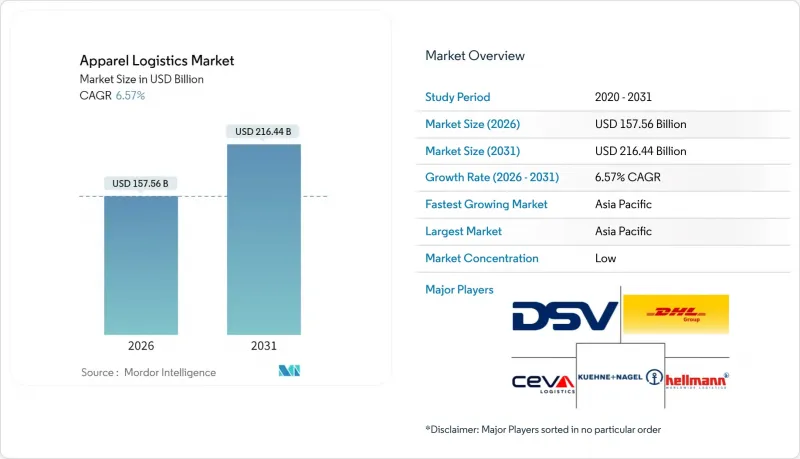
의류 물류 시장은 2025년에 1,478억 5,000만 달러로 평가되었으며, 2026년 1,575억 6,000만 달러에서 2031년까지 2,164억 4,000만 달러에 달할 것으로 예측됩니다.
예측 기간(2026-2031년) 동안 CAGR은 6.57%로 예상됩니다.

디지털화, 순환 경제 모델, 엄격한 환경 규제가 세계 패션 공급망을 재구성하고 있습니다. E-Commerce의 지속적인 성장, 주문형 배송에 대한 기대, SKU의 증가로 인해 공급업체들은 실시간 재고 가시성 도구와 라스트 마일 최적화에 대한 투자를 해야 하는 상황에 직면해 있습니다. 아시아태평양은 광범위한 생산 기반에 의해 우위를 유지하고 있지만, 미주와 유럽의 니어쇼어링은 점차 무역의 흐름을 바꾸고 있습니다. 운송 서비스는 2024년 매출의 68%를 차지하며 여전히 필수적인 분야이며, AI를 활용한 예측 및 재판매 지원과 같은 부가가치 서비스는 4.10%로 가장 빠르게 성장하고 있습니다. 미국 내 의류 반품률 20.8%에 대응하기 위해 3PL 업체들이 리버스 물류 분야로 서비스를 확대하면서 경쟁이 심화되고 있습니다. Scope 3 배출량에 대한 규제 감시 강화와 변동하는 운임은 비용 구조를 더욱 복잡하게 만들고, 저탄소 연료와 자동화에 대한 투자 가속화를 촉진하고 있습니다.
세계 의류 물류 시장 동향과 인사이트
2025년 이후 : 온디맨드 의류 및 즉시 배송에 대한 수요 급증
인도에서는 퀵커머스 플랫폼이 연간 75-85%의 성장률을 보이며 2025년까지 GMV(총 거래액)가 60억 달러에 달했습니다. 동남아시아 전역에서도 비슷한 추세가 확인되고 있습니다. 물류 사업자들은 라스트 마일 네트워크를 재구축하고 있으며, JD로지스틱스는 2025년까지 수십 개 시장에서 2-3일 내 국경 간 배송을 약속하고 있습니다. By Rotation과 같은 P2P 렌탈 사업자들은 당일 수요에 대응하기 위해 실매장 수령 거점을 운영하고 있습니다. 배송 차량의 배기가스 배출에 대한 지자체 규제로 인해 인구 밀집 도시에서는 전기 밴으로의 전환이 가속화되고 있습니다. 각 브랜드가 마이크로 풀필먼트 센터를 시험적으로 도입하는 가운데, 실시간 배차 소프트웨어는 2시간 배송을 달성하는 데 결정적인 역할을 합니다. 예측 분석을 통합한 제공업체는 2024년 파일럿 사업에서 라스트 마일 비용을 12% 절감했습니다.
E-Commerce 중심의 SKU 증가로 인해 재고 가시성 향상 필요
패션 브랜드는 여러 채널에서 수천 개의 SKU를 관리하기 때문에 기존 시스템은 시대에 뒤떨어져 있습니다. 월마트의 AI 트렌드 분석 엔진은 소셜 신호를 몇 주 만에 구매 주문으로 전환하여 버퍼 재고를 줄입니다. AI 지원 수요 계획을 도입한 소매업체는 재고 회전율이 30% 향상되었다고 보고하고 있습니다. 과잉 재고는 여전히 심각하여 가격 인하 압력을 증폭시키고 있습니다. EU 디지털 제품 여권 요건에 따라 2026년까지 세분화된 제품 추적이 의무화되어 데이터 요구가 더욱 엄격해질 것입니다. 이에 따라 3PL 사업자들은 주문, 이행, 반품을 동기화하는 컨트롤 타워 플랫폼을 통합하여 화물 중개업체가 아닌 기술 파트너로서 입지를 다지고 있습니다.
높은 반품률로 인해 역물류 비용이 상승합니다.
2024년 미국 소매 반품 총액은 8,900억 달러에 달했고, 의류 부문의 평균 반품률은 20.8%, 보관비용은 배송비용의 2.5배에 달했습니다. 영국에서 빈번한 반품으로 인해 연간 86억 달러 상당의 비용이 발생하고 있습니다. Happy Returns의 AI 기반 분류 시스템은 처리 시간을 70% 단축합니다. 그러나 반품 사기는 2024년 15.14%까지 증가하여 RFID 및 컴퓨터 비전 인증의 도입이 시급한 상황입니다. 각 브랜드들은 운송 시 배출량과 처리 비용을 최소화하기 위해 저가의 상품에 대해 'Keep It' 환불 제도를 시범적으로 도입하고 있으며, 재판매 파트너십을 통해 반품된 상품을 2차 시장 재고로 전환하는 움직임도 진행 중입니다.
부문 분석
운송 부문은 2025년 매출의 67.32%를 차지하며 의류 물류 시장 규모 995억 2,000만 달러에 달합니다. 지역 내 운송은 도로 운송이 핵심이며, 해상 운송은 국제 대량 화물을 취급하고, 항공 운송은 고가품 및 정시 배송을 위한 틈새 시장을 유지하고 있습니다. 대체연료의 도입으로 화주들이 Scope 3 배출량 감축을 요구하면서 계약 구조가 재편되고 있습니다. 운송 부문은 그 규모에도 불구하고 운송 능력의 변동과 탄소세 부과로 인한 수익률 압박이 심화되고 있습니다.
부가가치 서비스는 4.05%의 가장 높은 CAGR 전망을 보이며, 과거 브랜드가 담당했던 키트화, 라벨링, 수선, 리커머스를 가능하게함으로써 의류 물류 시장을 확장하고 있습니다. 라이더와 같은 업체들은 현재 옴니채널 풀필먼트 센터 내에서 포장 개봉, 봉제, 품질 검사를 패키징하고 있습니다. 이러한 기능은 물류가 브랜드 업무에 깊숙이 통합되어 계약 유지율 향상과 수익률 향상을 촉진합니다. POS(Point of Sale) 데이터와 창고 관리 시스템의 통합을 통해 수요 연동형 포장을 실현하고, 지속가능성 평가 모듈에서는 각 소포에 탄소 데이터를 부여합니다.
지역별 분석
아시아태평양은 2025년 매출의 40.58%를 차지하며 의류 물류 시장 규모를 599억 9,000만 달러로 끌어올리고 2031년까지 CAGR 5.03%로 확대될 것으로 예상됩니다. 중국, 베트남, 방글라데시, 인도가 수출을 주도하는 가운데 역내 소비지출 증가로 지역 유통망이 강화되고 있습니다. RCEP(역내포괄적경제동반자협정)의 무역특혜와 인도네시아-필리핀의 항만 인프라 구축으로 리드타임이 단축되고 있습니다. 중국의 이중 관리 에너지 목표와 같은 지속가능성 규제로 인해 공장은 항구 근처에 위치하게 되었고, 배출 패턴이 변화하고 있습니다.
북미에서는 성숙한 E-Commerce 사업과 지속적인 자동화 투자가 결합되고 있습니다. 캘리포니아 인랜드 엠파이어와 펜실베니아 리하이 밸리의 노동력 부족은 로봇 도입을 가속화하여 단위당 취급 비용을 낮추고 있습니다. 멕시코의 니어쇼어링 붐(특히 바히오 회랑을 따라)은 국경을 넘는 트럭 운송 경로의 재배치를 촉진하고 양국 간 물류 센터를 지원하고 있습니다. 미국에서는 수소 트럭 도입에 대한 주정부 차원의 인센티브가 연방정부의 IRA 세액공제를 보완하고 있습니다.
유럽에서는 규제 준수가 중요시되고 CSRD(기업 지속가능성 보고 지침)와 CBAM(탄소 국경 조정 메커니즘)이 철도 및 내륙수로로 교통수단 전환을 유도하고 있습니다. 동유럽의 3PL(제3자 물류) 업체들은 튀르키예와 모로코에서 증가하는 패스트패션 생산량을 처리하기 위해 처리 능력을 확대하고 있습니다. EU 배출권 거래제의 탄소 가격 설정은 해상 화물 추가 요금을 인상하고, 컨테이너 적재 효율화를 위해 항만 창고에서의 집하를 강화하도록 유도합니다. 독일, 프랑스, 북유럽 국가에서의 EC 보급은 도시 저배출 구역 내 마이크로 풀필먼트의 확산을 지원합니다.
기타 특전:
- 엑셀 형식의 시장 예측(ME) 시트
- 애널리스트의 3개월간 지원
자주 묻는 질문
목차
제1장 소개
제2장 조사 방법
제3장 주요 요약
제4장 시장 구도
제5장 시장 규모와 성장 예측
제6장 경쟁 구도
제7장 시장 기회와 향후 전망
KSM 26.03.12The Apparel Logistics Market was valued at USD 147.85 billion in 2025 and estimated to grow from USD 157.56 billion in 2026 to reach USD 216.44 billion by 2031, at a CAGR of 6.57% during the forecast period (2026-2031).
As digitalization, circular-economy models, and stricter environmental rules reshape global fashion supply chains. Sustained e-commerce growth, on-demand delivery expectations, and SKU proliferation are compelling providers to invest in real-time inventory visibility tools and last-mile optimization. Asia-Pacific retains supremacy owing to its extensive production base, yet nearshoring in the Americas and Europe is gradually redirecting trade flows. Transportation services remain indispensable, accounting for 68% of 2024 revenue, while value-added services such as AI-enabled forecasting and resale support are expanding fastest at 4.10%. Competitive intensity is rising as 3PLs broaden offerings into reverse logistics to counter a 20.8% apparel return rate in the United States. Regulatory scrutiny of Scope-3 emissions and volatile freight rates further complicate cost structures, spurring accelerated investment in low-carbon fuels and automation.
Global Apparel Logistics Market Trends and Insights
2025+ Surge in On-Demand Apparel and Instant Delivery Expectations
Quick-commerce platforms are set to grow 75-85% annually in India, hitting USD 6 billion GMV by FY 2025, and similar momentum is visible across Southeast Asia. Logistics providers are re-engineering last-mile networks, with JD Logistics pledging 2-3-day cross-border delivery to dozens of markets in 2025. Peer-to-peer rental players such as By Rotation now run physical pick-up points to satisfy same-day demand. Municipal rules on delivery-vehicle emissions accelerate the shift to electric vans in dense cities. As brands test micro-fulfillment centers, real-time routing software becomes decisive in meeting two-hour delivery windows. Providers integrating predictive analytics have trimmed last-mile costs by 12% during 2024 pilots.
E-Commerce-Driven SKU Proliferation Requiring Sophisticated Inventory Visibility
Fashion brands juggle thousands of SKUs across multiple channels, rendering legacy systems obsolete. Walmart's AI trend-to-product engine converts social signals into purchase orders within weeks, slashing buffer stock. Retailers deploying AI-assisted demand planning report 30% faster inventory velocity. Excess stock remains acute, magnifying markdown pressure. EU Digital Product Passport requirements mandate granular item tracking by 2026, further tightening data needs. In response, 3PLs bundle control-tower platforms that synchronize ordering, fulfillment, and returns, positioning themselves as tech partners rather than freight brokers.
High Returns Rate Inflating Reverse-Logistics Costs
US retail returns totaled USD 890 billion in 2024, with apparel averaging a 20.8% rate and carrying costs 2.5X greater than outbound fulfillment. Serial returners in the United Kingdom create USD 8.6 billion equivalent in annual costs. AI-driven sortation systems from Happy Returns reduce processing time 70%. However, return fraud climbed to 15.14% in 2024, forcing the adoption of RFID and computer-vision authentication. Brands are piloting "keep-it" refunds for low-value items to minimize transport emissions and handling overhead, while resale partnerships convert returns into secondary-market inventory.
Other drivers and restraints analyzed in the detailed report include:
- Sustainability Regulations Pushing Green Logistics Investments
- AI-Driven Warehouse Automation Lowering Per-Unit Handling Costs
- Volatile Freight Rates and Capacity Constraints
For complete list of drivers and restraints, kindly check the Table Of Contents.
Segment Analysis
Transportation generated 67.32% of 2025 revenue and anchors the apparel logistics market size at USD 99.52 billion. Road remains the backbone for intra-regional moves, while sea freight handles bulk international volumes; air retains a niche for high-value or time-critical stock. Adoption of alternative fuels is reshaping contract structures as shippers seek lower Scope-3 emissions. Despite its scale, transportation faces intensifying margin pressure from capacity volatility and carbon levies.
Value-added services posted the strongest 4.05% CAGR outlook, expanding the apparel logistics market by enabling kitting, labeling, repair, and recommerce tasks that once sat with brands. Providers like Ryder now bundle unpacking, sewing, and quality inspection within omnichannel fulfillment nodes. These functions embed logistics deeper into brand operations, driving stickier contracts and higher yields. Integration of point-of-sale data with warehouse management systems supports demand-driven packaging, while sustainability scoring modules attach carbon data to each parcel.
The Apparel Logistics Market Report is Segmented by Service (Transportation (Road, Rail, Air, Sea and Inland Waterways), Warehousing & Distribution Services, Value-Added Services), Product Type (Clothing, Footwear, Accessories), and Geography (North America, South America, Asia-Pacific, Europe, Middle East and Africa). The Market Forecasts are Provided in Terms of Value (USD).
Geography Analysis
Asia-Pacific held 40.58% of 2025 revenue and anchors the apparel logistics market size at USD 59.99 billion, rising at 5.03% CAGR through 2031. China, Vietnam, Bangladesh, and India dominate exports, yet intra-Asian consumer spending strengthens regional distribution networks. RCEP trade preferences and port infrastructure upgrades in Indonesia and the Philippines shorten lead times. Sustainability regulations, such as China's dual-control energy targets, push factories to near ports, altering drayage patterns.
North America combines mature e-commerce operations with on-going automation investments. Labor shortages in California's Inland Empire and Pennsylvania's Lehigh Valley accelerate adoption of robotics, lowering per-unit handling costs. Mexico's nearshoring boom, especially along the Bajio corridor, re-positions cross-border trucking lanes and supports bi-national distribution centers. U.S. state incentives for hydrogen trucking complement federal IRA credits.
Europe emphasizes regulatory compliance, with CSRD and CBAM guiding modal shifts toward rail and inland waterways. Eastern European 3PLs expand capacity to serve rising fast-fashion production in Turkey and Morocco. Carbon pricing in the EU Emissions Trading System raises ocean-freight surcharges, prompting more consolidation at port warehouses to optimize container loads. E-commerce penetration in Germany, France, and the Nordics supports micro-fulfillment deployment inside urban low-emission zones.
List of Companies Covered in this Report:
- Ceva Logistics
- DSV
- Deutsche Post DHL Group
- Kuehne + Nagel
- Hellmann Worldwide Logistics
- Apparel Logistics Group Inc.
- PVS Fulfillment-Service GmbH
- Logwin AG
- GAC Group
- Nippon Express
- Genex Logistics
- Expeditors International of Washington Inc.
- BGROUP SRL
- FedEx Supply Chain
- GXO Logistics
- Bleckmann Logistics
- OIA Global
- XPO Logistics
- Lalamove
- JD Logistics
Additional Benefits:
- The market estimate (ME) sheet in Excel format
- 3 months of analyst support
TABLE OF CONTENTS
1 Introduction
- 1.1 Study Assumptions and Market Definition
- 1.2 Scope of the Study
2 Research Methodology
3 Executive Summary
4 Market Landscape
- 4.1 Market Overview
- 4.2 Market Drivers
- 4.2.1 2025+ surge in on-demand apparel and instant delivery expectations
- 4.2.2 E-commerce-driven SKU proliferation requiring sophisticated inventory visibility
- 4.2.3 Sustainability regulations pushing green logistics investments
- 4.2.4 Expansion of near-market manufacturing in Americas and Europe
- 4.2.5 AI-driven warehouse automation lowering per-unit handling costs
- 4.2.6 Rise of apparel rental and recommerce models boosting reverse logistics
- 4.3 Market Restraints
- 4.3.1 High returns rate inflating reverse-logistics costs
- 4.3.2 Volatile freight rates and capacity constraints
- 4.3.3 Labor shortages in warehousing hotspots
- 4.3.4 Regulatory scrutiny of Scope-3 transport emissions
- 4.4 Value / Supply-Chain Analysis
- 4.5 Regulatory Landscape
- 4.6 Technological Outlook
- 4.7 Porter's Five Forces
- 4.7.1 Threat of New Entrants
- 4.7.2 Bargaining Power of Suppliers
- 4.7.3 Bargaining Power of Buyers
- 4.7.4 Threat of Substitutes
- 4.7.5 Competitive Rivalry
- 4.8 Government Regulations and Initiatives
- 4.9 Spotlight-Effect of E-commerce on Traditional Apparel Logistics Supply Chain
- 4.10 Review and Commentary on Reverse Logistics
- 4.11 Impact of COVID-19 and Geo-Political Events on the Market
5 Market Size and Growth Forecasts
- 5.1 By Service (Value)
- 5.1.1 Transportation
- 5.1.1.1 Road
- 5.1.1.2 Rail
- 5.1.1.3 Air
- 5.1.1.4 Sea and Inland Waterways
- 5.1.2 Warehousing and Distribution Services
- 5.1.3 Value-added Services
- 5.1.1 Transportation
- 5.2 By Product Type
- 5.2.1 Clothing
- 5.2.2 Footwear
- 5.2.3 Accessories
- 5.3 By Geography (Value)
- 5.3.1 North America
- 5.3.1.1 United States
- 5.3.1.2 Canada
- 5.3.1.3 Mexico
- 5.3.2 South America
- 5.3.2.1 Brazil
- 5.3.2.2 Peru
- 5.3.2.3 Chile
- 5.3.2.4 Argentina
- 5.3.2.5 Rest of South America
- 5.3.3 Asia-Pacific
- 5.3.3.1 India
- 5.3.3.2 China
- 5.3.3.3 Japan
- 5.3.3.4 Australia
- 5.3.3.5 South Korea
- 5.3.3.6 South East Asia (Singapore, Malaysia, Thailand, Indonesia, Vietnam, and Philippines)
- 5.3.3.7 Rest of Asia-Pacific
- 5.3.4 Europe
- 5.3.4.1 United Kingdom
- 5.3.4.2 Germany
- 5.3.4.3 France
- 5.3.4.4 Spain
- 5.3.4.5 Italy
- 5.3.4.6 BENELUX (Belgium, Netherlands, and Luxembourg)
- 5.3.4.7 NORDICS (Denmark, Finland, Iceland, Norway, and Sweden)
- 5.3.4.8 Rest of Europe
- 5.3.5 Middle East and Africa
- 5.3.5.1 United Arab of Emirates
- 5.3.5.2 Saudi Arabia
- 5.3.5.3 South Africa
- 5.3.5.4 Nigeria
- 5.3.5.5 Rest of Middle East And Africa
- 5.3.1 North America
6 Competitive Landscape
- 6.1 Market Concentration
- 6.2 Strategic Moves
- 6.3 Market Share Analysis
- 6.4 Company Profiles (includes Global Level Overview, Market Level Overview, Core Segments, Financials as available, Strategic Information, Market Rank/Share for key companies, Products and Services, and Recent Developments)
- 6.4.1 Ceva Logistics
- 6.4.2 DSV
- 6.4.3 Deutsche Post DHL Group
- 6.4.4 Kuehne + Nagel
- 6.4.5 Hellmann Worldwide Logistics
- 6.4.6 Apparel Logistics Group Inc.
- 6.4.7 PVS Fulfillment-Service GmbH
- 6.4.8 Logwin AG
- 6.4.9 GAC Group
- 6.4.10 Nippon Express
- 6.4.11 Genex Logistics
- 6.4.12 Expeditors International of Washington Inc.
- 6.4.13 BGROUP SRL
- 6.4.14 FedEx Supply Chain
- 6.4.15 GXO Logistics
- 6.4.16 Bleckmann Logistics
- 6.4.17 OIA Global
- 6.4.18 XPO Logistics
- 6.4.19 Lalamove
- 6.4.20 JD Logistics
7 Market Opportunities and Future Outlook
- 7.1 White-space and Unmet-need Assessment
